
Abstract
We present a novel homogeneous in vitro assay format and apply it to the quantitative determination of the enzymatic activity of a tyrosine kinase. The assay employs a short peptidic substrate containing a single tyrosine and a single probe attached via a cysteine side chain. The structural flexibility of the peptide allows for the dynamic quenching of the probe by the nonphosphorylated tyrosine side chain. The probe responds with changes in its fluorescence lifetime depending on the phosphorylation state of the tyrosine. We use this effect to directly follow the enzymatic phosphorylation of the substrate, without having to resort to additional assay components such as an antibody against the phosphotyrosine. As an example for the application of this assay principle, we present results from the development of an assay for Abelson kinase (c-Abl) used for compound profiling. Adjustments in the peptide sequence would make this assay format suitable to a wide variety of other tyrosine kinases.
Introduction
K
Classical drug discovery approaches based on low molecular weight (LMW) compounds have so far primarily yielded compounds that target the ATP binding pocket. A major concern with this approach is target specificity since the ATP binding site is structurally conserved within this enzyme class. Information on target potency and target selectivity can be obtained by profiling compounds on vast panels of kinases during the hit-to-lead and lead optimization phase in the drug discovery process. The assays in those panels are preferably based on a generic principle for better comparability.
In 2005, von Ahsen and Boemer 6 reviewed commonly used drug screening approaches for kinases. The authors highlighted some requirements for suitable assay formats: (a) homogeneous mix-and-measure assays that avoid coupled enzyme cascades, (b) generating an increase in the readout signal (i.e., one that is proportional to the amount of product in the monitored reaction), (c) and low sensitivity toward compound interference. Several techniques fall into this category, as reviewed by Comley, 7 among them scintillation proximity assay (SPA), (time-resolved) fluorescence resonance energy transfer (FRET), and fluorescence lifetime (FLT).
In 2007, Lebakken et al. 8 investigated fluorescence lifetime as a potential signal for assaying kinases. A change in the lifetime of a label covalently bound to staurosporine was used to monitor the displacement of staurosporine from a kinase’s ATP binding pocket by an LMW compound. Their choice of a red-fluorescent probe with a relatively short lifetime below 2 ns, offering a very small assay window of only 600 ps, severely limited the practical usefulness of their proposed assay format.
Recently, we have reported the successful adoption of FLT for screening of protease inhibitors. 9 Key for the successful application was the use of an acridone-derived label with a relatively long lifetime of 14 ns in its nonquenched state and an easily achievable lifetime change of about 4 ns, a prerequisite for a stable and reliable enzymatic activity assay.
Making use of the knowledge gained in the studies on proteases, we now present details of an in vitro activity assay for the tyrosine kinase c-Abl and its application in kinase inhibitor testing. c-Abl is a drug target for the treatment of chronic myeloid leukemia (CML). 10-12 The novel assay format presented here meets the criteria set out by von Ahsen and Boemer. 6 A short peptidic substrate contains a single tyrosine and the fluorescence lifetime probe PureTime®14 (PT14) attached via a cysteine side chain. The structural flexibility of the peptide allows for the dynamic quenching of the probe by the tyrosine. The readout signal is based on the increase in the fluorescence lifetime of the reporter dye upon the phosphorylation of the tyrosine residue. Changes in the signal occur in real time, so that the enzymatic reaction can be kinetically monitored. Since the fluorescence lifetime is an intrinsic parameter of the fluorescence emission, it is less prone to interferences arising from volume differences, sample geometry, or turbidity compared to alternative optical readouts such as fluorescence intensity or absorption. Furthermore, the advanced analysis of the recorded fluorescence intensity decay curves allows for the separation of the probe signal from the distorting background signal arising, for example, from compound fluorescence. However, the most remarkable advantage of the assay format is its simplicity: it does not require any further assay components than the enzyme, ATP, and the mono-labeled peptide substrate.
Materials and Methods
Production of Abelson kinase
The catalytic domain (amino acids 218-500) of human c-Abl (UniProt P00519; RefSeq NM_007313) was expressed in a Baculo virus expression vector system using Sf-9 cells. The protein was purified by immobilized metal affinity chromatography (IMAC) using the N-terminal His-tag. The protein concentration was determined by using the “Pierce 660-nm assay” (Thermo Fisher Scientific, Rockford, IL). The purity of the protein is about 90%, as estimated from Coomassie-stained polyacrylamide gel electrophoresis (PAGE) analysis.
Substrate for the fluorescence lifetime-based assay
The amino acid sequence of the peptide used in our study as the substrate for c-Abl has been described previously. 13 A slight modification on the peptide sequence (i.e., the introduction of an additional N-terminal cysteine that enabled us to label the peptide with the dye PT14 site specifically) was sufficient in terms of optimization for the c-Abl assay. The fluorescently labeled peptide H-Cys(PT14)-Glu-Ala-Ile-Tyr-Ala-Ala-Pro-Phe-Ala-Lys-Lys-Lys-NH2 was purchased from Biosyntan (Berlin, Germany). Within the substrate sequence given above, PT14 is the acridone-based fluorescence lifetime probe. The substrate was obtained as dry powder (MW: 1870.2 g mole−1, purity: 95% as determined by high-performance liquid chromatography (HPLC)). It was dissolved in water-free, argon-saturated DMSO and kept as a 5.5-mM stock solution at 20°C. All other chemicals were of analytical grade.
The lifetime probe PT14 (PureTime®14; 6-(9-oxo-9H-acridin-10-yl)-hexanoate) was purchased from AssayMetrics (Cardiff, UK). The concentrations of the PT14-containing substrate solutions were determined by absorption measurements using the molar extinction coefficient of ϵ = 7580 M−1 cm−1 (at 394 nm in aqueous solution) for PT14.
Equipment for the assay development
All protein- and peptide-containing solutions were handled in Maxymum Recovery tubes (Axygen Scientific, Inc., Union City, CA). The enzyme and the substrate solutions were transferred to 384-well plates (Black Microtiter 384 Plate, round well, catalog number 95040020; Thermo Electron Oy, Vantaa, Finland) by means of a CyBi-Well® 96-channel pipetter (CyBio AG, Jena, Germany). The test compounds were dissolved in 90% (v/v) DMSO/water and kept at a stock concentration of 10 mM at 4°C.
Buffer conditions
Enzymatic reactions were conducted in the assay buffer, comprising 50 mM Tris/HCl at pH 7.5, 10 mM MgCl2, 10 mM beta-glycerophosphate, 10 µM sodium orthovanadate, and 0.02% (v/v) Tween-20. On the day of the experiment, 0.02% (w/v) bovine serum albumin (BSA) and 1 mM dithioerythritol (DTE) were added freshly. Both enzyme and substrate were diluted in the assay buffer.
Instrumentation for fluorescence lifetime measurements
FLT measurements based on time-correlated single-photon counting (TCSPC) were conducted either on an Ultra Evolution (TECAN, Maennedorf, Switzerland) or on a NanoTaurus (Edinburgh Instruments, Livingston, UK) fluorescence lifetime reader. The excitation light source was a semiconductor laser at 405 nm, producing picosecond light pulses with a repetition frequency of 10 MHz or 5 MHz, respectively. The emission was collected through band-pass filters with similar specifications in both instruments, a 450-nm band-pass filter with 25 nm bandwidth in the TECAN Ultra and a 445-nm filter with 45 nm bandwidth in the Edinburgh Instruments NanoTaurus instrument, respectively. The measurement time per well was 1 s, yielding approximately 1000 counts in the peak channel. The parameters used as assay readout were the fluorescence lifetimes obtained by fitting the recorded fluorescence intensity decays with a monoexponential curve model done automatically by the control software of the instruments.
Data fitting
For the determination of initial rate constants, kinetic constants, and IC50 values, the experimental data were fitted using the nonlinear regression program Origin 7.5SR6 (OriginLab Corporation, Northampton, MA).
Calculation of product concentration from measured FLT data
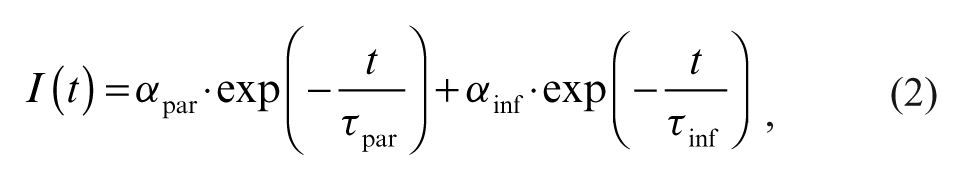
Assuming monoexponential intensity decays for the peptidic substrate (index: par) and phosphorylated product (index: inf), a mixed sample will generally produce a biexponential decay. The average fluorescence lifetime,
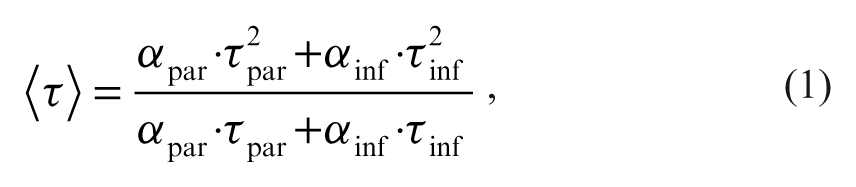
as calculated from the amplitudes α and lifetimes τ of the biexponential decay curve,
where τpar and τinf are the FLTs of PT14 in the substrate and the product (phosphorylated peptide), respectively, can be transformed into the concentration of the product, [P], by the expression
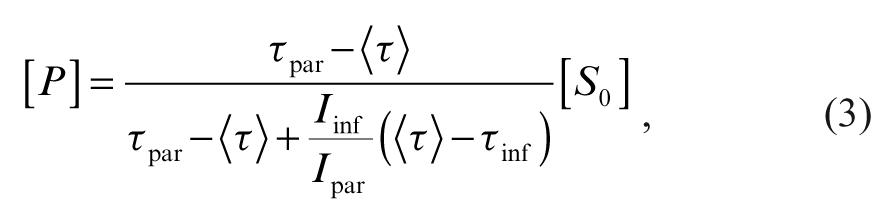
where I par and I inf are the steady-state fluorescence intensities of the PT14 in the substrate and the phosphorylated peptide, respectively, and where [So] is the initial substrate concentration. 14 With the resolution of the existing instrumentation, it is in practice often more appropriate to fit the decay curves of mixed samples with a monoexponential instead of a biexponential model, thus approximating the average lifetime. 9
Determination of the apparent kinetic constants KM, kcat, and kcat/KM for the fluorescent substrate and for ATP under initial velocity conditions
The Michaelis constant, KM, was obtained from measurements conducted at constant enzyme concentration (in the nM range) and different substrate concentrations (in the range of 0.25-25 µM). Under conditions where the substrate concentration, [S], is significantly higher than the enzyme concentration and the substrate consumption is <20%, the initial enzymatic velocity, v, follows the Michaelis-Menten equation
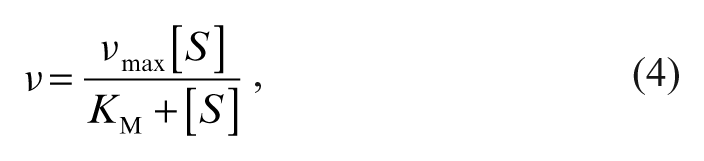
where v max is the maximal velocity at saturating substrate concentrations.
Equation (4) can be applied to the curve obtained by plotting the measured enzyme velocities versus the corresponding substrate concentration, leading to the values for KM and v max by a nonlinear regression fit.
The k cat value is then defined as
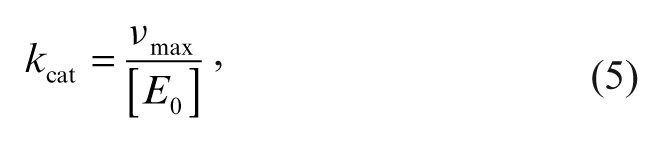
where [E0] is the total enzyme concentration.
Determination of IC50 values
For the determination of IC 50 values, the assay was performed at room temperature in 384-well microplates with a total assay volume of 25.25 µL per well. For the dose-response curves (DRCs), we prepared serial dilutions of each test compound in 90% (v/v) DMSO/water, with concentrations varying in half-log steps between 3 mM and 30 nM. Subsequently, the assay plates were prepared by first transferring 250 nL from the dilution series into a dry 384-well microplate using a HummingWell® pipetter (CyBio AG) and adding 12.5 µL of enzyme solution to each well. After 1 h of preincubation, a further 12.5 µL containing ATP and the substrate peptide was added. Both enzyme and substrate were dissolved in assay buffer. The final assay concentration of the kinase c-Abl was 4.5 nM, as well as 1.5 µM and 7.5 µM for the peptide and ATP, respectively. After the addition of the substrate solution, the final DMSO concentration in the assay was 0.9% (v/v). The effect of the compound on the enzymatic activity was obtained from the linear part of the progress curves and determined by an endpoint measurement of the fluorescence intensity decays of the individual samples after 1 h (t = 60 min). The FLT was calculated automatically with software provided with the instrument. The IC 50 value was calculated from the plot of percentage of inhibition relative to controls versus inhibitor concentration according to
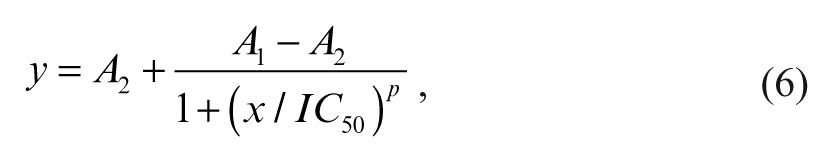
where y is the percent inhibition at the inhibitor concentration, x. A 1 is the lowest inhibition value (i.e., 0%) and A2 the maximum inhibition value (i.e., 100%). The exponent p is the Hill coefficient.
Results
Fluorescence lifetime-based in vitro activity assay for human c-Abl kinase
The novel assay format for c-Abl outlined in the following section uses the fluorescence lifetime of the probe PT14 as the readout parameter. We used a peptidic substrate and positioned the probe in close proximity to the tyrosine residue. Although the nonphosphorylated tyrosine residue quenches the fluorescence of the probe, thereby reducing the fluorescence lifetime of the probe, the phosphorylated form does not. Therefore, the enzymatic conversion to the phosphorylated state correlates with an increase in the detected fluorescence lifetime. The fluorescence lifetime is determined from the fluorescence intensity decay as measured by time-correlated single-photon counting. By fitting the data to a monoexponential decay, fluorescence lifetimes of 9.5 ns and 13.8 ns were obtained for the substrate and the product, respectively (data not shown).
To date, there is no published report on the photo-physical details of the quenching mechanism between PT14 and tyrosine. Our hypothesis is that the main process for energy transfer is via photo-induced charge transfer. Here the two involved moieties must be able to come into close contact. The flexible peptide chain, together with the dye linker, provides for enough relative mobility, whereas attaching both partners to the same chain increases the likelihood for them to meet on the time scale set by the fluorescence lifetime. According to this hypothesis, we synthesized a range of peptides within our protease projects. Varying the type of quencher (tyrosine or tryptophan) and the relative positions of quencher and label along the peptide, we were able to optimize the change of the lifetimes signals while retaining enzyme recognition of the substrates. 9 However, in the present case, no further optimization of the peptidic substrate was required, and the overall dynamic range was sufficient for developing the enzymatic activity assay right from the start.
Catalytic efficiency of the phosphorylation of the fluorescent substrate C(PT14)EAIYAAPFAKKK-NH2
Determination of the kinetic constant, KM(peptide), and the maximal velocity, vmax(peptide), by measurements under initial velocity conditions
For the determination of the apparent kinetic constants KM and kcat for the peptide substrate under ATP saturating conditions (c(ATP) = 500 µM; KM(ATP) = 147 µM), enzymatic reactions were carried out with c-Abl concentrations of 0.8 and 1.6 nM and substrate concentrations of 0.25, 0.5, 1, 2, 3.5, 5, 7.5, 10, 12.5, and 17.5 µM. Equation (3) was used for the transformation of measured fluorescence lifetime into product concentration, with the parameters τpar = 9475 ps, τinf = 13757 ps, and I inf/I par = 1.76.
Figure 1 shows the plot of the initial enzyme velocities versus the corresponding substrate concentrations obtained for the measurement at a c-Abl concentration of 1.6 nM and an ATP concentration of 500 µM. Using equation (4), a nonlinear fit to the data yields the Michaelis constant, KM(peptide), of 1.5 ± 0.1 µM and a v max(peptide) value of (4.85 ± 0.01)·10−10 M s−1 at an enzyme concentration of 0.8 nM (data not shown) and a Michaelis constant, KM(peptide), of 1.7 ± 0.2 µM and a v max(peptide) value of (9.9 ± 0.3)·10−10 M s−1 at an enzyme concentration of 1.6 nM. The results obtained at the 2 different enzyme concentrations are in agreement, as the v max values have to change linearly with the enzyme concentration (equation (5)). On the basis of the enzyme concentration of 0.8 nM and 1.6 nM, k cat(peptide) values of 0.61 s−1 and 0.62 s−1, respectively, can be calculated with equation (5), which results in a mean value of k cat/KM(peptide) equal to (3.8 ± 0.5)·105 M−1 s−1.
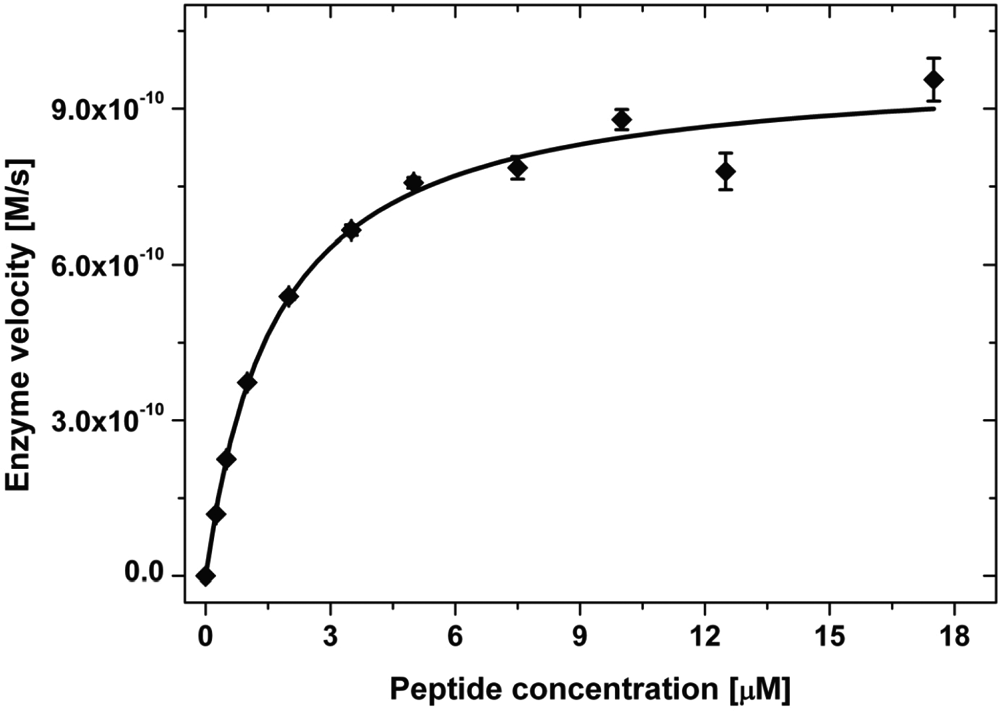
Initial enzyme velocity versus concentration of the peptidic substrate. The solid line is the result of a nonlinear fit of the data to equation (4), yielding the apparent Michaelis constant KM(peptide) = 1.7 ± 0.2 µM and the apparent maximal velocity νmax(peptide) = 1.0 ± 0.03 nM s−1. Each point represents an average of 4 replicate samples with the corresponding error bars. The measurement was done at a c-Abl concentration of 1.6 nM, an adenosine triphosphate (ATP) concentration of 500 µM, and concentrations of the peptidic substrate of 0, 0.25, 0.5, 1, 2, 3.5, 5, 7.5, 10, 12.5, and 17.5 µM.
Determination of the kinetic constant, KM(ATP), and the maximal velocity, vmax(ATP), by measurements under initial velocity conditions
For the determination of the apparent kinetic constants KM and kcat for ATP, enzymatic reactions were carried out with the peptide concentration at 1.5 µM, with c-Abl concentrations at 0.5 and 1.0 nM, and ATP concentrations of 1, 5, 10, 25, 50, 75, 100, 250, 500, 750, and 1000 µM. Transformation of measured fluorescence lifetime into product concentration was performed as described above.
Figure 2 shows the plot of the initial enzyme velocities versus the corresponding ATP concentrations obtained for the measurement done at a c-Abl concentration of 0.5 nM and a concentration of the peptidic substrate at 1.5 µM.
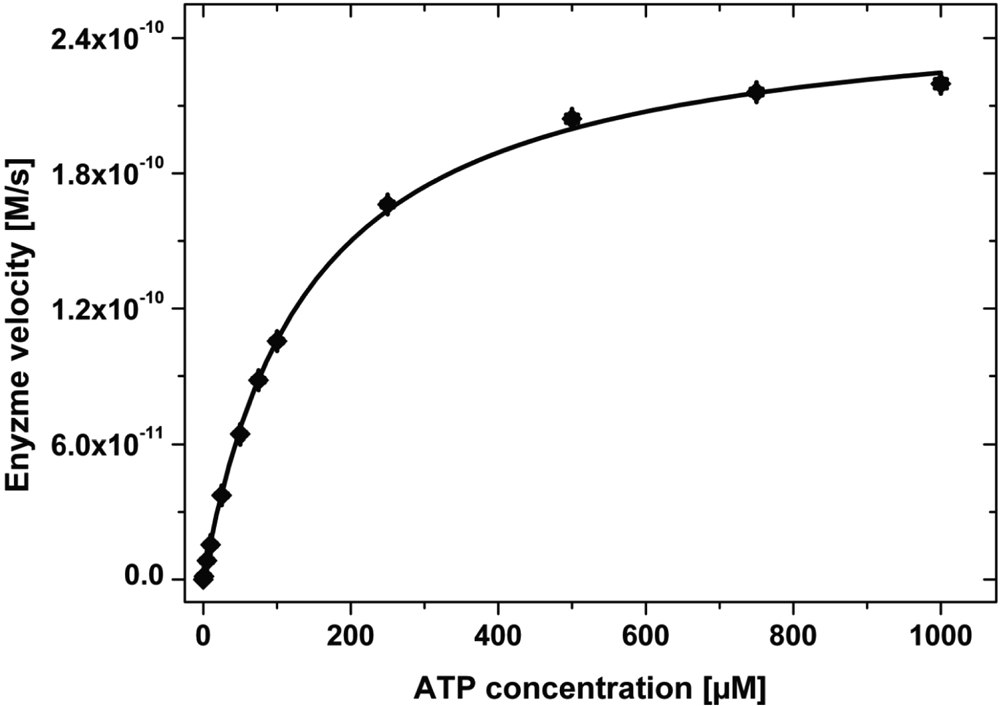
Initial enzyme velocity versus the adenosine triphosphate (ATP) concentration. The solid line is the result of a nonlinear fit of the data to equation (4), yielding the apparent Michaelis constant KM(ATP) = 142 ± 5 µM and the apparent maximal velocity νmax (ATP) = 0.256 ± 0.003 nM s−1. Each point represents an average of 4 replicate samples with the corresponding error bars. The measurement was done at a c-Abl concentration of 0.5 nM, a concentration of the peptidic substrate of 1.5 µM, and ATP concentrations of 0, 1, 5, 10, 25, 50, 75, 100, 250, 500, 750, and 1000 µM.
Using equation (4), a nonlinear fit to the data yields the Michaelis constant, KM(ATP), of 142 ± 5 µM and a v max(ATP) value of (2.57 ± 0.03)·10−10 M s−1 at an enzyme concentration of 0.5 nM and a Michaelis constant, K M(ATP), of 152 ± 6 µM and a v max(ATP) value of (5.05 ± 0.07)·10−10 M s−1 at an enzyme concentration of 1.0 nM (data not shown). On the basis of the enzyme concentrations of 0.5 nM and 1 nM, k cat values of 0.514 s−1 and 0.505 s−1, respectively, can be calculated with equation (5), which results in a mean value of (3.5 ± 0.2)·103 M−1 s−1 for the apparent k cat/KM(ATP).
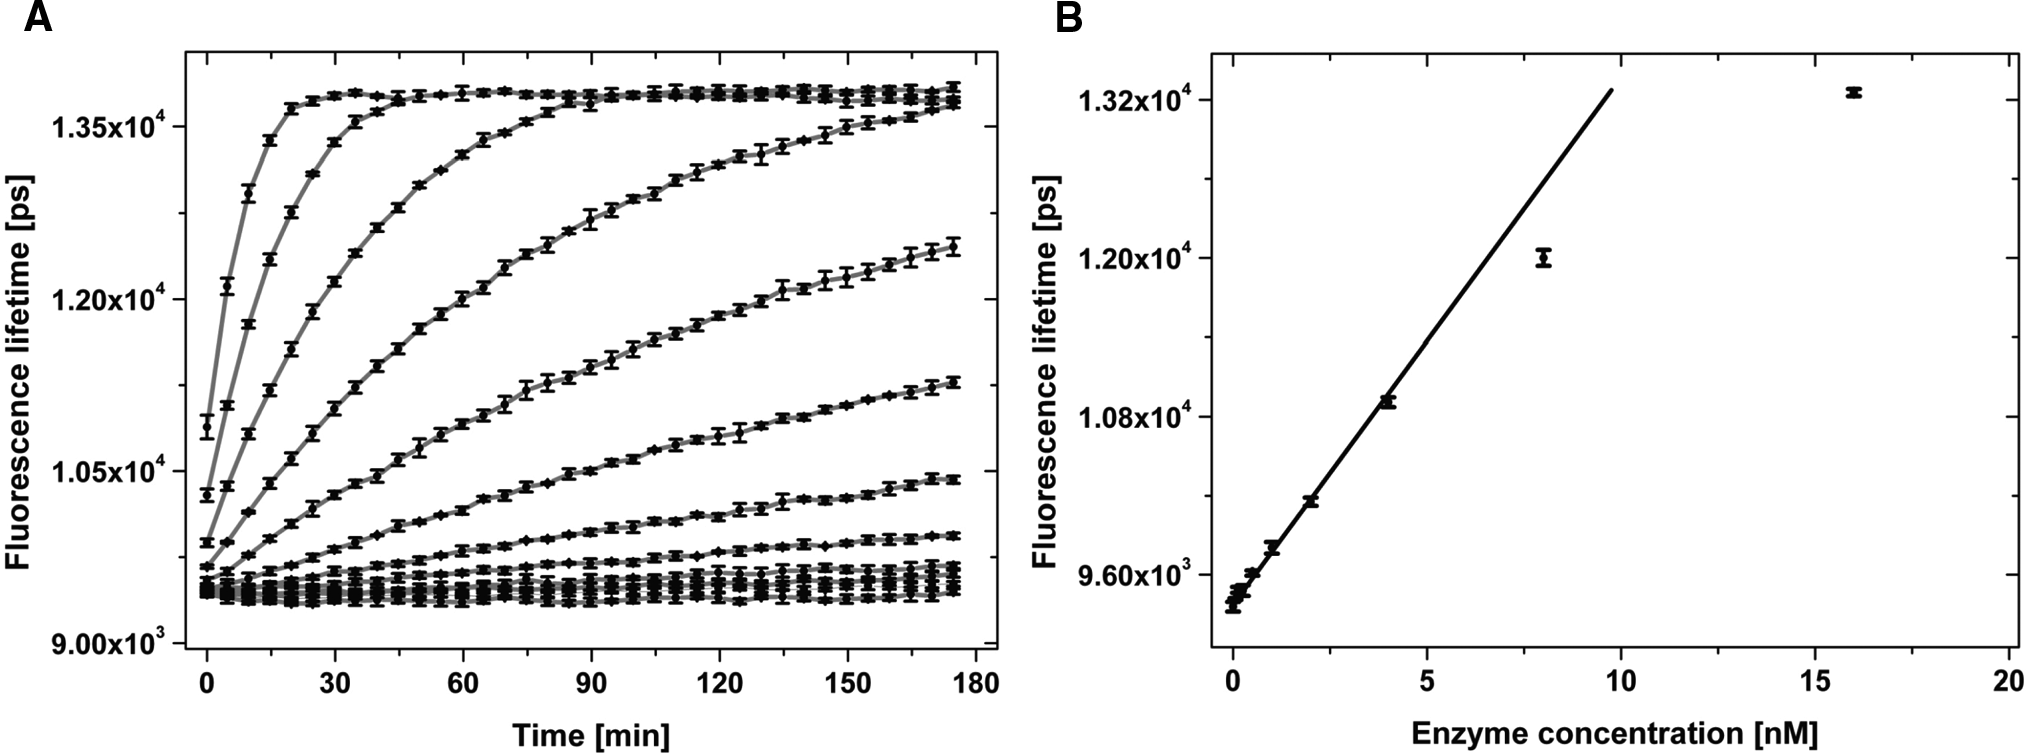
Endpoint linearity of the biochemical FLT-based assay for human cellular Abelson kinase
To further optimize the assay, the reaction was conducted with different enzyme concentrations. The concentrations of the peptide substrate and of ATP were kept constant at 2 µM and 7.5 µM, respectively. The ATP concentration was below the K M(ATP) value of 147 µM to achieve sensitivity for compounds competing for binding to the ATP pocket.
The enzyme reaction was found to be linear up to 1 h for enzyme concentrations up to at least 4 nM (
(
IC50 determination for known inhibitors of c-Abl
To characterize the assay and to demonstrate its applicability to routine kinase inhibitor testing, the standard inhibitor staurosporine ((9S,10R,11R,13R)-2,3,10,11,12,13-Hexahydro-10-methoxy-9-methyl-11-(methylamino)-9,13-epoxy-1H,9H-diindolo [1, 2, 3-gh: 3′, 2′, 1′-lm] pyrrolo [3, 4-j][1,7] benzodiazonin-1-one) and additional 11 known competitive reversible inhibitors of kinases were tested for their activity on c-Abl. We then compared the results of inhibition experiments obtained using the novel lifetime-based assay format with those obtained with previously established, alternative assays formats: a mobility shift assay (MSA) run on a Caliper® LC3000 reader (Caliper LifeSciences, Hopkinton, MA) employing a fluorescently labeled substrate with the same amino acid sequence as in the FLT substrate and a FlashPlate® assay (PerkinElmer, Waltham, MA). The MSA and the FlashPlate® assays were performed using ATP concentrations at the apparent KM value or slightly below that (i.e., 72% of KM), respectively. The other assay conditions were similar to those for the FLT assay.
In Table 1 , the IC 50 values obtained with the assay method presented here are summarized. A representative inhibition curve of the competitive inhibitor staurosporine on c-Abl is shown in Figure 4 .
IC50 Values for the Inhibition of c-Abl by Selected Kinase Inhibitors
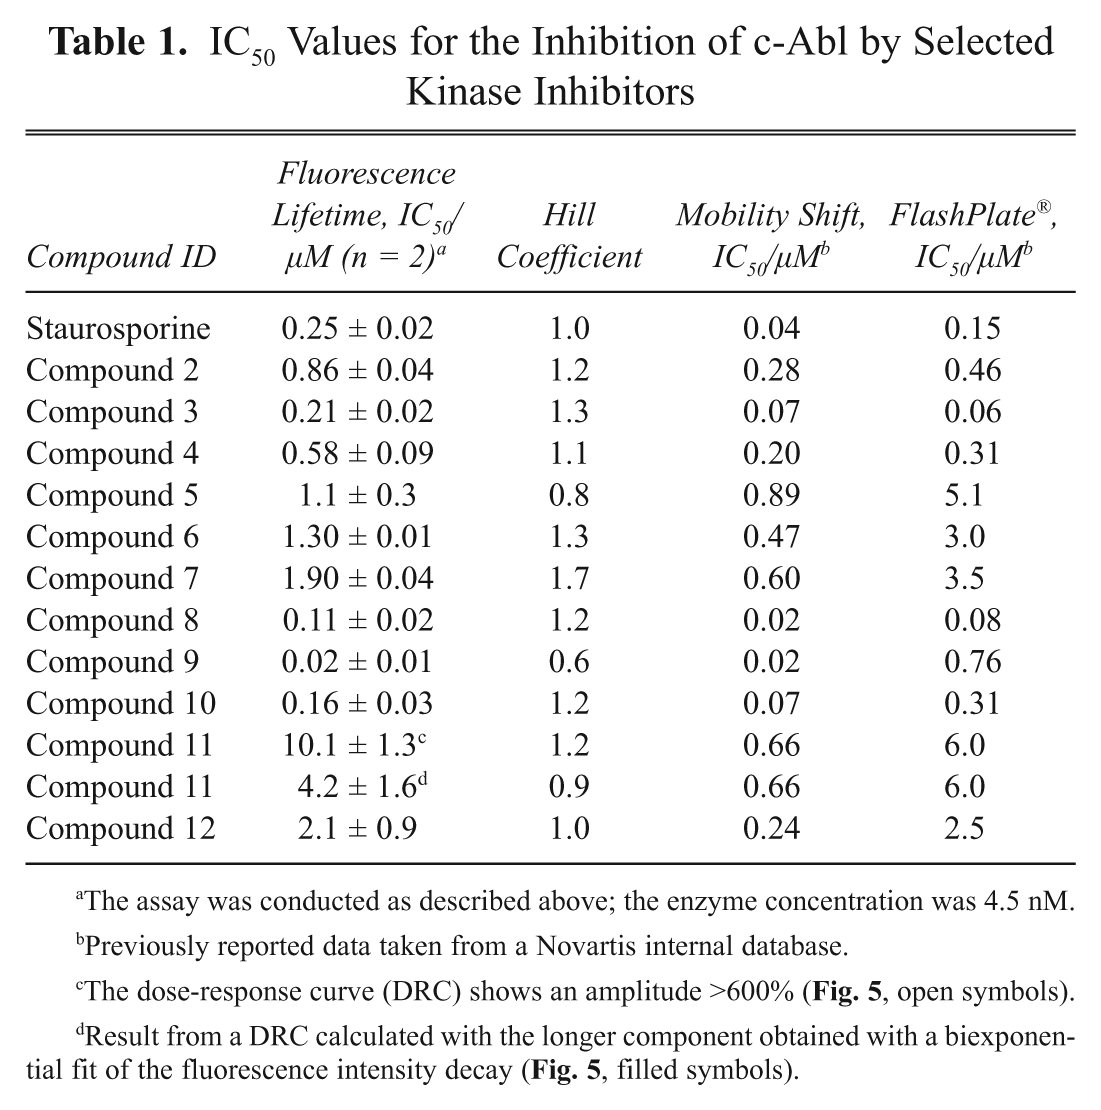
The assay was conducted as described above; the enzyme concentration was 4.5 nM.
Previously reported data taken from a Novartis internal database.
The dose-response curve (DRC) shows an amplitude >600% ( Fig. 5 , open symbols).
Result from a DRC calculated with the longer component obtained with a biexponential fit of the fluorescence intensity decay ( Fig. 5 , filled symbols).
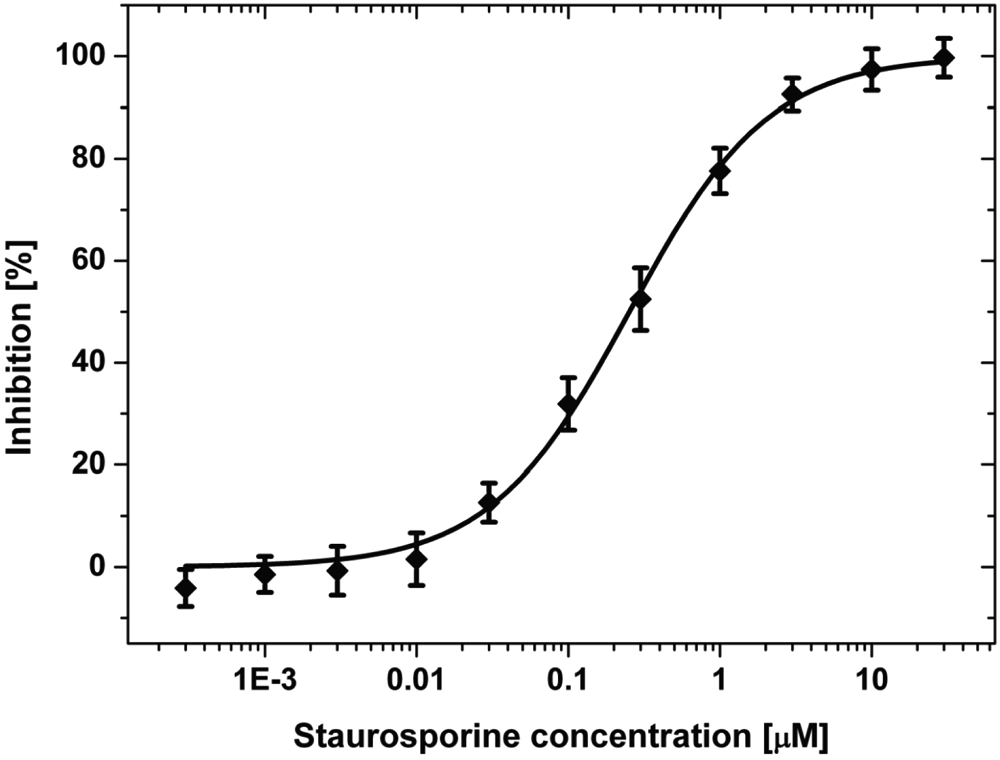
Determination of the IC 50 value of staurosporine on c-Abl. The assay was conducted with c-Abl in 384-well plates as described above. The plotted data points are the means of 8 wells with the corresponding error bars. The nonlinear curve fit to equation (6) (constrains: off-set = 0% and amplitude = 100%) leads to an IC 50 value of 0.25 ± 0.02 µM and a Hill coefficient of 0.95 ± 0.05.
The values show a good correlation with previous in-house data obtained with the MSA or the FlashPlate® assay. However, IC50 values obtained with the MSA are slightly lower in most cases.
Compound 11 is autofluorescent under the assay conditions used, leading to the observed inhibition values of above 600% at high compound concentrations ( Fig. 5 , open symbols).
However, performing a biexponential fit to the decay curves can eliminate the influence of the compound fluorescence. We assigned the short lifetime component to the fluorescence of the compound and the long lifetime component to that of PT14. The subsequent calculation of the percentile inhibition leads to the second DRC shown in Figure 5 (filled symbols). This DRC now shows the expected characteristics (i.e., an amplitude of approx. 100%). Here one of the inherent advantages of an FLT-based assay becomes obvious: the ability to discriminate between probe signal and interfering compound fluorescence.
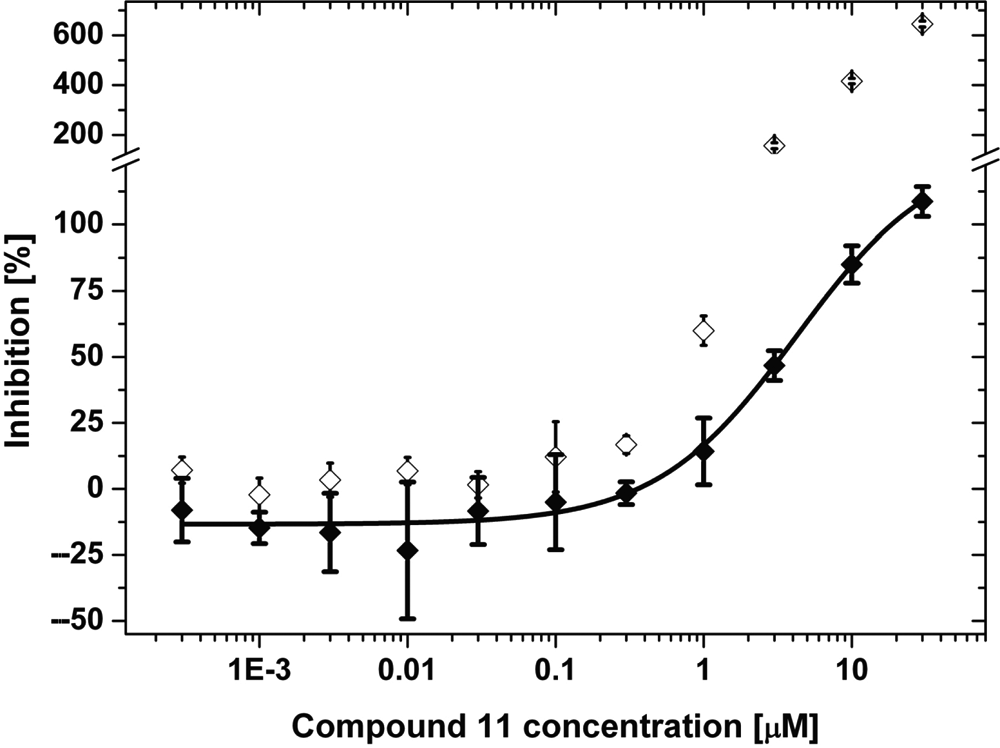
Fit of the dose-response curve of compound 11. The assay was conducted with c-Abl in 384-well plates as described above. The plotted data points are the means of 4 wells with the corresponding error bars. The nonlinear curve fit (equation (6), fit model “logistic,” no constrains) of the fluorescence intensity decays (rawdata) fitted as monoexponential decay leads to an IC50 value of 10.1 µM (open symbols; fit not shown). A similar fit of the longer fluorescence lifetime obtained from the rawdata fitted as a biexponential decay model leads to an IC50 value of 4.2 µM (filled symbols; line represents fit to function).
Discussion
This report describes a novel assay format for tyrosine kinases, as exemplified by an activity assay for c-Abl kinase. For our medium-throughput laboratory, we developed the assay to be run in 384-well plates. Its signal is based on measuring changes in the fluorescence lifetime of the acridone-derived label PT14. The tyrosine residue in the substrate quenches the fluorescence of the probe, whereas the phosphorylated tyrosine exhibits no quenching. Fluorescence lifetime values of 9.5 and 13.8 ns were obtained for the probe in the substrate and in the product, respectively. The concurrent increase in the probe’s fluorescence lifetime can be measured in real time, and thus the progress in the enzymatic reaction can be followed continuously, which allowed us to determine the kinetic constants of c-Abl with ease.
We found that the phosphorylation of the PT14-labeled substrate is characterized by the kinetic constants KM(peptide) and k cat/KM(peptide) of 1.7 µM and 3.8·105 M−1 s−1, respectively. These data compare well to those obtained for alternative substrates for c-Abl comprising the identical amino acid sequence. For an in-house MSA using a peptide N-terminally labeled with fluorescein, values for KM(peptide) and k cat/KM(peptide) of 7.3 µM and 1.1·104 M−1 s−1, respectively, were reported (unpublished data), whereas for the unlabeled peptide, a KM(peptide) value of 4 µM was published previously. 13
With a low enzyme concentration of 4.5 nM, we were able to record IC 50 values for inhibitors in the single-digit nanomolar range. A selection of known tyrosine kinase inhibitors was tested to characterize the assay. For staurosporine, an IC 50 value of 0.25 µM was obtained. Also, the IC 50 values obtained for other inhibitors were in good agreement with those determined previously using established in-house assay systems. The differences in the IC 50 values obtained with the different assay formats were usually in the range of a factor of 2 to 6, in rare cases up to a factor of 9. This is not an unusual observation when serial dilutions for the DRCs are prepared on different days from different compound stock solutions and when DRCs are determined in different assay formats.
One inhibitor proved fluorescent at the wavelengths used for the FLT assay. Fitting the standard monoexponential decay model to the experimental data resulted in artificially short lifetimes. In the subsequent data analysis, inhibition values of significantly greater than 100% were calculated. After manual reassessment of the raw data, we selected a biexponential decay model, assigning the longer lifetime to the probe. The derived DRC, albeit showing some scattering in the data at low inhibitor concentration, improved the overall data quality drastically at high inhibitor concentrations and allowed us to determine an IC50 for this compound. Although this mode requires further development for routine use, the potential of the FLT-based assay methods becomes obvious: the detailed analysis of fluorescence intensity decay data allows for the separation of the probe signals from those of interfering compound.
We also tested for an expansion of the assay approach toward other Tyr-kinases. For these studies, 4 additional PT14-labeled peptides were synthesized: Ac-KEQEDEPEGDYFEC(PT14)-LE-NH2, Ac-KEQEC(PT14)EPEGDYFEFLE-NH2, Ac-KEQED-EPC(PT14)GDYFEFLE-NH2, and Ac-KEQEDC(PT14)PEGDY-FEFLE-NH2. These peptides were tested for their suitability as substrates for a selection of additional 16 tyrosine kinases, including LCK, KDR, HER-1, IGF1R, PDGFRa, and INS1R. For all the kinases tested, we obtained changes in the FLT signal with at least one of the substrates (data not shown). The overall signal changes obtained from the progress curves recorded for the phosphorylation at constant substrate and different enzyme and concentrations made us confident that for all of the kinases tested, a FLT-based assay could have been developed. Subsequently, we completed the assay development for 2 of these additional kinases, supporting our assertion of the generic nature of the assay format.
Furthermore, in a pilot study, the same assay principle was followed to monitor the progress in de-phosphorylation of the phosphotyrosine containing peptide Ac-RGLLVpYGLSGC-(PT14)K-NH2 by the commercially available phosphatase YopH. As expected, the de-phosphorylation was accompanied by a decrease in the fluorescence lifetime of the PT14 probe (data not shown).
In conclusion, the fluorescence lifetime-based tyrosine kinase assay principle has the potential to offer an alternative to previously established formats. The main advantages of this new format are its simplicity and cost-effectiveness. Moreover, it is a generic platform adaptable to a wide variety of targets.
Footnotes
Acknowledgements
We thank Dr. Joerg Eder and Dr. Joerg Trappe for stimulating discussions and critical reading of the manuscript, as well as Mrs. Janis Liebetanz and Dr. Doriano Fabbro for providing the recombinant tyrosine kinase used in this study.