
Abstract
Zebrafish is widely used to understand neural development and model various neurodegenerative diseases. Zebrafish embryos are optically transparent, have a short development period, and can be kept alive in microplates for days, making them amenable to high-throughput microscopic imaging. As a result of high-throughput experiments, a large number of images can be generated in a single experiment, posing a challenge to researchers to analyze them efficiently and quantitatively. In this work, we develop an image processing focused on detecting and quantifying pigments in zebrafish embryos. The algorithm automatically detects a region of interest (ROI) enclosing an area around the pigments and then segment the pigments for quantification. In this process, the algorithm identifies the head and torso at first, and then finds the boundaries corresponding to the back and abdomen by taking advantage of a priori information about the anatomy of zebrafish embryos. The method is robust in terms that it can detect and quantify pigments even when the embryos have different orientations and curvatures. We used real data to demonstrate the performance of the method to extract phenotypic information from zebrafish embryo images and compared its results with manual analysis for verification.
Keywords
Introduction
Z
The small size of a zebrafish embryo makes it easy to be placed in a well plate for time-lapse high-throughput imaging. Phenotype-based small-molecule screening in zebrafish has been described in a number of studies. 7 The above features, in combination with the modern microscope, mean that one can obtain a large number of images of zebrafish embryos over a short time period. Correspondingly, challenges arise from the requirement to quickly analyze the large number of images effectively and efficiently.
Computerized analysis has been extensively explored to quantify zebrafish images such as their neurons. 8,9 One can differentiate neurons close to each other by varying their contour level intensity as shown by Kamali et al. 10 Other methods to segment touching nuclei in zebrafish images include gradient flow tracking and gradient vector diffusion. 11 An artificial intelligence–based method has also been developed to analyze the phenotypes of the zebrafish embryo. Vogt et al. 12 adopted cognition network technology from satellite image analysis to process zebrafish embryo images acquired in well plates. In addition to analyzing cellular structure in zebrafish, researchers have also monitored the behavior of zebrafish and their embryos in neurological studies.
Affecting manual analysis and inspection are the problems of inter- and intraobserver variations that may impair experimental reproducibility. Reducing variation would come through automatic quantification of pigments in a region of interest (ROI) in a zebrafish embryo that will also improve the efficiency of processing experiment results. Such a method would become the foundation for a high-throughput screening (HTS) tool of zebrafish images. The pigmentation of different groups will reflect how the zebrafish embryos respond to various environmental cues. Although image analysis methods have been adapted to process zebrafish images in the past, automatically identifying the appropriate ROI at first and then correctly segmenting pigmentations in the ROI in a high-throughput manner has been challenging. We developed a pipeline of imaging processing techniques to automatically detect the ROIs and then quantify the pigments contained in the ROIs.
Methods
Materials and image acquisition
Embryos were placed in a 24-well plate. Compounds were dissolved in 1 mL of egg water (final concentration at 5 and 50 µM for gamma secretase inhibitor [GSI] 18; 0.1% DMSO was used as a negative control). Embryo medium was replaced with the compound containing egg water, and the embryos were incubated at 28°C overnight before photographic images were taken. Compounds were applied at 1 day post-fertilization (dpf). Prior to the treatment at 24 hpf, embryos were de-chorionated in pronase. Bright-field microscopic images of zebrafish embryos were obtained for pigmentation quantification and comparison at 3 to 5 dpf.
Image-processing algorithm
Preprocessing
The pipeline of computerized zebrafish image analysis is outlined in
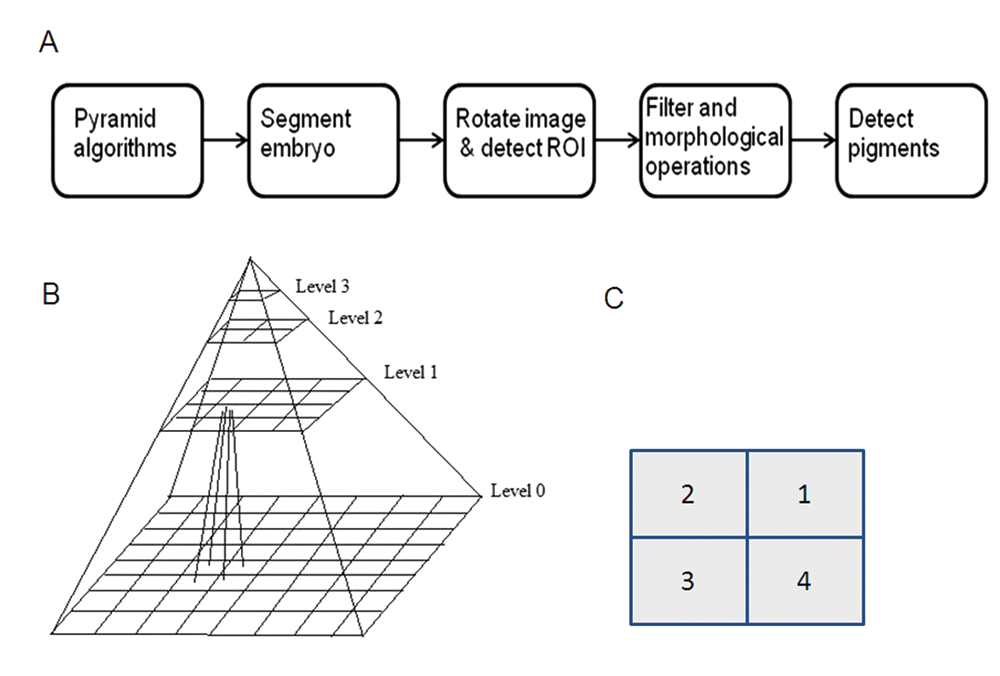
(
The segmentation procedure includes downsampling, edge detection, Wiener filtering, median filtering, and morphological operations. For the purpose of quickly processing a large number of images in a short time, a pyramid algorithm 13 is used to downsample the original image of 2048x1536 pixels to the size of 512 × 384. Compared with bilinear algorithm, a pyramid algorithm, a series of images in which one image is derived from a low-pass filter and the downsampling of its predecessor image, can better preserve details of the image. 13 Given an original image g0 with R × C pixels, after first application of low-pass filtering and downsampling, we obtain g1, which has a smaller size and lower resolution than g0. Repeating this process, we can obtain a series of images g2,. . .,g k . Here the low-pass filtering is equivalent to convolving gk with a 2D weight function that resembles a Gaussian distribution (i.e., Gaussian pyramid) such that
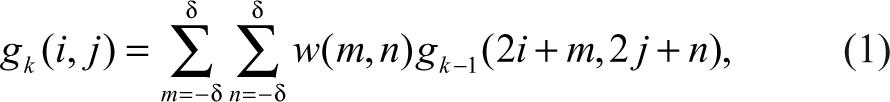
where (i,j) denotes a pixel in g k , k = 1,. . .,K and w is the Gaussian weight function. In this work, the δ is set to 2. For a pyramid of N levels, the row and column numbers of gk are given by

respectively, where k = 0,. . . ,N − 1 (
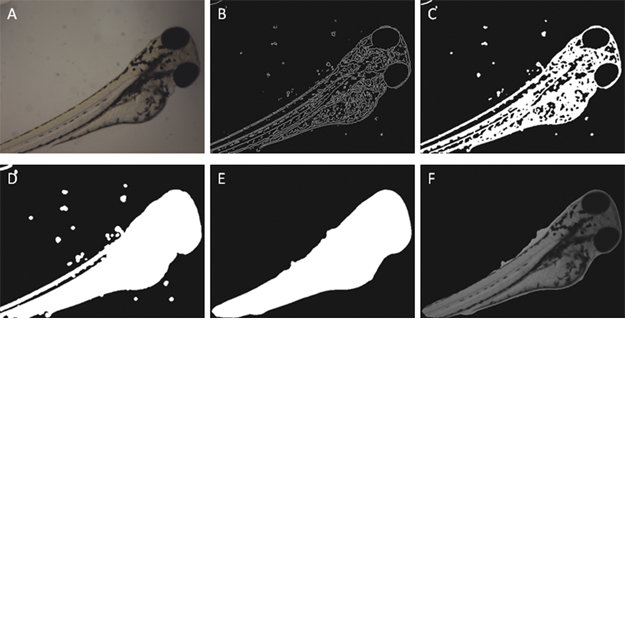
After being processed by the pyramid algorithm, the resulting image, gp, undergoes a series of steps to find the outer boundary of an embryo. The Sobel operator is applied to find edges in g p , where the embryo is considered the foreground. Due to the presence of noise, the edge map, g E , contains clusters, broken boundaries, and the internal structure of the embryo. To improve upon g E , we next use a low-pass filter to smooth out the artifacts. The filtered image g F tends to have a well-connected boundary outlining the shape of the embryo that, in turn, allows better segmentation. However, g F may still contain holes inside the embryo and some clusters outside the embryo, so we apply morphological operators of dilation followed by erosion to fill the holes and connect adjacent foreground pixels. After morphological operations, the image g M usually contains a well-connected embryo object. In some cases, clusters located outside the embryo in g M are then removed by median filtering on the binary image, g Bin . Performing a pixel-wise multiplication of the binary image with g P , we obtain the resulting gray-scale image of embryo g Emb that is then used to detect the ROI.
Detect ROI and segment pigmentations
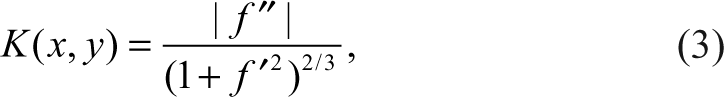
As the orientation of the embryo in each image varies, we next rotate the image so that the embryo’s head is located in the upper right quadrant with its back pointing upward and abdomen downward. The reason for rotating the image is to facilitate ROI detection in which we explore a priori anatomic information of the embryo so that the ROI is always located between the back and abdomen. The rotational operation first divides g
Emb
into 4 regions of same size (
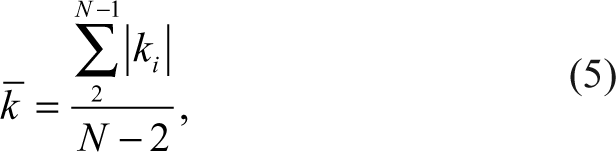
where f′ and f″ are the first- and second-order derivative of C at point (x,y), respectively. Assuming a discrete curve has N points P 1,. . .,Pi ,. . .,PN , according to the formula for calculating the continuous curve, the formula for calculating the discrete curvature ki at point Pi = (xi ,yi ) is given by
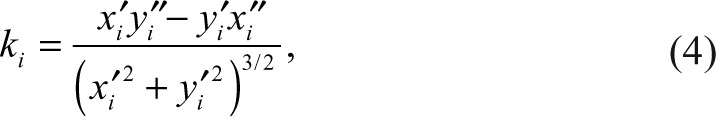
where xi ′ = xi+1 − xi-1 , xi ′ = xi+1 + xi-1 − 2x i and similarly for y′ and y″. Then the average curvature of a discrete curve in discrete format is
Based on the a priori information that the back of an embryo usually has a lower curvature than the abdomen, the boundary with a smaller k– is considered to be the embryo’s backside. By rotating and flipping embryos to ensure that the head locates to the upper right position and the back to the upper direction, we obtain consistent positioning of embryos in all images.
Within the embryo of g Emb , a watershed method is used to separate the head region from the torso that contains the pigmentation. Specifically, the pigmentation is contained in a region approximately halfway between the back and abdominal boundaries of the torso.
Pigments are determined by finding the connected domain tracking enclosed in the ROI. All the connected domains in the ROI are labeled after using Otsu’s method for segmentation. 14 If they satisfy the following two conditions, the connected domains are considered valid pigments.
The size of the connected domain should be within a certain range. We set the threshold of size from 10 to 70 pixels based on the magnification of the microscope and pyramid algorithm that is used to reduce the image size.
The Euclidean distance between the geometric center of a connected domain and the central line of the embryo is within a certain threshold as the pigments of interests are located close to the central line of the embryo. In this work, the threshold is set to 16 pixels.
In addition to pigments, we calculate the curvature of the centerline, defined as the ratio of the Euclidean distance between its two endpoints over the length of the curve,
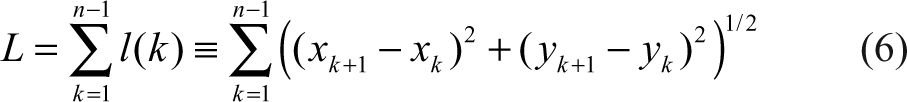
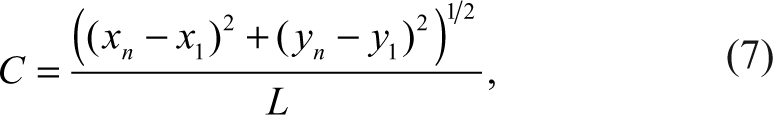
where xk ,yk ,k = 1,. . .,n are the pixels on the centerline. By definition, C is between 0 and 1, where a large C means the curve is close to a straight line.
Results and Discussion
An example of using the method to segment pigments is shown in
(
Additional examples are shown in
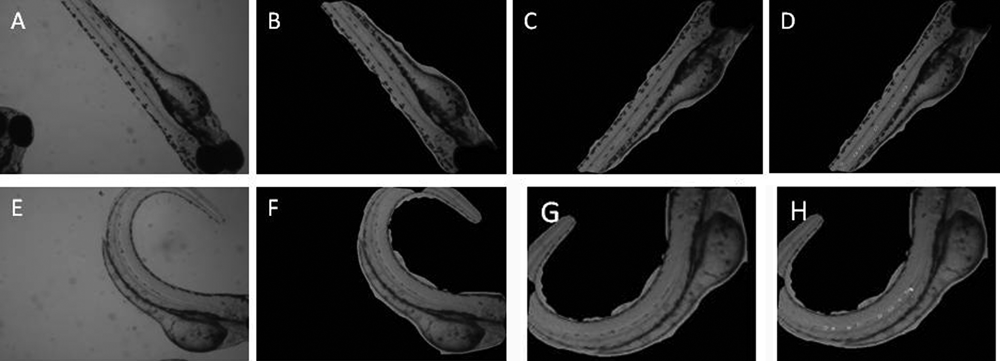
Two examples of the preprocessing steps. (
We applied the image-processing pipeline to 18 images of zebrafish embryos that were treated with DMSO or GSI18 at various concentrations. Among the tested embryos, 7 were treated with DMSO and 11 with GSI18. The average lengths of centerlines and curvatures of the two groups are shown in
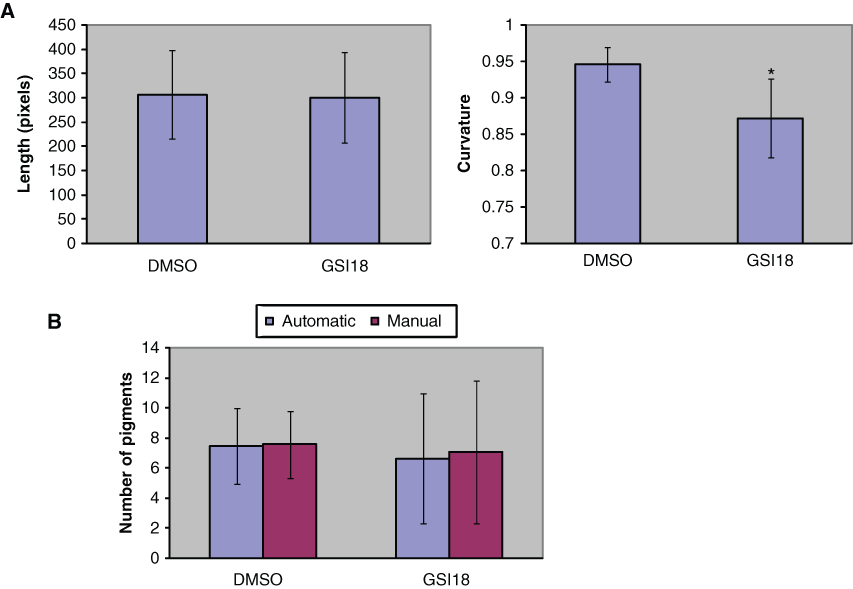
(
Comparing Segmented Pigments by the Proposed Method and Manual Analysis
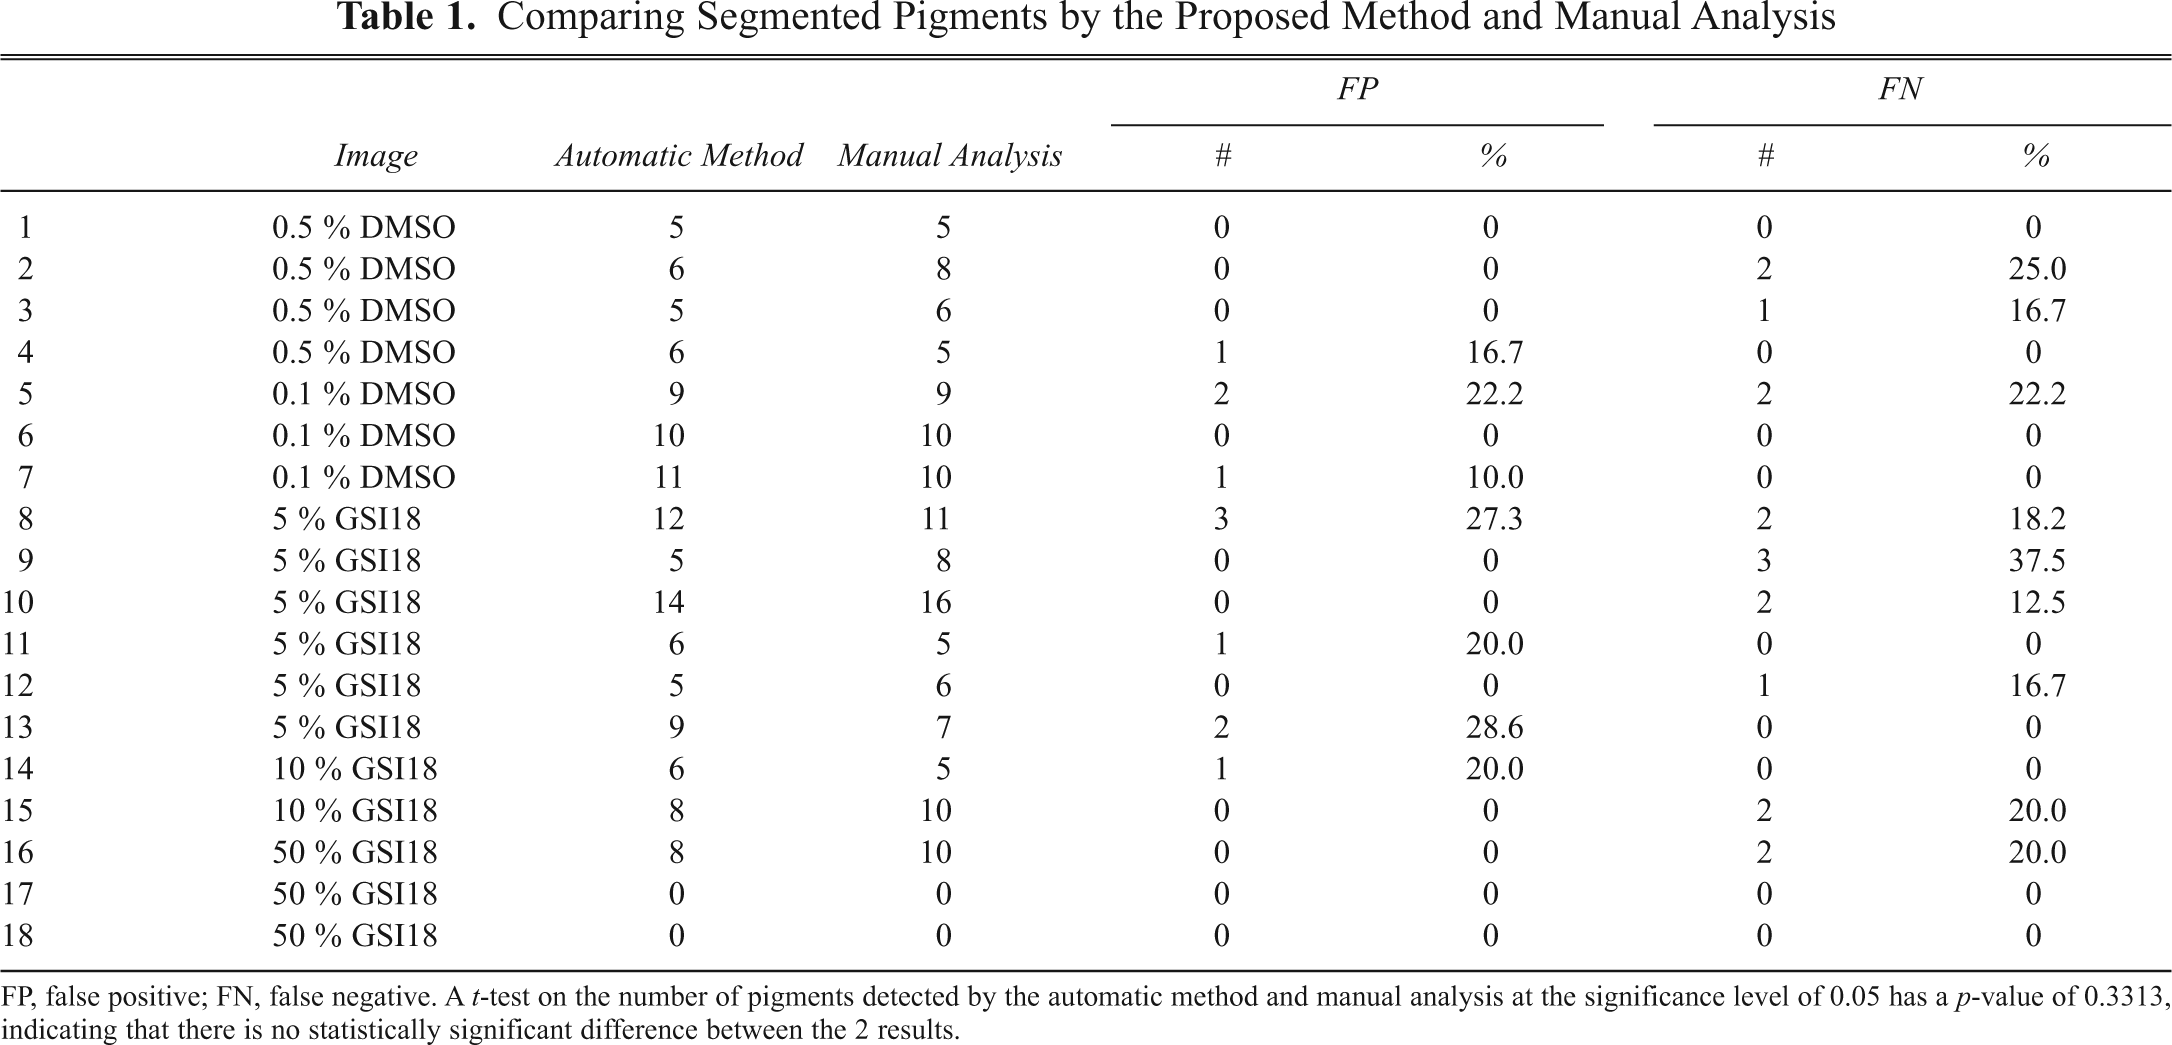
FP, false positive; FN, false negative. A t-test on the number of pigments detected by the automatic method and manual analysis at the significance level of 0.05 has a p-value of 0.3313, indicating that there is no statistically significant difference between the 2 results.
In summary, as zebrafish has become a widely used vertebrate model in neuroscience, a need has arisen for improved image analysis of that model. With the fast development of the automated microscope, researchers can now set a microscope to automatically image zebrafish embryos in well plates over a short period of time. 15 However, accompanying the capability to acquire a large number of zebrafish images is a lack of corresponding image analysis tools to quickly process and quantify the images. Although efforts have been dedicated to develop algorithms to analyze features of zebrafish images, existing work assumes that a predefined ROI is available. Here we present an automatic ROI detection and analysis technique that is well suited for HTS of zebrafish morphology. The results demonstrate that the fully automatic technique can achieve satisfactory quantification results without human interference, which is a key requirement of HTS.
The pipeline of image analysis algorithms that we developed automatically searches for an ROI and segments pigments. Our testing shows that, when compared with manual analysis, image-processing algorithms can obtain good results in terms of robustness and accuracy. Moreover, automatic analysis is repeatable and more objective than manual analysis. In our work, after detecting the ROI, the algorithm found the pigments by segmenting the ROI using Otsu’s method that maximizes the interclass variation between the foreground and background. In more challenging cases in which the ROI may have an inhomogeneous background, other methods may be used to segment the pigments. However, care needs to be taken to ensure low rates of false negatives and false positives. The thresholds used in the work are selected based on the prior information about zebrafish embryo and were shown to generate satisfactory results. As an HTS method, it is important to achieve a balance between the accuracy and computational complexity of the algorithm. For example, in this work, the pyramid algorithm reduced the image size for fast computations in the following steps at the cost of performing the pyramid computation itself. As computers become more powerful with a large memory size, it may be beneficial in the future to skip the pyramid computation. Similarly, although one can apply morphological operations only to fill the holes in the edge map, it is faster to use a low-pass filter to quickly fill a majority of the holes and then use morphological dilation and erosion to finalize the results. The automated method in its current form can analyze a single embryo located in the center of the image. With appropriate modification in segmentation and object identification, the automated method can be adapted to analyze multiple embryos in an image. The images of this work were acquired from a 24-well plate. Zebrafish embryo can also be assayed in 96- or 384-well plates, and in these cases, whole-well imaging will allow us to capture the entire embryo and extract additional features such as its full length. As the number of images increases dramatically in 96- or 384-well plate imaging, the requirements will be different as the size and resolution of the image change and the features of interest may also change. In this case, corresponding modification of the algorithms may be necessary.
Like all HTS algorithms, errors are unavoidable and may in some cases require user intervention. Acquiring images of high quality in the first place is often the most cost-effective step as it reduces the chances of errors in all steps of image processing. To some extent, a large sample size will smooth out image-processing errors. Therefore, when possible, it is beneficial to use more images to achieve a higher statistical power. In statistical analysis, often the variation in the quantification results from a group of zebrafish can be indicative of outliers in image quality and/or accuracy of HTS algorithms. In other words, a large variation may prompt a researcher to examine the original image quality and/or resulting images produced from the HTS algorithm to determine the variation’s cause. Another limitation of HTS algorithms is that they can analyze a large number of images with high efficiency but cannot replace a sound design of an HTS experiment in the first place. An HTS experiment must take many factors into consideration, including but not limited to time, number and cost of the subjects, number and cost of the agents to be screened, capability of the hardware, and image analysis tools available to the researchers.
Footnotes
Acknowledgements
The authors thank Kimberly Lawson of the Department of Radiology, the Brigham and Women’s Hospital, for help in editing the manuscript.
The work of X. Xu was supported by the Department of Radiology, the Brigham and Women’s Hospital, and National Science Foundation award number 0958345. The work of S. Xia is partly supported by the National Nature Science Foundation of China (No. 60772092).