
Abstract
Perturbed intracellular store calcium homeostasis is suggested to play a major role in the pathophysiology of Alzheimer disease (AD). A number of mechanisms have been suggested to underlie the impairment of endoplasmic reticulum calcium homeostasis associated with familial AD-linked presenilin 1 mutations (FAD-PS1). Without aiming at specifically targeting any of those pathophysiological mechanisms in particular, we rather performed a high-throughput phenotypic screen to identify compounds that can reverse the exaggerated agonist-evoked endoplasmic reticulum calcium release phenotype in HEK293 cells expressing FAD-PS1. For that purpose, we developed a fully automated high-throughput calcium imaging assay using a fluorescence resonance energy transfer–based calcium indicator at single-cell resolution. This novel robust assay offers a number of advantages compared with the conventional calcium measurement screening technologies. The assay was employed in a large-scale screen with a library of diverse compounds comprising 20,000 low-molecular-weight molecules, which resulted in the identification of 52 primary hits and 4 lead structures. In a secondary assay, several hits were found to alter the amyloid β (Aβ) production. In view of the recent failure of AD drug candidates identified by target-based approaches, such a phenotypic drug discovery paradigm may present an attractive alternative for the identification of novel AD therapeutics.
Keywords
Introduction
Alzheimer disease (AD) is the most frequent form of dementia in the elderly without an effective disease-modifying therapy. 1 Accumulation of extracellular plaques of β-amyloid (Aβ) protein and intracellular neurofibrillary tangles of hyperphosphorylated tau protein in brain are the major pathological AD hallmarks and, in accordance, the main drug targets for AD drug development today. 1 Nevertheless, dysregulated intracellular calcium homeostasis is proposed as an early key event in AD pathogenesis that underlies the disease hallmarks and associated cognitive deficits.2–5 In fact, impaired calcium homeostasis has been shown to trigger and accelerate Aβ and tangle pathologies6,7 while also mediating synaptic failure and neuron loss.8,9 Therefore, pharmacological reversal of calcium dyshomeostasis potentially represents an alternative viable approach for AD therapy. Hence, we aimed at stabilizing intracellular store calcium homeostasis, particularly in the endoplasmic reticulum (ER), as an innovative target for AD drug discovery. To that end, we developed a high-throughput calcium imaging assay, screened a library of 20,000 small molecules, and identified four lead structures that reversed the familial AD-linked mutant presenilin 1 (FAD-PS1)–mediated impairment of ER calcium homeostasis.
Materials and Methods
Cell Culture and Cell Lines
Human embryonic kidney 293 (HEK293) cells were cultured as previously described. 10 The PS1 lines were then stably transfected with YC3.6/pcDNA3 construct (kindly provided by Dr. A. Miyawaki), and clones were respectively isolated by G418 antibiotic resistance. 11 The HEK293 APPsw/PS1-M146L line was kindly provided by Dr. H. Steiner and cultured as previously described. 12
Compound Library
DIVERSet 1 and 2 libraries (ChemBridge Corp., San Diego, CA), each containing a diverse collection of 10,000 hand-synthesized small molecules (in total 20,000 compounds), were used for high-throughput compound screening. Compounds fulfilled the “Lipinski’s rule of 5,” indicating their high druglikeness potential. 13
High-Throughput Calcium Imaging Assay
For the primary screen, HEK293 cells stably expressing PS1-M146L and Yellow Cameleon 3.6 (YC3.6) were seeded at 13,000 cells/well in 40 µL of growth medium on collagen-coated 384-well CellCarrier plates (PerkinElmer, Rodgau, Germany). After 6 h, using an automated pipetting robot (Bravo; Agilent Technologies, Santa Clara, CA), library compounds were added to each well at the final concentration of 10 µM in 1% DMSO, each in four replicates. All plates contained Thapsigargin (TP; 1 µM; Calbiochem, Darmstadt, Germany), cyclopiazonic acid (CPA; 20 µM; Calbiochem), and 3,4,5-trimethoxybenzoic acid 8-(diethylamino)octyl ester (TMB-8; 50 µM; Sigma-Aldrich, Taufkirchen, Germany) as positive controls, as well as untreated and DMSO vehicle-treated wells. After 24 h using the pipetting robot, DRAQ5 (Biostatus Ltd, Leicestershire, UK), a far-red fluorescent nuclear dye, was added to each well at the final concentration of 500 nM. After 2 h, plates were measured for carbachol (CCh)–induced calcium release using the Opera high-throughput confocal imaging platform (PerkinElmer Cellular Technologies GmbH, Hamburg, Germany). Throughout imaging of the entire plate, 37 °C temperature, 5% CO2, and 90% humidity were maintained in the plate chamber. Using a 442-nm laser, YC3.6 was excited and its cyan fluorescent protein (CFP) and yellow fluorescent protein (YFP) emissions were separated respectively using 483/35-nm and 540/75-nm filters. In addition, using a 640-nm laser, DRAQ5 dye was excited and its emission was collected by a 690/50-nm filter to locate the nuclei. Imaging was performed with a 20× water immersion autofocus objective. The duration of the entire time-lapse calcium imaging for each well was 23.5 s. This was achieved by imaging at a 2.5-s interval resolution prior to dispensing CCh (for 5 s) to monitor the basal calcium levels. Next, the CCh-induced calcium rise and decay was monitored for 18.5 s after dispensing. Imaging was performed first at a 1-s interval resolution immediately after dispensing (for 5 s) and subsequently at a 2.5-s interval resolution (for 12.5 s). During dispensing, 10 µL CCh (Calbiochem) diluted in Hank’s balanced salt solution (HBSS; 10 µM) was injected into each well concurrent with calcium imaging by an automated dispensing unit, which is part of the Opera platform. Imaging was performed sequentially in all 384 wells.
Data Mining
Data mining, clustering, and identification of the lead structures were performed with the Benchware DataMiner software (Tripos, St. Louis, MO).
Cytotoxcity Assay
The cytotoxicity of the compounds was assessed in vitro using the 3-(4,5-dimethylthiazol-2-yl)-2,5-diphenyltetrazolium bromide (MTT) cell proliferation assay kit (Roche Diagnostics GmbH, Mannheim, Germany) according to the manufacturer’s instructions and previously described protocols. 14
Aβ Measurements
Levels of three different Aβ species (Aβ38, Aβ40, and Aβ42) were measured using sandwich enzyme-linked immunosorbent assay (ELISA). Pools of HEK293 cells stably transfected with APPsw/PS1-M146L were used to study the effect of compounds on Aβ generation. According to Page et al., 12 cells were seeded at a density of 200,000 cells/well in collagen/poly-L-lysine (PLL)–coated 24-well plates and incubated for 24 h in growth medium. Next, the medium was exchanged with 500 µL of fresh medium containing the compounds, the positive control DAPT (10 µM; Calbiochem), or DMSO vehicle. After 16 h, conditioned medium was collected and the levels of secreted Aβ38, Aβ40, and Aβ42 fragments were quantified using the “Human (6E10) Abeta 3-Plex” sandwich ELISA immunoassay kit (Meso Scale Discovery, Rockville, MD) according to the instructions of the manufacturer. The light emission after electrochemical stimulation was measured using the Sector Imager 2400 reader (Meso Scale Discovery). Based on the values generated with calibration standards, corresponding concentrations of Aβ species were calculated using the Meso Scale Discovery Workbench software. All measurements were performed in four replicates.
Statistical Data Analysis
GraphPad Prism 5.0b (GraphPad Software, San Diego, CA) was used for statistical analysis of the data. Values represent mean ± standard deviation. To test significance, a two-tailed Student t test was performed and differences were considered statistically significant if p < 0.05.
Results
FRET-Based Calcium Imaging Using YC3.6
YC3.6, a superior genetically encoded fluorescence resonance energy transfer (FRET)–based calcium indicator with predominant cytosolic localization, expanded dynamic range, and fast kinetics, 11 was introduced to HEK293 cells as a tool to monitor both the basal calcium concentrations and the released calcium from ER in real time by confocal imaging. YC3.6 is composed of CFP and YFP domains, linked via calmodulin (CaM) and a CaM-binding peptide (M13). Upon calcium binding, it undergoes a conformational change and thereby FRET efficiency increases ( Fig. 1A ). 11
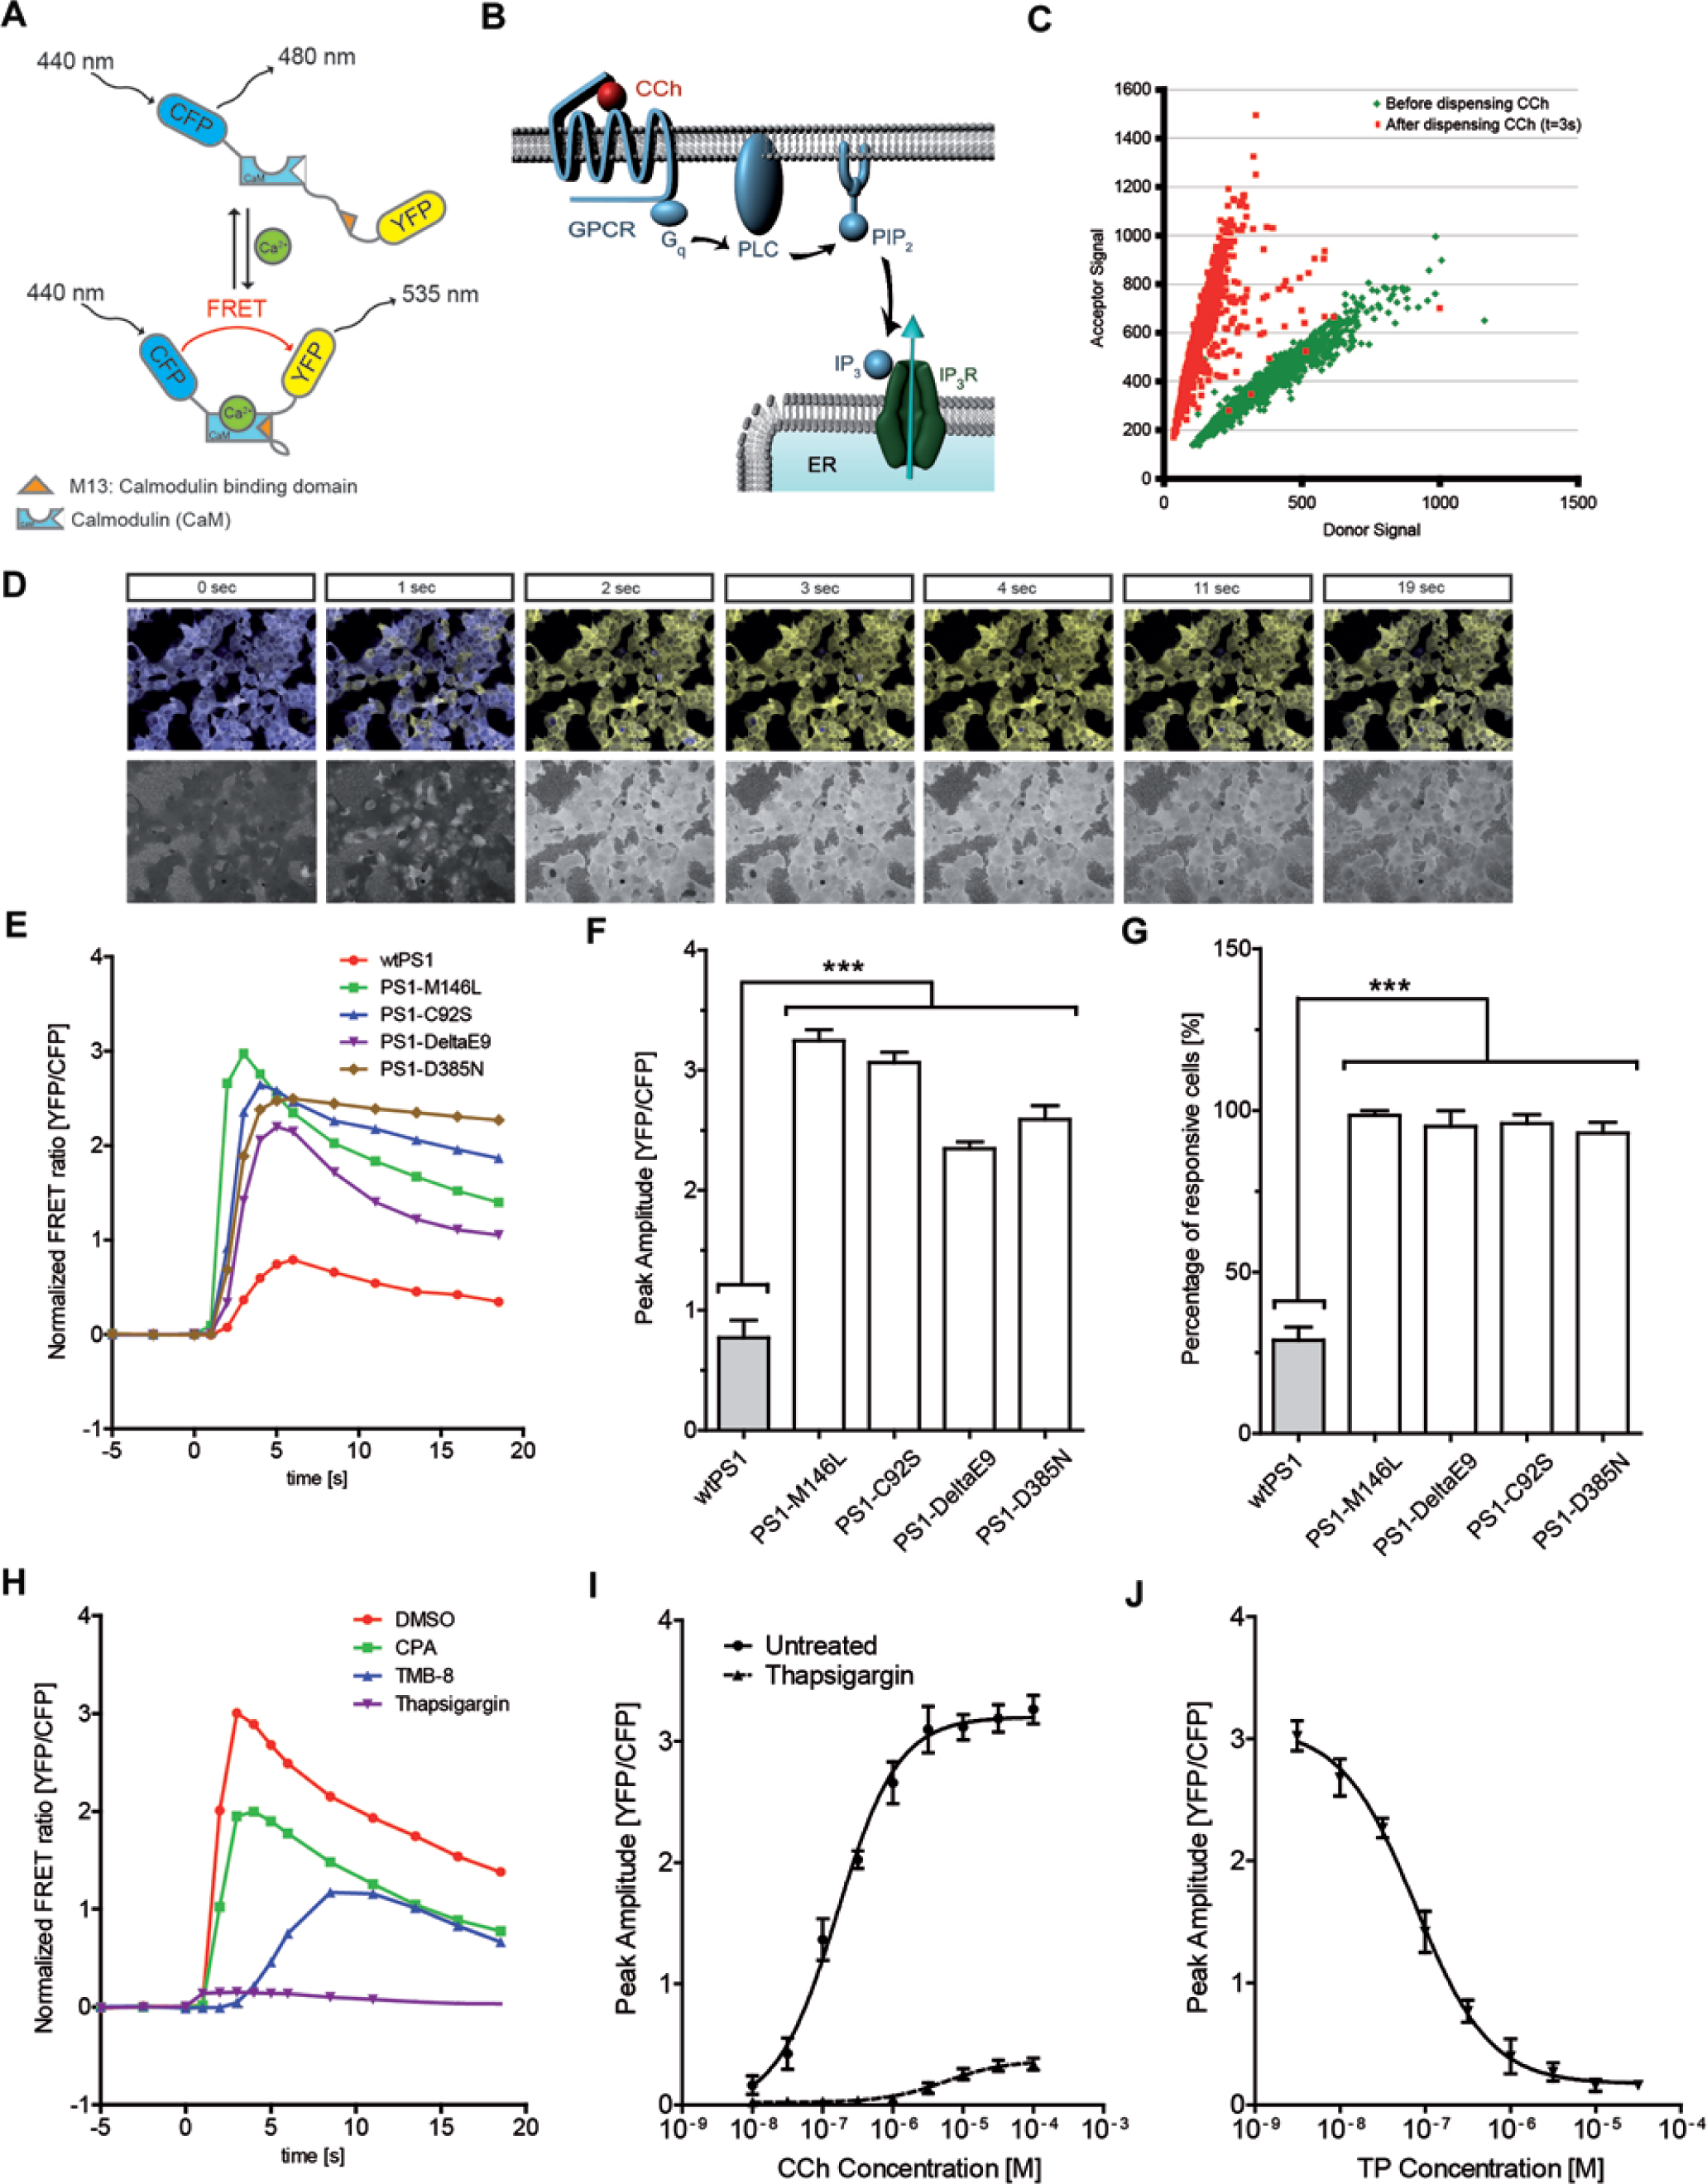
Fluorescence resonance energy transfer (FRET)–based calcium imaging with Yellow Cameleon 3.6 (YC3.6). (
The assay readout was the peak response of inositol-1,4,5-trisphosphate receptor (IP3R)–evoked calcium release from ER. Agonist-induced IP3 production by CCh results in calcium release from ER ( Fig. 1B ). The release of calcium from ER into the cytosol results in rise of calcium concentration that can be monitored by increased FRET efficiency.
Time-lapse calcium imaging indicates that within a few seconds after dispensing CCh, FRET efficiency rapidly increases—that is, the CFP (FRET donor) signal decreases, while the YFP signal (FRET acceptor) increments ( Fig. 1C , D , upper panel).
In Figure 1C , the acceptor-donor signals of all cells in a single well are shown for two time points. One set of points are single-cell signals before dispensing, and the other set of points are the signals 3 s after dispensing. The slope of the distribution corresponds to the FRET signal, which is calculated as the ratio of the YFP to CFP signal. The change in FRET efficiency after stimulating with CCh is clearly visible in the change of distribution slope ( Fig. 1C ). In accordance, the FRET ratio (YFP/CFP) can be used as a tool to monitor calcium dynamics ( Fig. 1D , lower panel). Following the rise in calcium concentration, the peak of calcium release is reached. After the peak, the FRET ratio begins to decay as a result of calcium buffering and sequestration ( Fig. 1D ).
FAD-PS1 Mutations Enhance the Amplitude of CCh-Induced Calcium Release and the Number of CCh-Responsive Cells
Mutations in presenilins (PS1 and PS2) account for the vast majority of early onset familial Alzheimer disease (FAD) cases. These mutations result in increased IP3R sensitivity. 15 Moreover, function of multiple upstream elements of IP3 receptor-mediated calcium release is also affected in AD—for example, G-protein–coupled receptors (GPCRs) in general 16 and muscarinic receptors in particular, 17 G-proteins, 18 and phospholipase C (PLC). 19 Presumably, the combination of those results in a remarkably greater IP3R-mediated calcium release in FAD-PS1 cells. Since the screening hits may potentially target any of those upstream elements, such a phenotypic multitargeted drug screening paradigm allows collectively addressing several aspects of AD.
Indeed, using the developed FRET-based calcium imaging assay, we could confirm the exaggerated CCh-evoked ER calcium release signals in cells expressing different mutant forms of PS1 (
Fig. 1E
). The peak response of CCh-evoked calcium release and the number of CCh-responsive cells were remarkably higher in FAD-PS1 lines (PS1-M146L, PS1-C92S, PS1-DeltaE9) compared with the wild-type PS1 line (
Fig. 1F
,
G
). Likewise, the expression of a γ-secretase–deficient mutant form of PS1 (PS1-D385N) results in increased responsiveness to CCh and augmented calcium release from ER upon CCh stimulation (
Fig. 1F
,
G
). To assess the single-cell resolution of the assay, the traces for individual cells showing the raw and normalized FRET ratio changes (CCh-evoked calcium responses) are plotted for cells expressing either wild-type or mutant forms of PS1 (
Therefore, the augmented CCh-evoked calcium release in FAD-PS1–expressing cells was used as a robust phenotypic readout in a high-throughput screening (HTS) approach, which aimed at identification of drugs that can reverse the exaggerated calcium release to physiological levels (
Assay Development
We addressed intracellular store calcium dyshomeostasis as an innovative target for drug discovery with a novel FRET single-cell–based calcium imaging technique in a fully automated high-throughput kinetic assay on the Opera system (PerkinElmer) for compound screening.
The assay readout was the potentiated IP3R-evoked calcium response in HEK293 cells expressing a FAD-linked mutation, PS1-M146L. Indeed, treatment with three different positive controls (TP, CPA, and TMB-8) resulted in decreased CCh-evoked calcium release from the ER ( Fig. 1H ).
The dose-dependent effect of CCh in increasing the peak amplitude of calcium response was evaluated across a range of different CCh concentrations in PS1-M146L cells ( Fig. 1I ). Indeed, pretreatment with TP lowered the peak amplitude of the ER calcium response in all CCh concentrations tested ( Fig. 1I ). Moreover, the dose-dependent effect of TP in lowering the peak amplitude of CCh-induced calcium release was investigated (CCh: 10 µM) ( Fig. 1J ).
Image Analysis
The image analysis software Acapella (PerkinElmer) was used to convert the time-lapse images into numerical values. Acapella is a scripting-based solution for implementing different requirements on the image analysis side. The image analysis consisted of four steps: segmenting the image into the individual cells, determining the time-dependent signals for each identified cell, processing the signals of each cell, and then classifying cells and reporting relevant results ( Fig. 2A ).
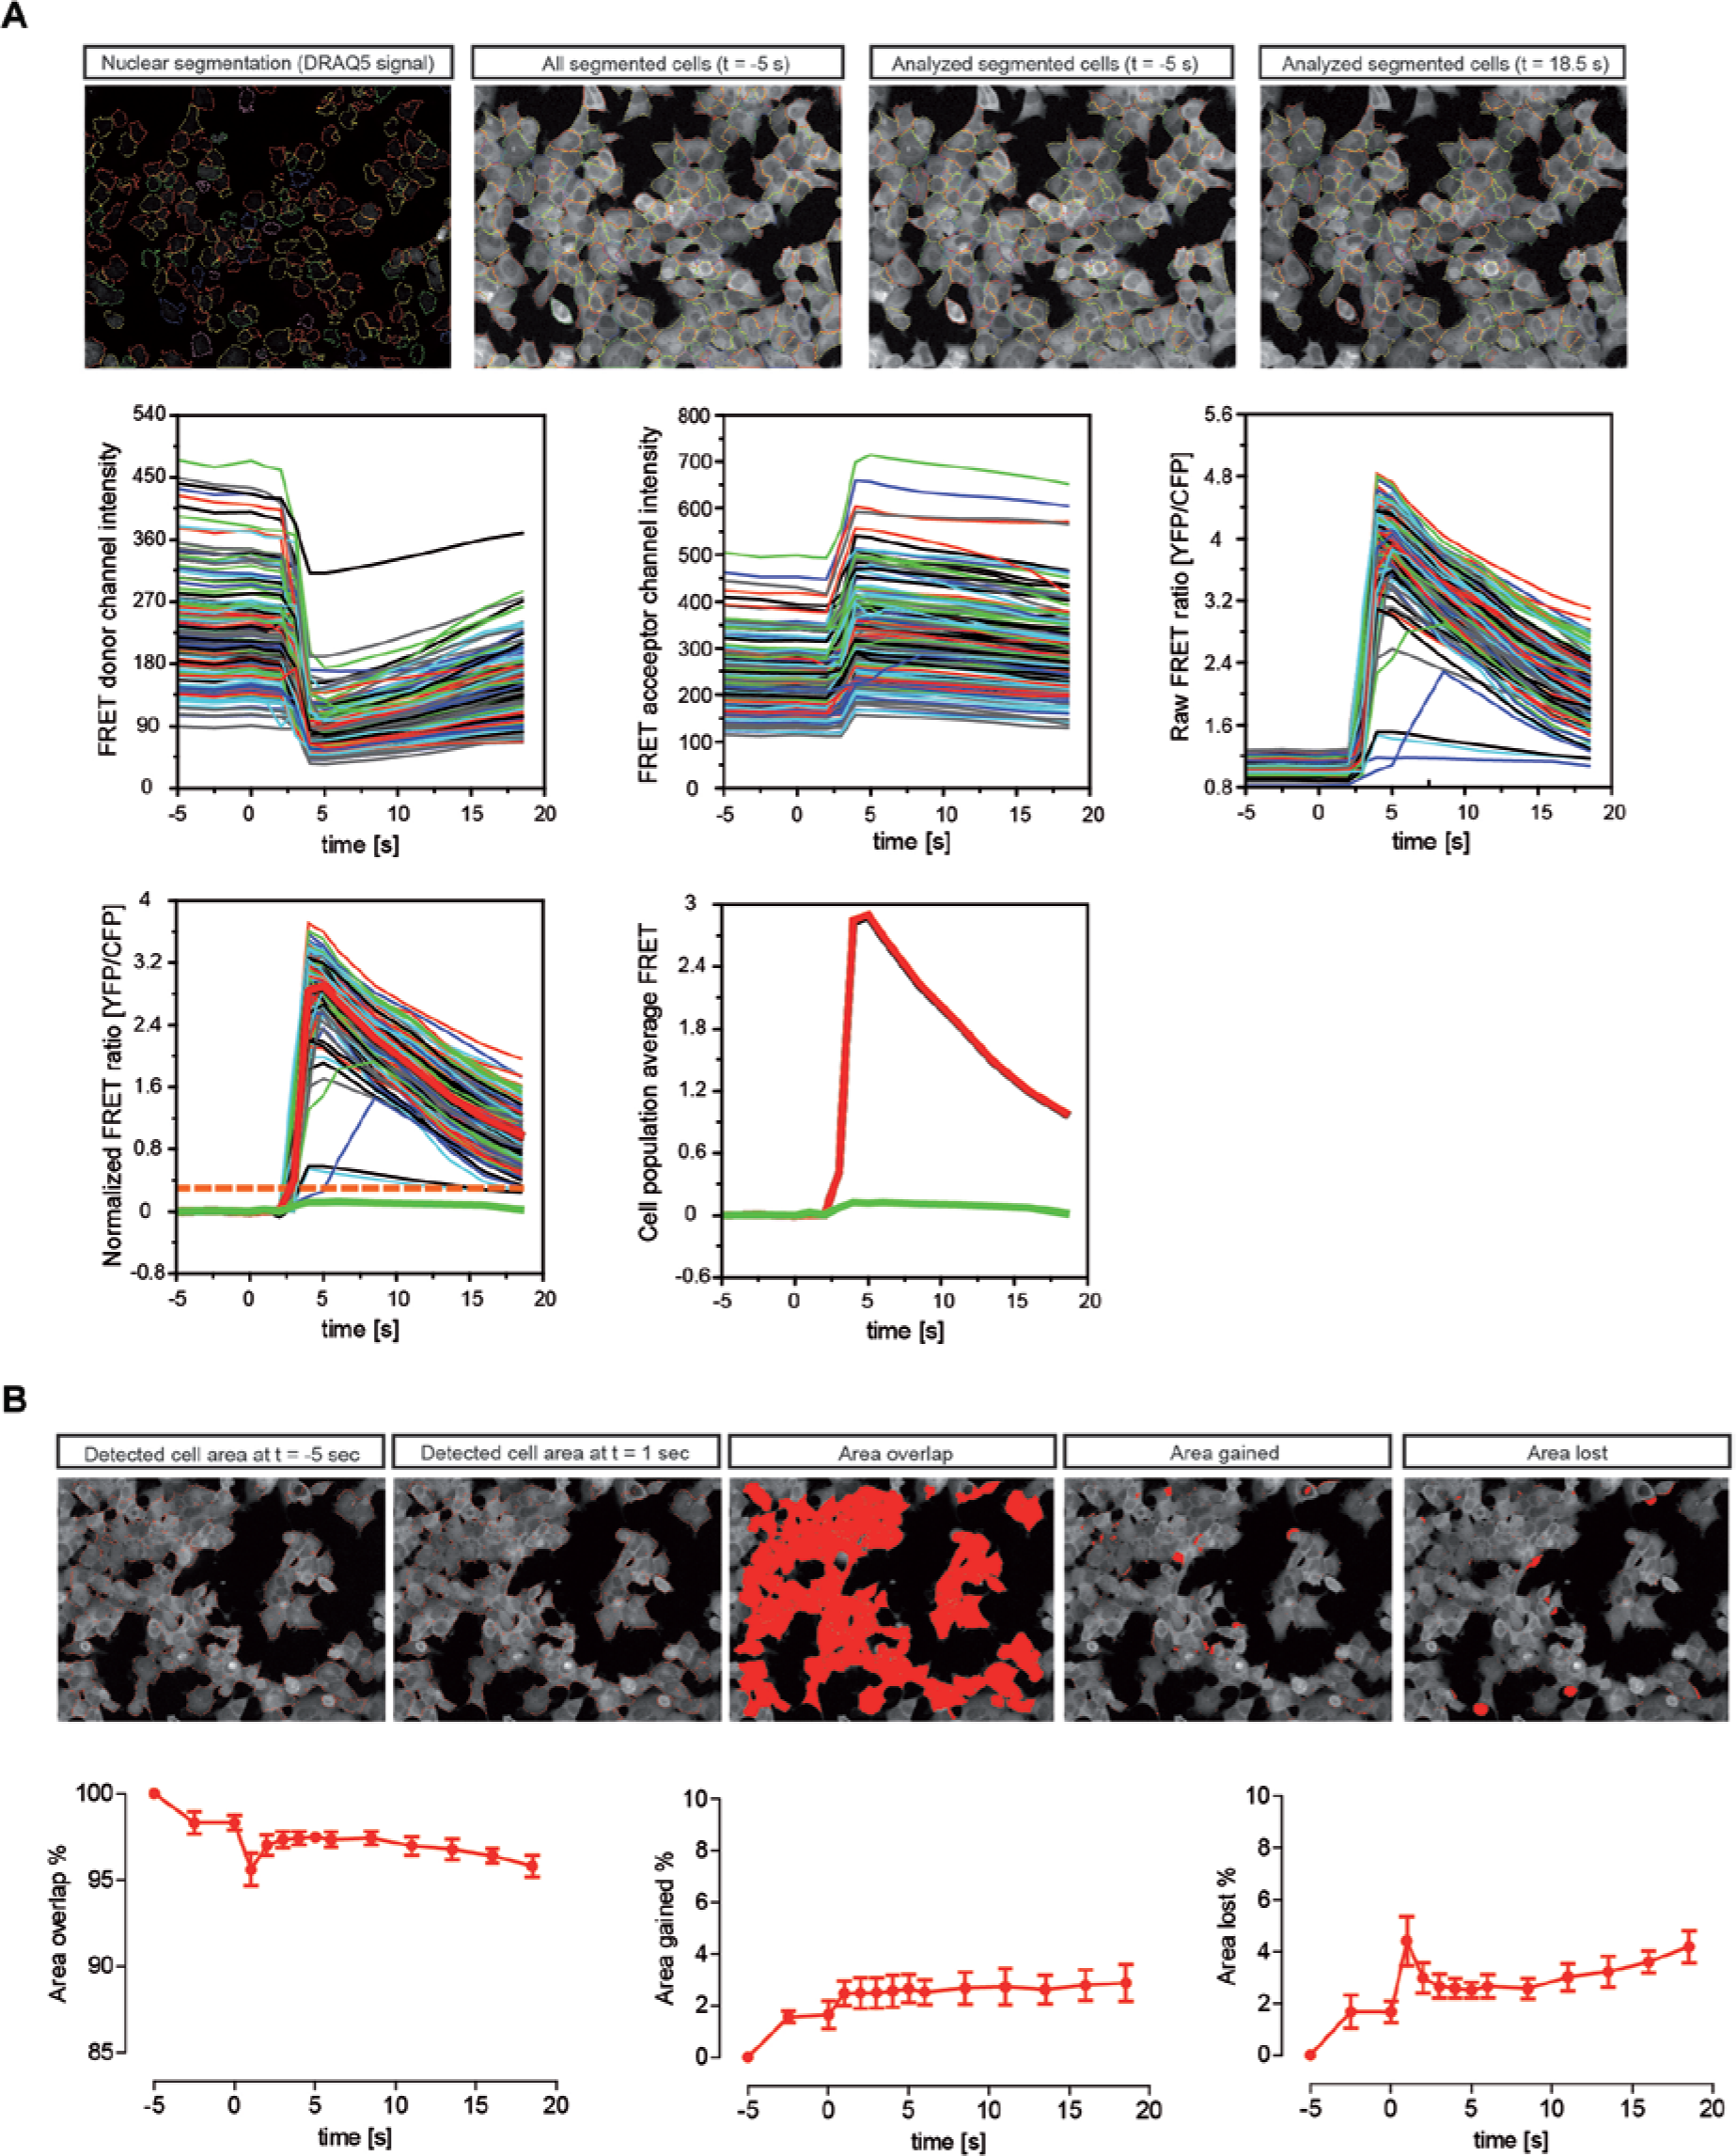
Image analysis workflow and detected cell area change over the course of time-lapse imaging. (
Image segmentation
For the segmentation, the nuclei and CFP images of the first time point were used. The segmentation of the nuclei image was done with the nuclei_detection_B() algorithm of the Acapella, which involves automatic threshold calculations and some masking steps to split nuclei in close proximities along lines of darker pixels. For each detected nucleus (based on DRAQ5 signal), the CFP signal for that time point was also determined. The nuclei with a signal below a certain threshold were excluded from image analysis. In addition, the CFP signal after dispensing CCh was measured to detect and exclude the cells that were washed away in the well due to dispensing.
Starting from the initially segmented nuclei, the cytoplasm_detection_c() algorithm of Acapella was used to determine the location and shape of the cells using the CFP image. Here again, threshold calculations were used by Acapella to define the final cell shape. In addition, we excluded the cells located at the edges of the image (image borders) to minimize the potential of artifacts caused by only partially visible cells.
For the short time series as used in this HTS approach, the motility of the cells can be neglected. We compared the covered areas by the cells when the detection algorithm was applied to the first and a later time point. In
Figure 2B
, the detected cell areas are outlined for time points at t = −5 s and at t = 1 s (times are relative to the dispensing time). Also shown are the “overlap area” between the two time points, as well as the area that is only detected at t = −5 s (“lost area”) and at t = 1 s (“gained area”). The size of these areas (normalized to the size at t = −5 s) is presented over the entire course of time-lapse calcium imaging for PS1-M146L cells (
Fig. 2B
). Similarly, the changes in the overlap, gained, and the lost areas for DMSO- or positive control-treated cells are shown (
Measuring signals
As presented in
Figure 1D
(and
Processing the cell signals
For each cell, the average FRET ratio before dispensing was determined as an individual offset value. From the measured FRET signals, this offset was subtracted, so that we obtain the FRET signal changes relative to the predispensing condition. In addition, also the shape of the FRET signal change over time can be evaluated. In particular, both the amplitude of the “maximum” FRET efficiency, as well as the “time” at which this maximum response is reached, can be analyzed.
For example, in the wild-type PS1 cells, after approximately a 6-s delay from dispensing CCh, the peak of FRET response was reached. However, in FAD-PS1 cells, the FRET peak response delay was shorter (depending on the mutation, peak of FRET response was reached within 1–4 s after dispensing CCh) ( Fig. 1E ). In other words, FAD-PS1 mutations enhance the calcium release from the ER, while also shortening the latency of calcium release after dispensing CCh. On the other hand, positive controls CPA and TMB-8 further extended this latency in PS1-M146L cells ( Fig. 1H ).
Classification of cells
For every cell, the maximum increase of the FRET signal and the time point at which this maximum is reached are determined. The cells are classified into responsive and nonresponsive cells based on an arbitrarily defined threshold value and whether the peak FRET value lies below or above that threshold.
High-Throughput Compound Screening Workflow
As illustrated in
The performance of the high-throughput compound screening assay remained very robust throughout screening of 200 plates (Z′ factor > 0.8). Z′ factors for 10 randomly selected plates are presented in
High-Throughput Compound Screening Assay Enables the Discovery of Novel Lead Structures
After filtering the autofluorescent and highly toxic compounds, the primary screen yielded 52 hits ( Fig. 3 ). A compound was regarded as a hit if the peak response of calcium release in cells treated with that compound was <90% of that in DMSO-treated controls. To each library compound, a score typically <1.0 was assigned indicating a measure for its efficacy, calculated by dividing the peak response of calcium release in cells treated with that given compound to the peak response of DMSO-treated controls on the same plate. Hereafter, we refer to this value as the “normalized ER calcium response score.” In Figure 3 , a list of all hits from the primary screen, including their chemical structures and corresponding normalized ER calcium response scores, is presented.
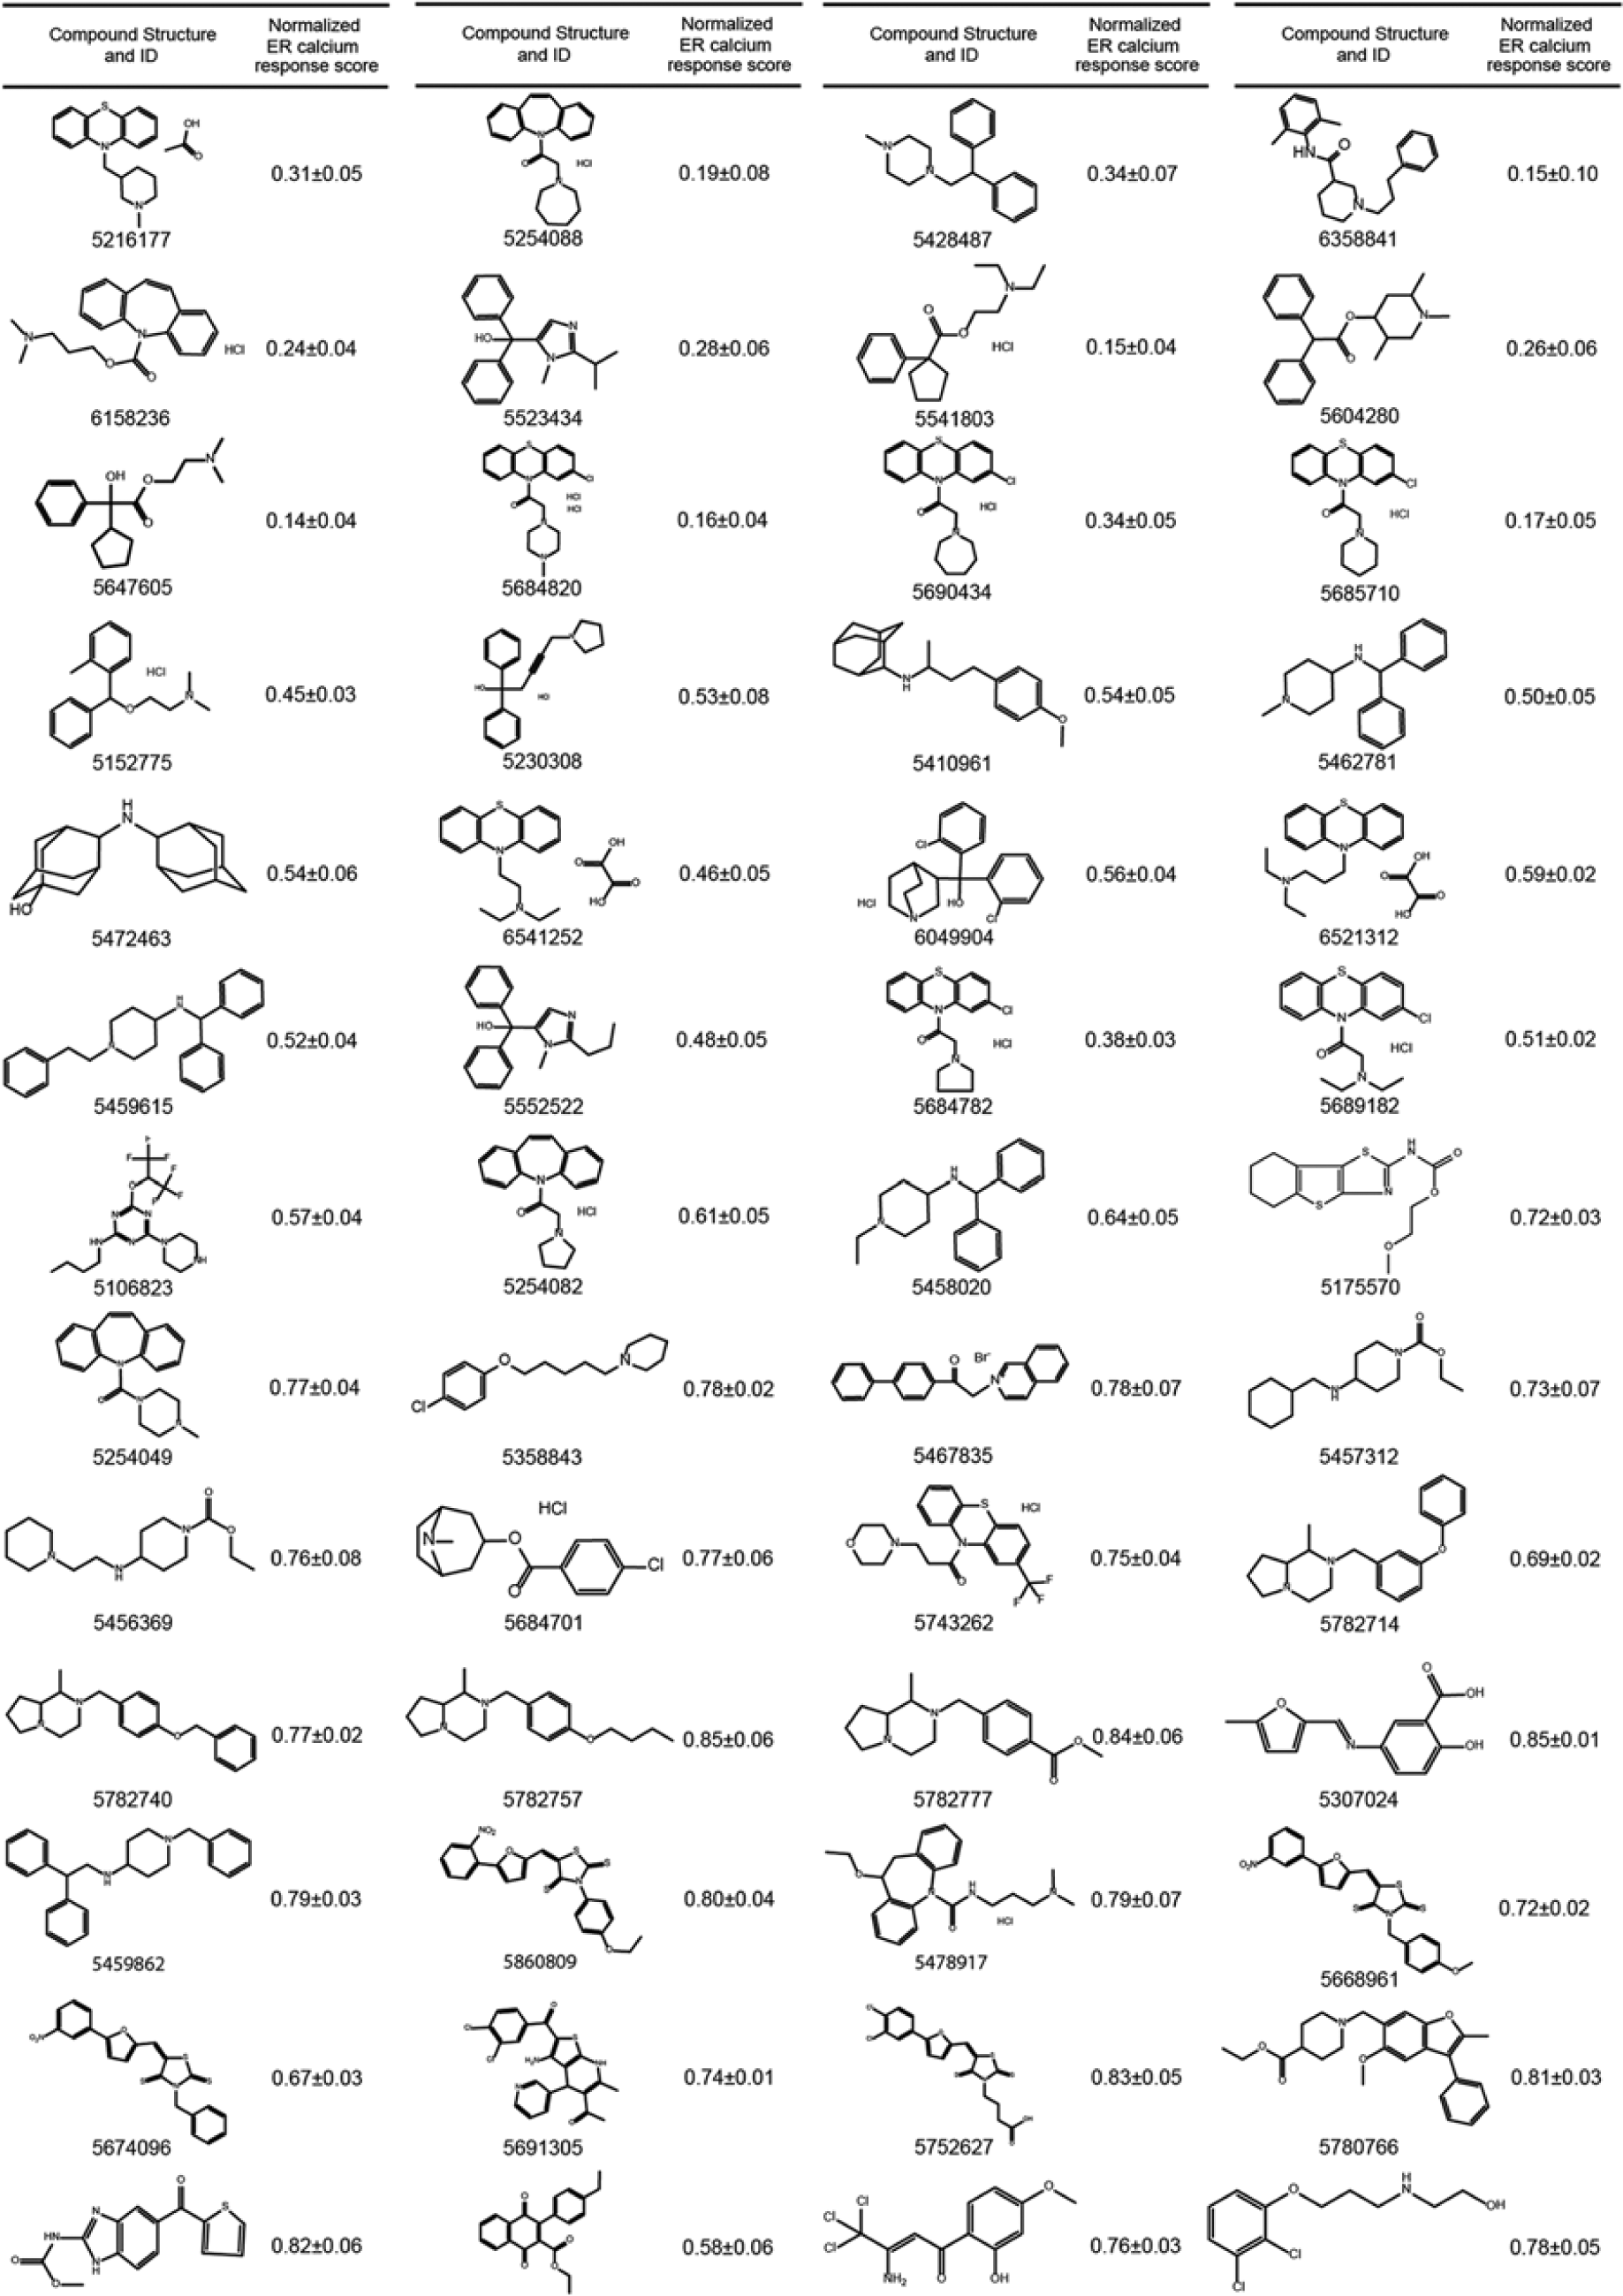
Active structures identified from the primary high-throughput screen. Shown are 52 small molecules identified from the primary screen with their chemical structure and the corresponding normalized mean endoplasmic reticulum (ER) calcium response ± standard deviation values generated at 10 µM as a measure for their activity.
The activity of all primary hits was validated in PS1-M146L cells and confirmed in two other FAD-PS1 lines (PS1-C92S and PS1-DeltaE9) (
Fig. 4A
and
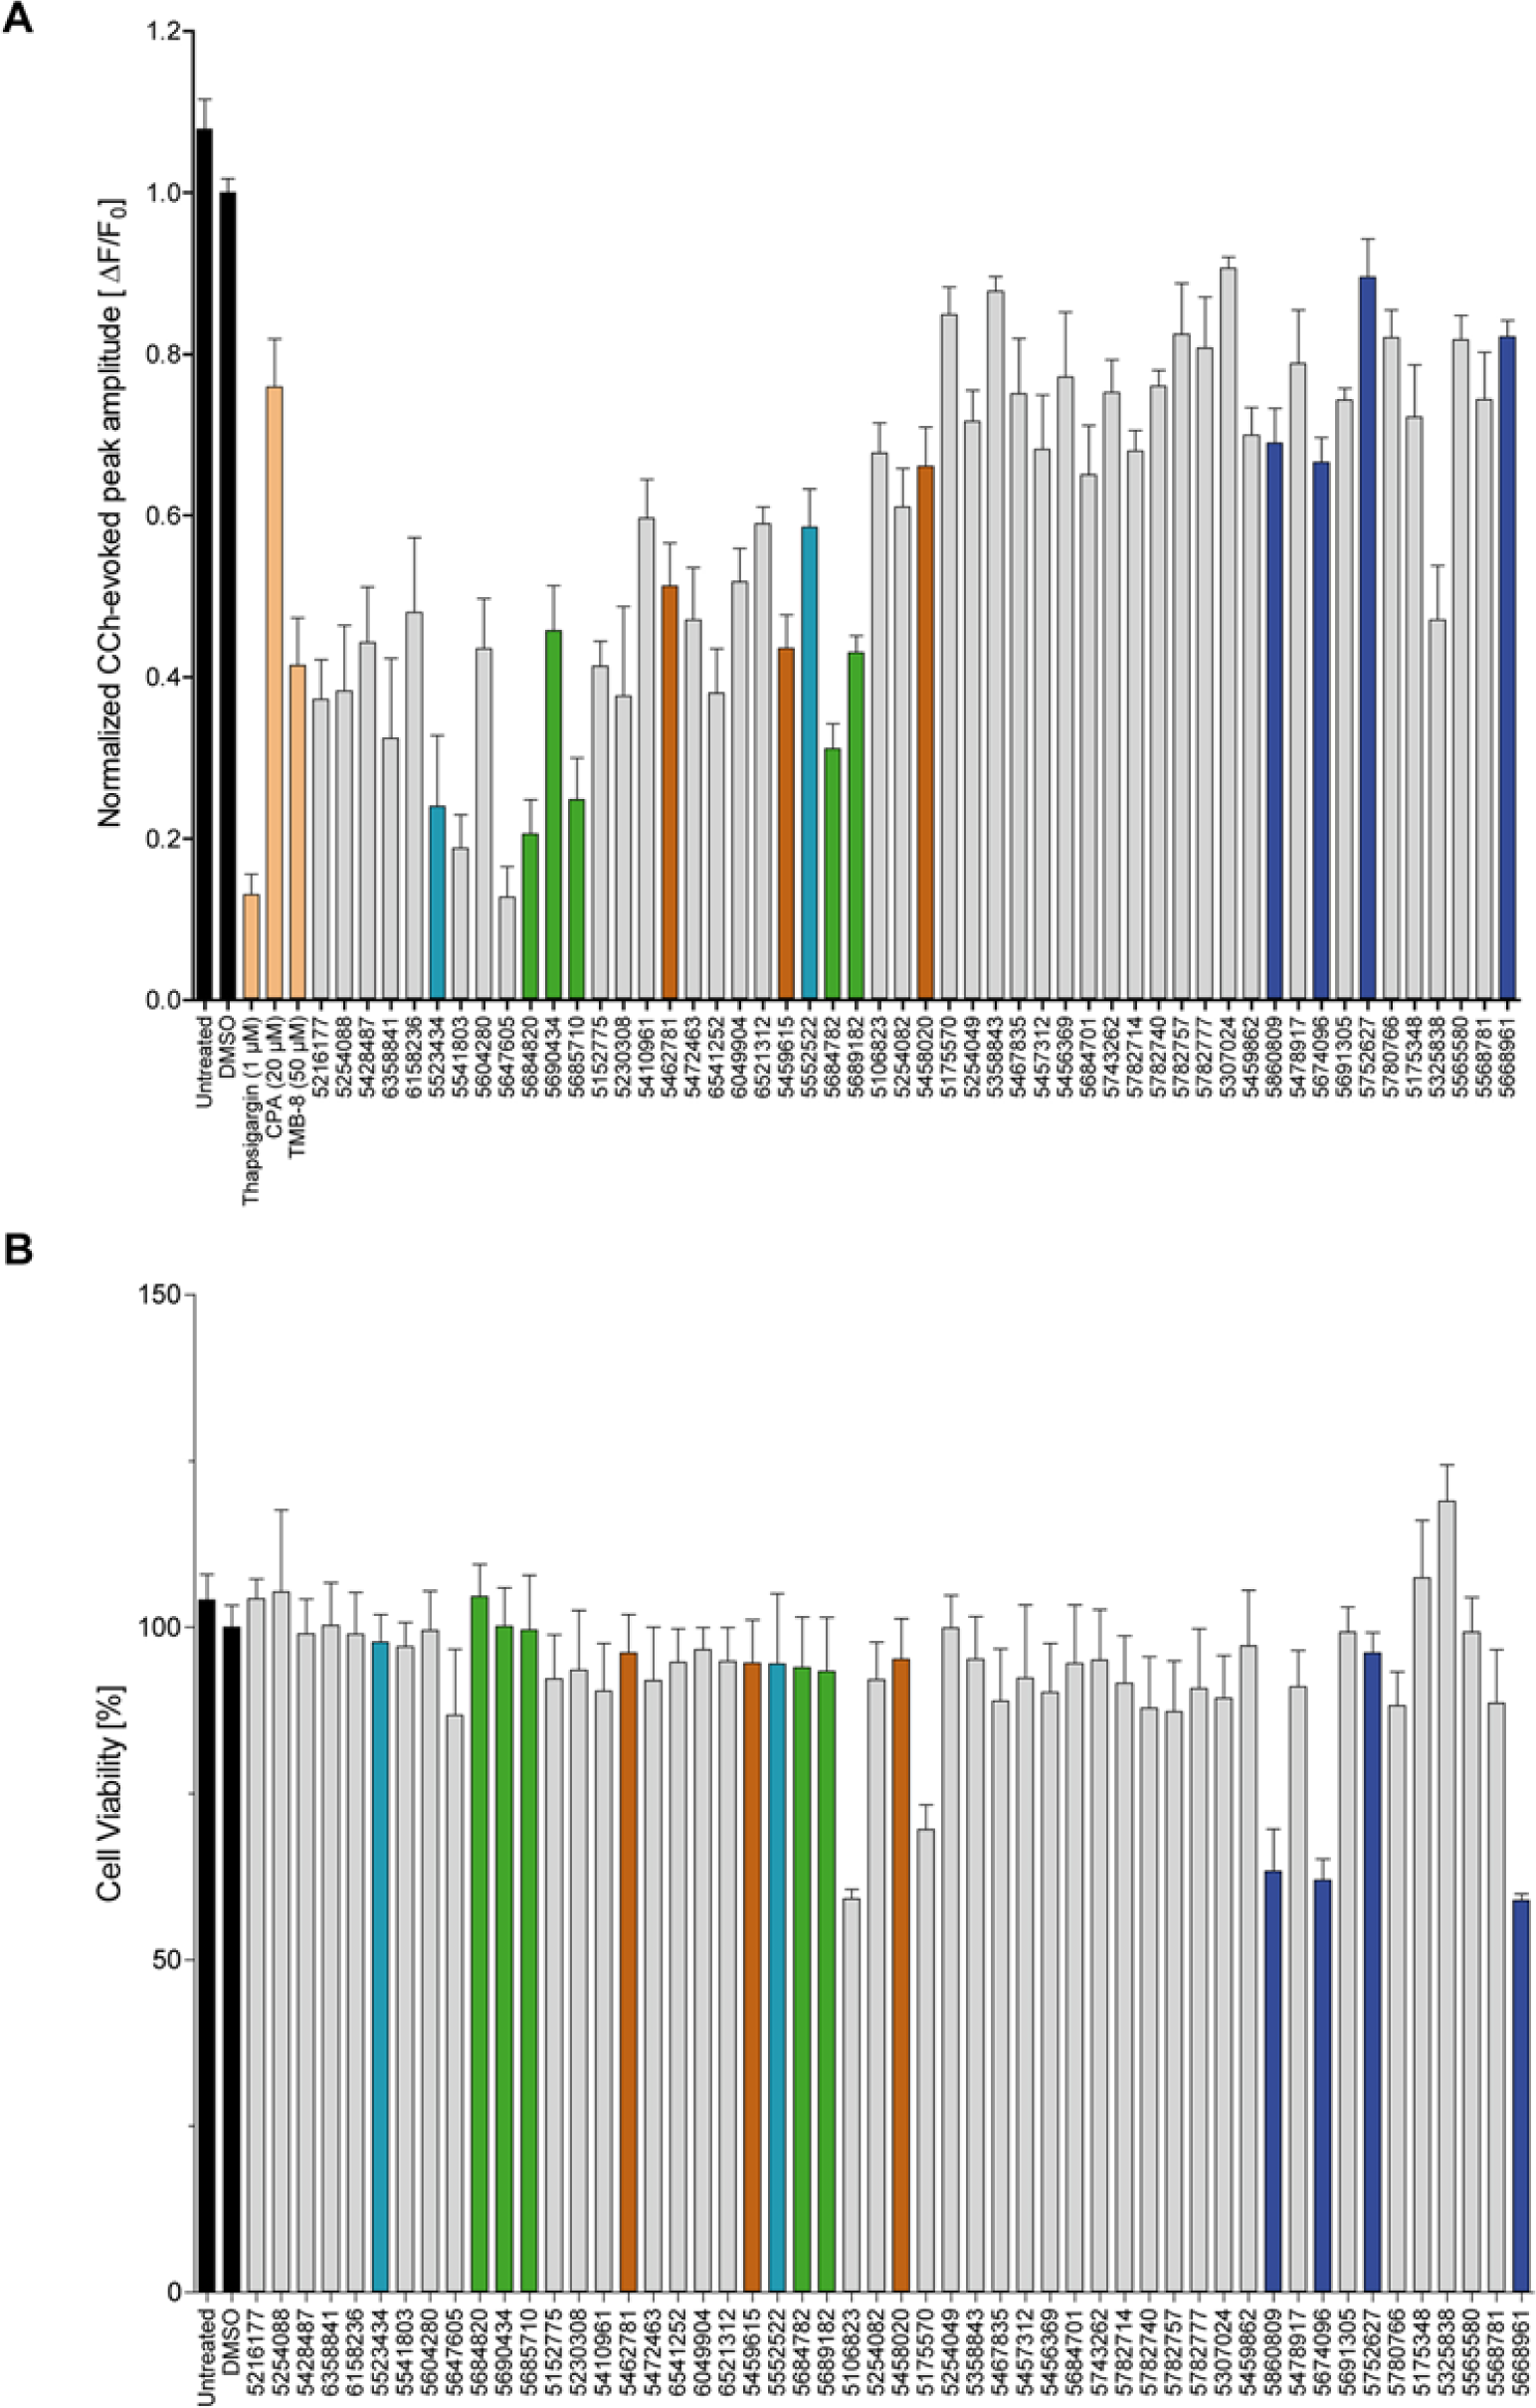
Validation of primary hits and their in vitro cytotoxicity. (
Preliminary structure-activity relationship (SAR) assessments led to the identification of four lead structures. Those structures belonged to the following classes of compounds: thiazolidine, phenothiazine, imidazole, and benzhydrilpiperidinamine (
In the MTT assay, most hits showed no toxicity. HEK293 cells treated with the hits at 10 µM for 24 h remained viable ( Fig. 4B ). Treatment with only five compounds, three of which belonged to the thiazolidine lead structure, resulted in a 30% to 40% reduction in cellular viability.
Effect of Hits on Aβ Generation
Modulation of calcium homeostasis affects the production to amyloid β (Aβ) peptide, the major constituent of the amyloid plaques in the AD brain. 6 Furthermore, we also tested the effects of primary screen hits on Aβ peptide production. Depending on the compound tested, we detected increased, decreased, or unchanged Aβ levels upon 16-h exposure of HEK293 APPsw/PS1-M146L cells with the compounds ( Fig. 5 ).
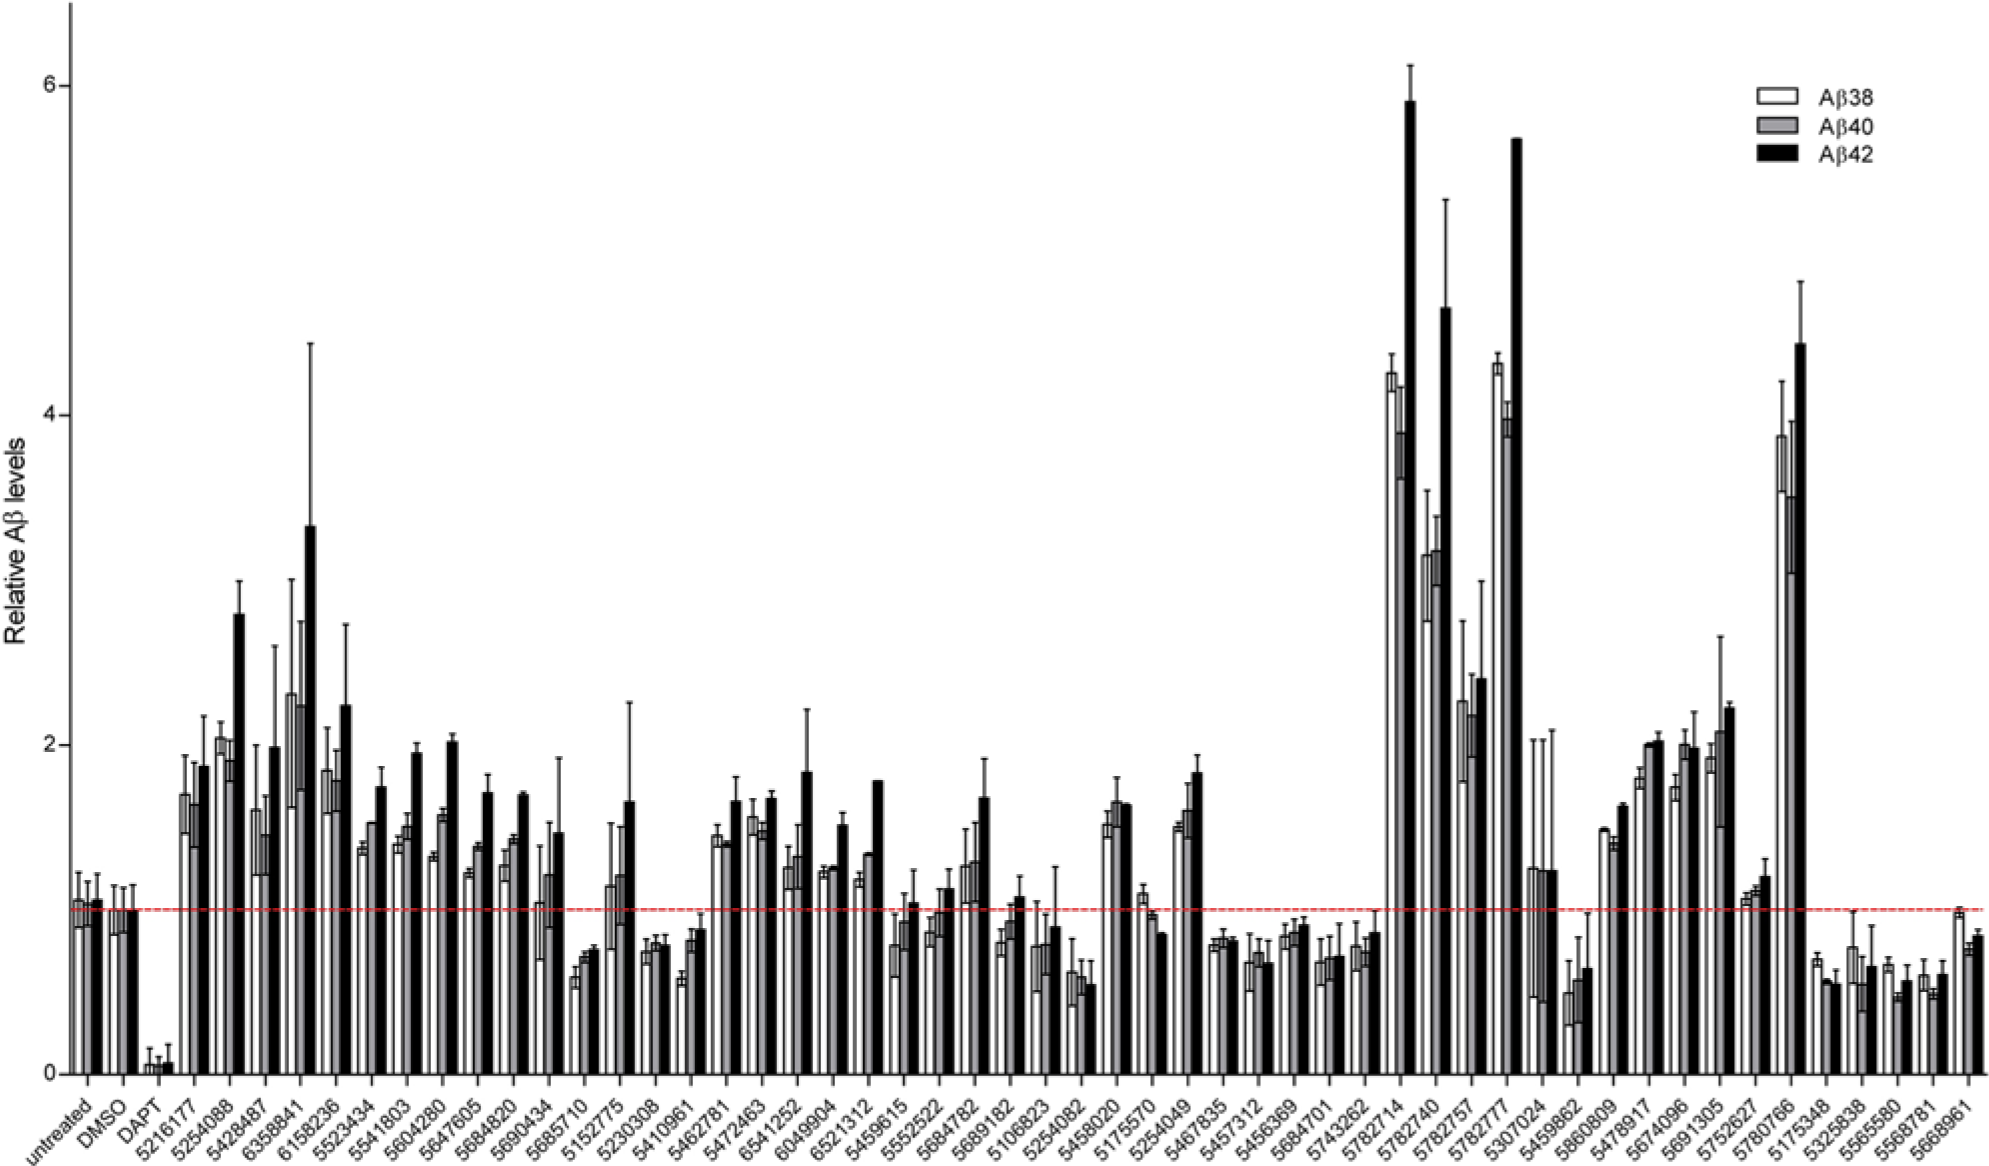
Effects of the active compounds from the calcium high-throughput screening (HTS) on Aβ production. Altered production of Aβ38, Aβ40, and Aβ42 after a 16-h treatment of HEK293 cells coexpressing APPsw and PS1-M146L with the active structures identified from the calcium HTS. DAPT (10 µM) was used as a γ-secretase inhibitor control.
Discussion
Here we describe the development and implementation of a high-throughput compound screening assay targeting ER calcium dysregulation as an innovative approach for AD drug discovery. As opposed to the majority of AD drug discovery strategies that target late-stage disease hallmarks, this approach targets a cellular event that is proposed to occur early in the pathophysiology of AD. 2
Various mechanisms have been proposed to underlie the FAD-PS1–mediated enhancement of the ER calcium release—for example, enhanced IP3 and ryanodine receptor (RyR) channel activities,15,21 altered sarcoendoplasmic reticulum calcium ATPase (SERCA) pump function, 22 decreased store-operated calcium entry (SOCE), 23 and loss of PS holoprotein passive calcium leakage. 20 Irrespective as to which of those are the primary causative and which the secondary phenomena, we performed a phenotypic compound screen and identified small molecules that reverse the exaggerated calcium release from ER in cells expressing a FAD-PS1 mutation.
The HTS assay developed offers several advantages compared with current calcium measurement screening technologies. First, the use of genetically encoded calcium sensors as opposed to conventional synthetic calcium-sensitive dyes allows monitoring intracellular calcium dynamics without the drawbacks caused by dye toxicity, loading, washing, and leakage. Second, the developed HTS assay allows performing rapid automated dispensing of reagent jets to individual wells during calcium measurements with no time lag between dispensing and imaging. The latter is ideal for kinetic measurements that require rapid imaging with no delay after dispensing (e.g., fast agonist-induced calcium release). Third and most important, as opposed to single-well–based calcium measurement systems, the single-cell–based nature of this assay in combination with automated image analysis enables simultaneous monitoring of calcium transients in individual cells of a well and applying multiple filtering parameters in image analysis to set apart different cell subpopulations. Furthermore, the assay offers a competitive robustness reflected by a Z′ factor >0.8. An obvious limitation of this assay is, however, the difficulty of calibrating the FRET signals to actual calcium concentrations. Yet for HTS purposes, with a suitable signal window, it is often not necessary to measure the absolute calcium concentrations.
Calcium alterations associated with FAD-PS expression provide ideal means to investigate the disruption of ER calcium homeostasis. FAD-PS–dependent calcium alterations in intracellular calcium stores have been linked to synaptic dysfunction, which is the underlying basis for cognitive impairment in AD. 24 Screening of 20,000 small molecules using the HTS assay yielded the discovery of 52 primary hits, from which 4 lead structures were identified that belonged to the classes of compounds: thiazolidine, phenothiazine, imidazole, and benzhydrilpiperidinamine. Notably, existing evidence supports the beneficial effects of phenothiazine and thiazolidine derivatives for treatment of AD.25–27 Such indications validate the relevance of this phenotypic screening strategy as well as the lead structures identified from it.
Alterations in intracellular calcium homeostasis can directly affect Aβ production. 6 Indeed, many of the active compounds identified from the primary calcium screen either increased or decreased the production of Aβ peptides. Such a broad range of effects on Aβ generation is most likely caused by targeting different components of intracellular calcium homeostasis by different hits. Indeed, calcium ions have been shown to directly regulate the activity of secretases.28,29
As it is typical for phenotypic drug screening approaches, the molecular targets of these hits are yet to be determined. However, we speculate that, some of the hits may dampen the hyperactivated calcium channels located on the ER,15,21 modulate the PS holoprotein passive calcium leak channel activity, 20 or target the upstream elements involved in IP3R-evoked calcium release,15–17,19 thereby normalizing the disturbed ER calcium homeostasis.
Footnotes
Acknowledgements
We are grateful to Dr. A. Giese for the compound library; Dr. Miyawaki for the YC3.6 construct; Dr. T. Hirschberger for help in data mining and SAR studies; P. Schmitz and F. Wachter for data management; T. Kares, J. Knörndel, O. Stelmakh, and E. Grießinger for excellent technical assistance; M. Taverna, Drs. S. Lichtenthaler, S. Lammich, H. Steiner, and C. Haass for kindly providing the stable PS1 and APP lines and support in the Aβ measurements.
Declaration of Conflicting Interests
The authors declared no potential conflicts of interest with respect to the research, authorship, and/or publication of this article.
Funding
The authors disclosed receipt of the following financial support for the research, authorship, and/or publication of this article: This work was supported by the German-Polish grant from the German Federal Ministry for Education and Research to J. H. (BMBF-01GZ0713) and a Polish Ministerial grant to J. K. (1900/B/P01/2010/39).
References
Supplementary Material
Please find the following supplemental material available below.
For Open Access articles published under a Creative Commons License, all supplemental material carries the same license as the article it is associated with.
For non-Open Access articles published, all supplemental material carries a non-exclusive license, and permission requests for re-use of supplemental material or any part of supplemental material shall be sent directly to the copyright owner as specified in the copyright notice associated with the article.