
Abstract
Over the past decade, the zebrafish has become a key model organism in genetic screenings and drug discovery. A number of genes have been identified to affect the development of the shape and functioning of the heart, leading to zebrafish mutants with heart defects. The development of semiautomated microscopy systems has allowed for the investigation of drugs that reverse a disease phenotype on a larger scale. However, there is a lack of automated feature detection, and commercially available computer-aided microscopes are expensive. Screening of the zebrafish heart for drug discovery typically includes the identification of heart parameters, such as the frequency or fractional shortening. Until now, screening processes have been characterized by manual handling of the larvae and manual microscopy. Here, an intelligent robotic microscope is presented, which automatically identifies the orientation of a zebrafish in a micro well. A predefined region of interest, such as the heart, is detected automatically, and a video with higher magnification is recorded. Screening of a 96-well plate takes 35 to 55 min, depending on the length of the videos. Of the zebrafish hearts, 75% are recorded accurately without any user interaction. A description of the system, including the graphical user interface, is given.
Over the past decade, the zebrafish (Brachydanio rerio) has become a key model organism in drug discovery as well as in developmental biology.1–4 One of their main advantages, their transparency during the larvae stage, allows for in vivo observation of processes within the organism. Development of all major organs progresses rapidly, and hatching takes place 48 to 72 h after fertilization. In addition, the zebrafish shares a high genetic similarity with humans. 4 Furthermore, zebrafish can be raised easily and kept alive in standard 96-well plates for several days. Drug discovery demands screening of large libraries of compounds to find hits showing an effective reversal of a disease phenotype in a model organism.1,5 When using zebrafish, only small amounts of the drug compound (typically micrograms) are required for screening per assay. In comparison with mammals, costs are reduced significantly. High-throughput screening (HTS) is the prerequisite for conducting thousands of assays per day.1,6 This has motivated the development of several robotic microscope platforms, mainly designed for high-content screening (HCS).7–10 Although significant advances have been made in developing robotic microscopes for both HTS and HCS, there is a lack of economical systems combining automatic feature detection and subsequent imaging of regions of interest (ROIs). In the first phase of drug discovery for the treatment of heart diseases such as cardiomyopathy or arrhythmia, evaluation of the heart function is more important than microscopy of cellular structures.1,11
Until now, different optical methods have been described to analyze the heartbeat of zebrafish hearts in a partly automated manner. In general, the zebrafish have to be positioned manually in agarose gel dishes. In the work of Fink et al., 12 manual placement of markers to define the positions of the endocardium on the image is required, and the image data are also recorded manually. Transgenic zebrafish (cmcl2::mermaid), in which the propagation of electric excitation of the heart is visualized using fluorescent molecules, was used by Tsutsui et al. 13 One commercially available system (ZebraLab, ViewPoint Life Sciences, Inc.) allows for the semiautomatic determination of cardiac frequency and blood flow rate. The ROI (zone where the heart is moving) has to be selected manually from a larger field of view (FOV) and is limited to fixed scan-field settings, resulting in the potential exclusion of important features of interest. Consequently, the zebrafish has to be oriented accurately, and any deviation of the position leads to a divergence from the intended ROI.
A computer-assisted microscopy system based on a semiautomatic microscope (Olympus ScanR) for high-content screening of zebrafish and subsequent identification and imaging of ROIs was presented by Peravali et al. 7 They developed a method for the automatic detection and recording of fluorescent neurons in the brain region. However, videos of moving objects, such as a fish heart, at frame rates >5 images/s cannot be recorded and the zebrafish had to be fixed in position in agarose molds. Moreover, commercially available microscope systems for HTS usually are rather expensive. Hence, a solution for HTS is needed, by means of which automated detection and recording of an ROI within an FOV at a frame rate >5 images/s. To this end, we developed an intelligent robotic microscope that allows automatic (and manual) ROI detection from images and automatic recording of video sequences of zebrafish hearts at the age of 48 to 96 h postfertilization (hpf) in standard 96-well plates. A general concept for controlling, automatic focusing, and a new method for heart detection are described. A description of the system, including the graphical user interface that provides easy access to all features of the microscope, is given below.
Methods
Materials
Adult wild-type zebrafish and the zebrafish heart failure mutant main squeeze (msq) 14 were maintained according to Bendig et al. 15 Eggs were collected from pairwise and batch crossings. Embryos were anesthetized with Tricain solution (4.2 mL to 100 mL of tank water) and arrayed in standard 96-well flat-bottom plates. Tricain solution was prepared by adding 400 mg of tricaine powder to 97.9 mL of distilled water and by adding ~0.26 g Tris (pH 9) in 2.1 mL E3 to adjust the pH to 7.
Robot
A three-axle robot actuated by linear drives, which had been applied in an automatic fish sorting robot, 16 was modified to move the cameras synchronously. The X and Y drives allow well-to-well movements at a maximum speed of 140 mm/s with a position accuracy rated at <0.09 mm. Unlike commercial automated microscope systems, the camera is moved instead of the microplate to reduce changes in embryo position. The robot position is controlled by LabView software.
Image Acquisition
The image acquisition system consists of two digital cameras with a GigE interface and CMOS sensor (uEye UI-5240SE-C by IDS-Imaging, Germany), the lenses, an optical collimator, and illumination. One camera (overview camera [OC]) with a lens (0.82× magnification, 3.44 µm resolution) provides a general view of a single well including the zebrafish. The FOV of the second camera (detail camera) is smaller by using lenses with 4× magnification and 1.94 µm resolution, enabling a more detailed view of the fish heart ( Fig. 1 ).
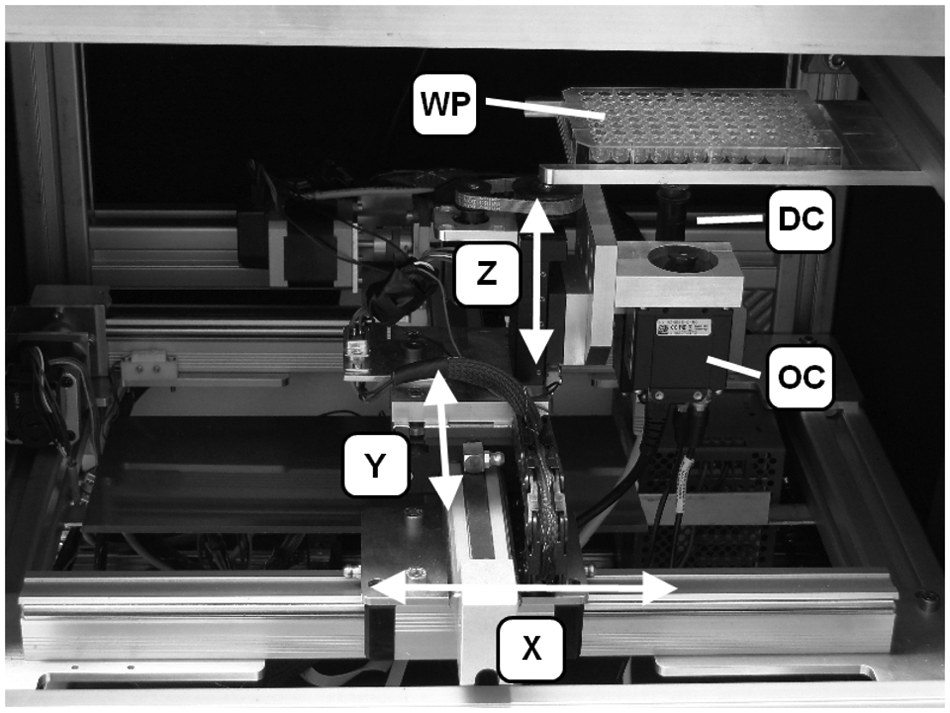
Components of the robotic microscope: X, Y, Z are axes of the linear drives. OC = overview camera, DC = detailed view camera, WP = well plate.
The resolution of the overview images is 1280 × 1024 pixels, and the images are transmitted to a computer and processed with the LabView software. Resolution of the sequence of images of the heart was reduced to 800 × 640 pixels to reach an image rate of >30 fps. A time stamp is inserted in the file name of every individual image of the video sequence that allows for an accurate determination of heart parameters, such as frequency and beat-to-beat interval. The workflow of automated screening is illustrated in Figure 2 .
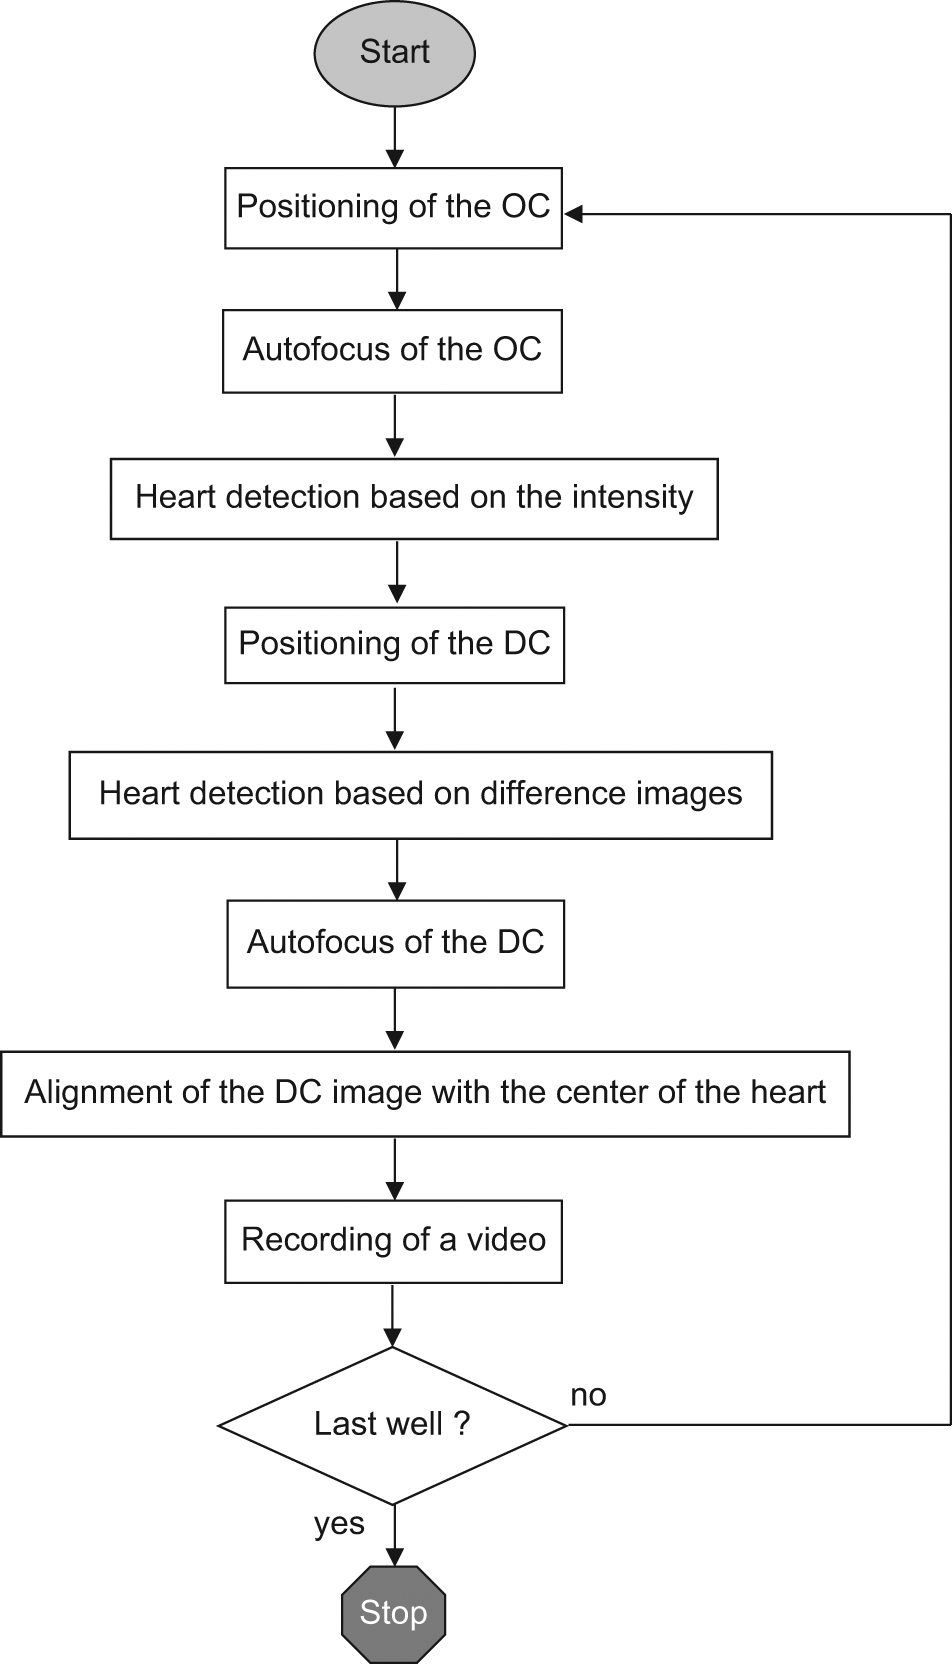
Workflow for the automated high-throughput screening with feature detection. OC = overview camera, DC = detailed view camera.
Illumination is based on transmitted light. The light source is a 168 LED matrix with an integrated diffusing panel for homogeneous illumination of the 96-well plate. Constant illumination significantly reduces the spontaneous movement of the fish larvae. Moreover, the temperature is kept constant at 27 °C.
Autofocus of the Overview Image
A passive autofocus system was applied. It does not require light from an assist beam. Autofocusing is achieved by contrast measurement to quantify the sharpness of the image. 17 According to some authors,18–20 an edge detection algorithm based on the Sobel operator was chosen from among different methods, as this method is established well and is relatively insensitive to noise. The Sobel operator 21 is a linear high-pass filter that combines a differentiation with a Gaussian filter.
The OC with the larger FOV is moved on the z-axis while recording images of the zebrafish. Typically, the sharpness function of the edge detection algorithm increases toward a maximum and then decreases continuously, allowing the robot control algorithm to decide at what distance the zebrafish appears sharp.
Zebrafish Detection
To determine the zebrafish heart for a close-up video, the zebrafish is isolated from the background by a combination of various segmentation operations, as illustrated in Figure 3 . Prior to segmentation, a linear grayscale adaptation is performed ( Fig. 3A ). Segmentation starts with an edge detection using the Canny algorithm 22 ( Fig. 3B ). The Canny algorithm yields a binary image that contains edges of one pixel in width only. As the edges represent the contours of individual objects only, a dilatation of the structure element is performed ( Fig. 3C ). As a result, the edges are connected, and the contour is “filled” much better. To fill the holes inside the fish contour, “hole filling” is subsequently carried out. It produces connected areas that are larger than the objects proper due to dilatation. Following this, more erosions than dilatations are applied to remove small particles, such as dust superimposing the fish contour ( Fig. 3D ). Finally, dilatations are applied, resulting in an area whose contours coincide well with the object edges ( Fig. 3E ). Areas contacting the image edge of the largest object are then eliminated, and the remaining segment is placed as a mask across the original image to isolate the fish from the background. A convex envelope is formed, characterized by all connecting lines of the edge points lying completely inside the envelope. This completes the segmenting, and the position of the heart can be determined.
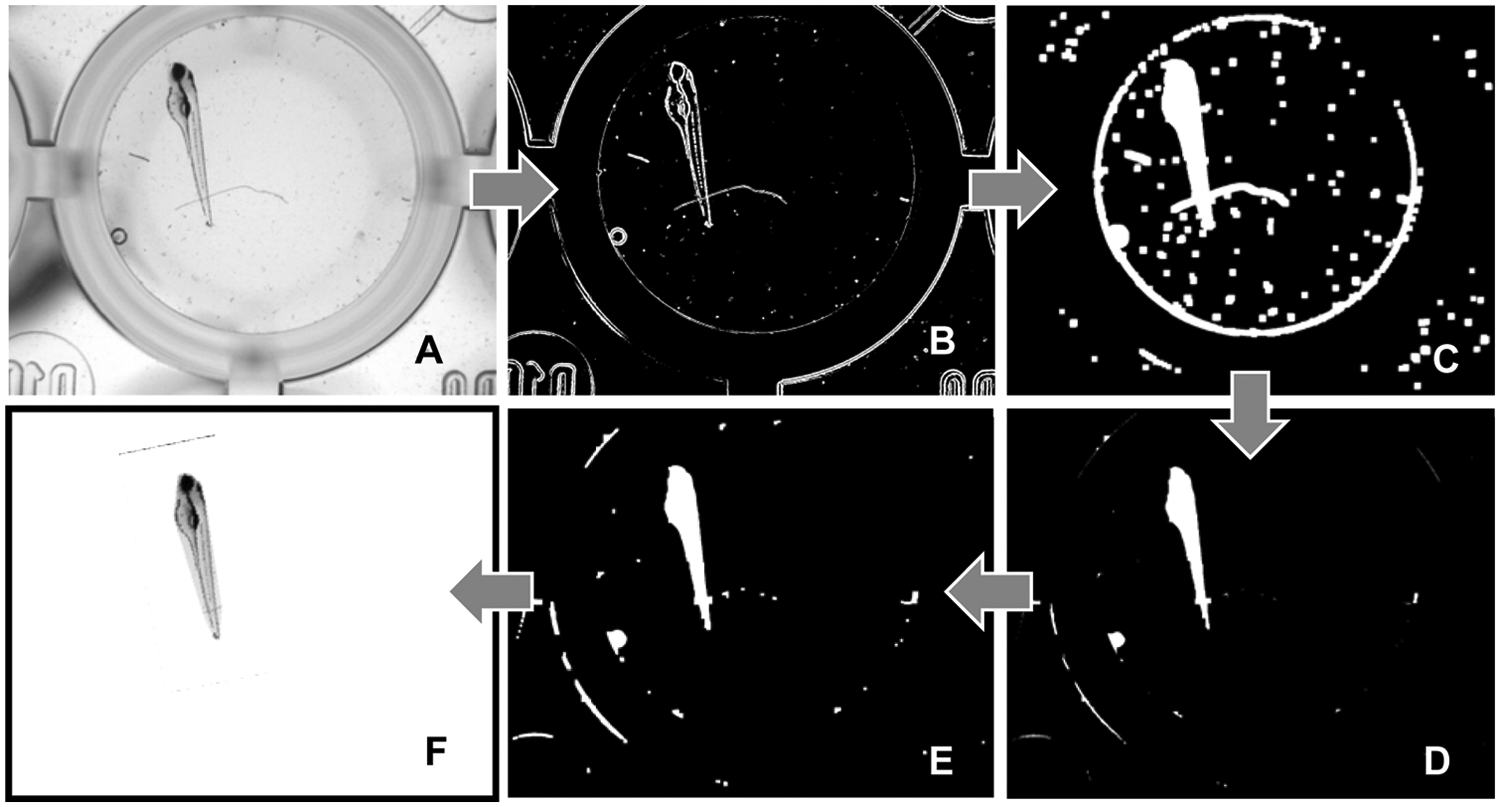
Individual steps of segmentation: (
Heart Detection
Determination of the heart position has to be performed independently of the orientation of the zebrafish in a horizontal plane, as no agarose molds are used to ensure constant orientation. All positions are characterized by a light intensity distribution along the longitudinal axis of the zebrafish. The position of the heart corresponds to a region of higher light intensity between two prominent regions with low light transmission: the eyes and the yolk sac. First, the camera with the detailed view is positioned in line with the detected region (fish heart). Subsequently, the center of the heart is determined more precisely with the help of the difference image procedure. The heart region is recorded with a small time interval. Noise of the camera sensor is eliminated by a threshold value method. The remaining difference values are filtered with a particle filter, and the coherence of adjacent pixels is generated by repeated dilatation and erosion. Then, the center of mass of the largest area formed is calculated and stored as the center of the desired image section. The previously assumed position for the center of the heart is refined, and inaccuracies from robot positioning are compensated. Finally, the image size is cut by a corresponding function of the camera to reduce computing power as well as the data volume transmitted.
Autofocus of the Detailed Image
After the camera has been positioned in line with the center of the fish heart, a sequence of images is recorded. Autofocusing starts at a given point and moves the camera toward the object in a stepwise manner. In every step, an image is recorded; sharpness is calculated and stored with the corresponding camera position in an array. The loop is discontinued when reaching the maximum camera position or when the current sharpness drops below ¾ of the maximum sharpness. Then, the measured values are interpolated by a cubic spline, and the camera is moved to the sharpest z-position. To calculate sharpness, the image is first filtered using the Sobel algorithm. Then, all pixel values of the resulting edge image are summed and normalized by the number of pixels.
Graphical User Interface
The graphical user interface offers an automatic and a manual control mode. The automatic control mode ( Fig. 4 ) is kept as simple as possible. Prior to screening, a range (A–H, 1–12) within the 96-well plate has to be defined. Subsequently, it may be chosen between a single image and the image sequence (video) mode. A live view from the OC of the current well is displayed at the corresponding position in a 96-field matrix, including a red dot indicating the position of the zebrafish heart. In addition, a bar indicates the progress of the process. Images in the matrix from a previous screen can be deleted with a “clear” button, and screening is started with a “go” button.
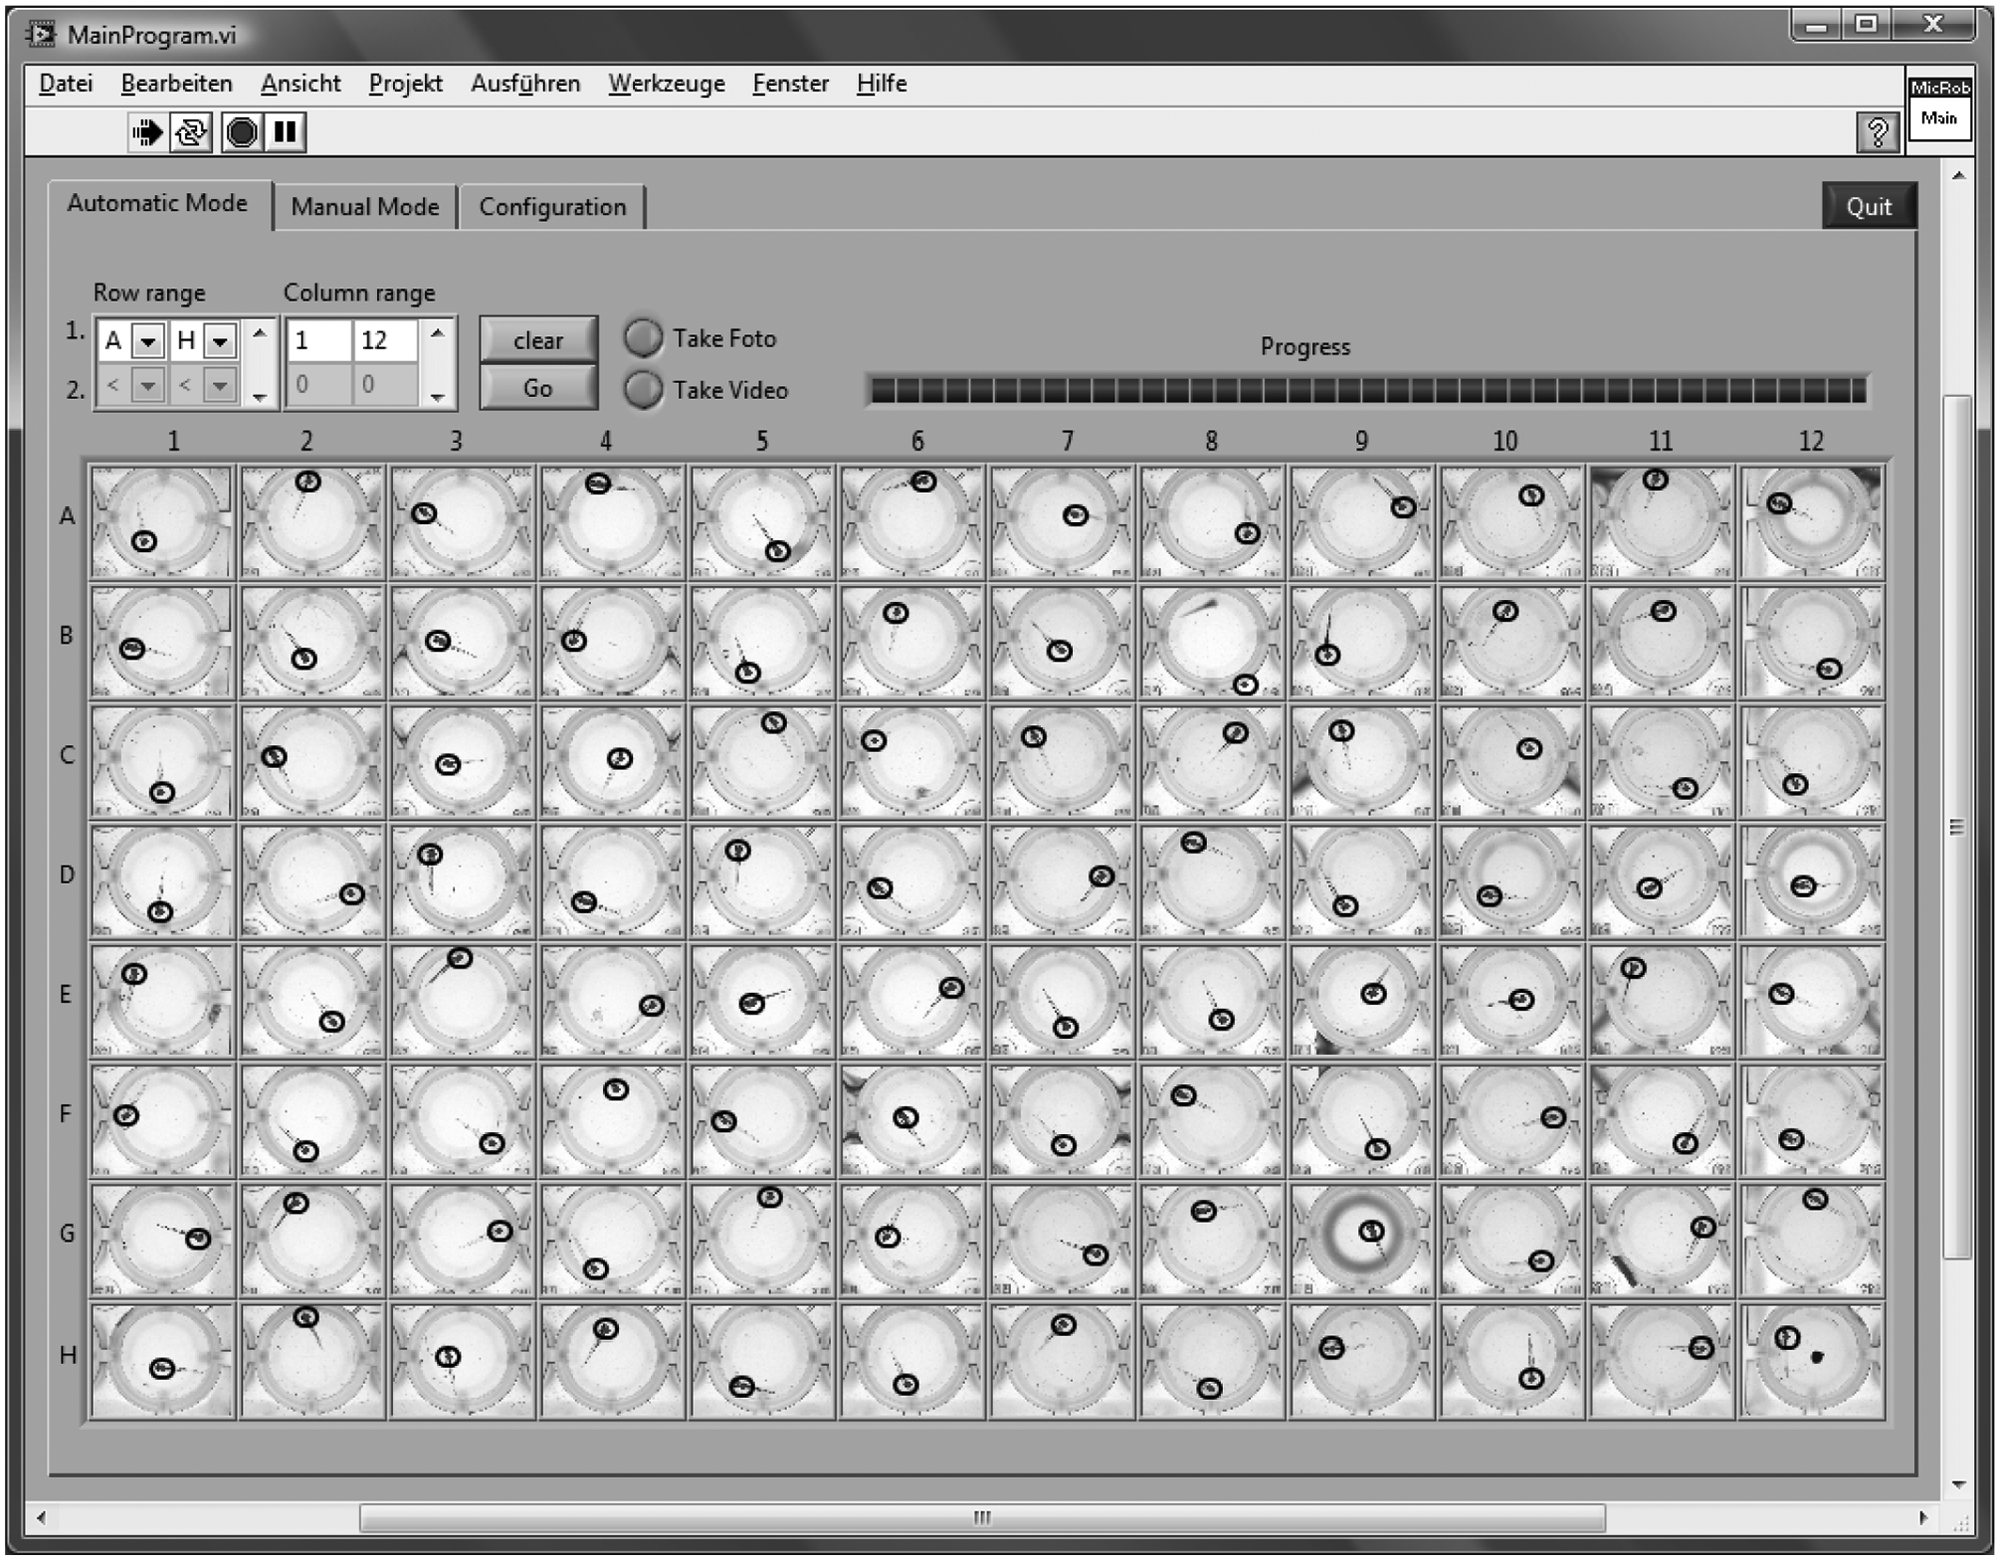
Graphical user interface in the automatic mode: overview of prescreen images with tagged heart position (black circles) from a 96-well plate. The overall number of buttons is kept low for simplicity. The row and column range (A–H, 1–12) of screening within a 96-well plate can be defined, and progress is displayed in a bar. Then, one can chose between single image and image sequence (video) mode. Either single images or videos of each well can be recorded.
In the manual mode, access to all functions is provided ( Fig. 5 ). The object of “reference” (“A” in Fig. 5 ) is to establish a home, that is, an absolute position reference (referred to the entire axle), and it must usually be executed once prior to a screen, because normal encoders register the position within only one revolution. To image a specific well, the robot can either be moved to any predefined relative or absolute position or controlled via a “+”-control pad, both arranged in input field “B.” Videos can be started manually by pressing a button in input field “C.” Prior to that, the camera (detail or overview), the number of images, and the file name have to be chosen. The z-position of the last autofocus is displayed in the input/output field “D.” This information may be helpful in manual screening. Furthermore, in the case of a change in the motor parameters, the stepper motor controller can be reinitialized. In input field “E,” both cameras can be controlled individually. The cameras can be moved to a predefined center position with a “Center” button after tagging a position in the overview image with the tool labeled “H” in Figure 5 . The accurate center position is stored with “Save as A1.” Autofocusing is started with “Focus” and can either be determined from the entire image or limited to a selected ROI by using tools on the left side of input/output field “F” or “G.” “Move” switches from the overview camera to the detail camera, and the current image from the corresponding camera can be displayed with “Refresh.” Finally, the camera exposure time can be changed manually at the bottom of input/output field “F” and “G.”
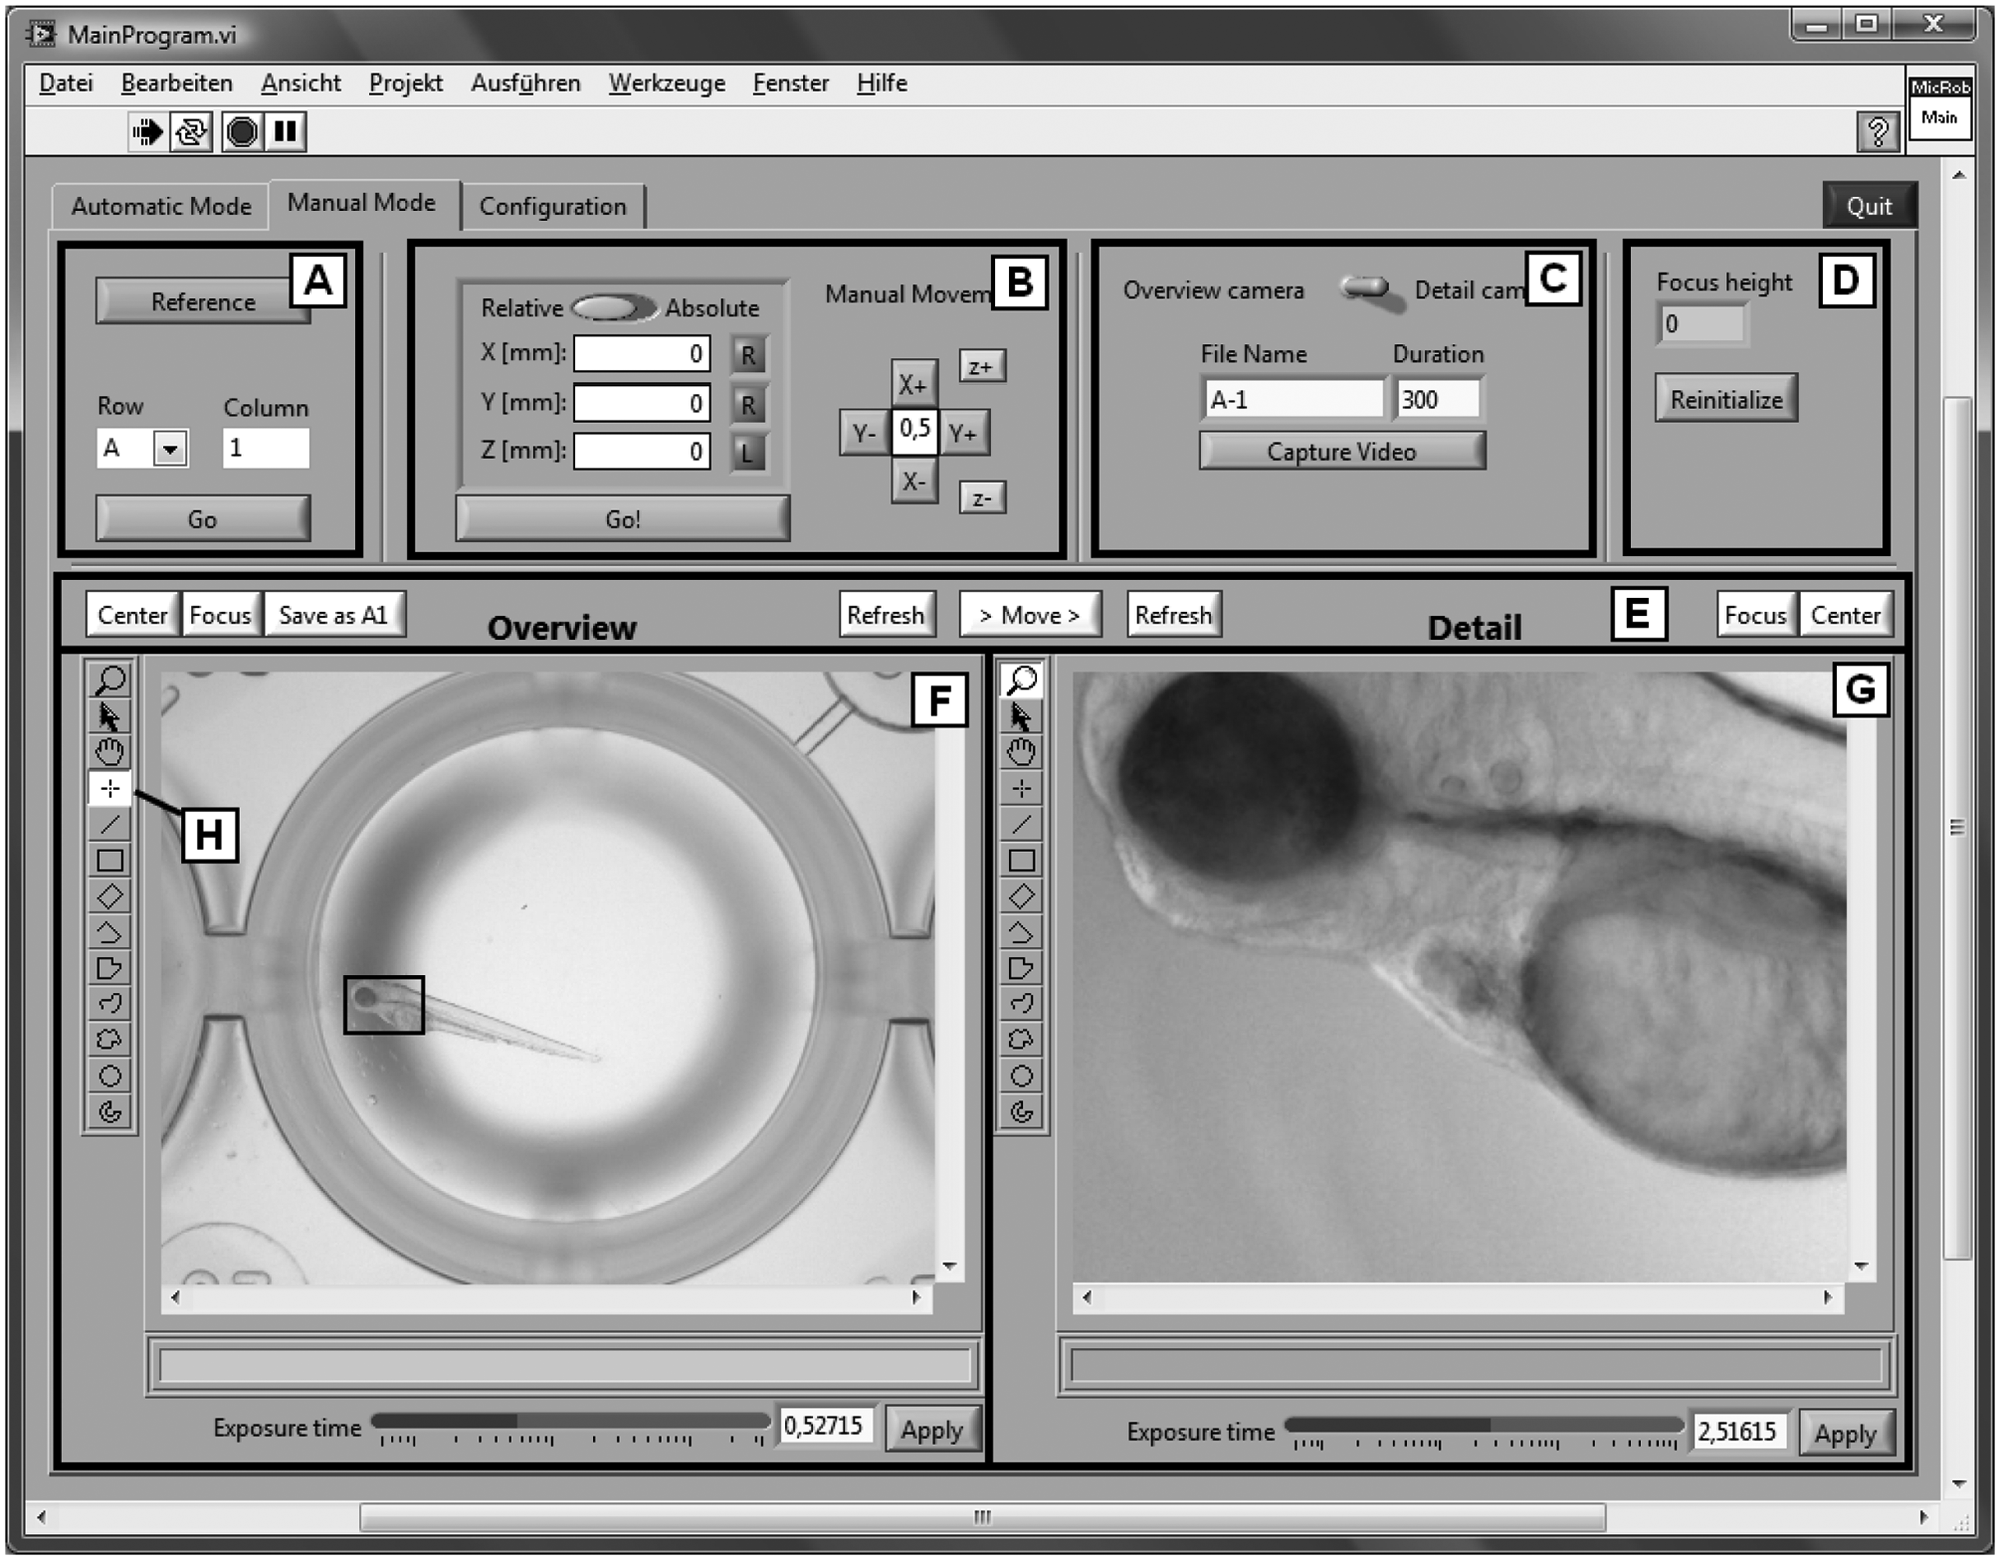
Graphical user interface in the manual mode. In field “A,” the camera position can be referenced. Field “B” allows for camera movement to any predefined relative or absolute position. Video capture is started in “C” after selection of the camera and the number of images (“Duration”). Reinitialization of the stepper motor controller can be executed in “D.” In input field “E,” the cameras can be moved to a predefined center position (“Center”) and stored (“Save as A1”). Autofocusing is started with “Focus” and can be limited to a selected region of interest by using tools on the left side of input/output field “F” or “G.” A current image from the corresponding camera can be displayed with “Refresh,” and the camera exposure time can be changed manually.
An additional tab, “Configuration,” is available for defining the location to save image files and to choose among different types of well plates, their orientations (crosswise versus lengthwise), and camera-specific parameters.
Reliability, Validation, and Discussion
The system described above was validated with both wild-type zebrafish larvae 60 hours postfertilization (hpf) and the zebrafish heart failure mutant main squeeze (msq) 14 of the same developmental stage.
Screening of a 96-well plate takes 30 to 50 min depending on the length of the video sequence taken of each zebra-fish heart. Camera autofocusing and positioning take 16 s per well with an Office PC with Intel Core 2 Duo E8400 CPU and LabView software for robot control and image analysis. The autofocus duration can be reduced easily either by using a computer with a more powerful CPU or by GPU computing. A video recording duration of 15 s per well is recommended to observe a sufficient number of heartbeats (about 30) for subsequent cardiac frequency analysis. For this reason, screening of 96-well plates and video capturing of beating fish hearts take longer than 24 min.
Reliability of Heart Detection
To evaluate the performance and robustness of the system a total of six flat-bottom 96-well plates with anesthetized (Tricain) zebrafish larvae (60 and 72 hpf) were scanned. The zebrafish larvae have been placed into the well plate with an automatic fish-sorting robot. 16 Each zebrafish was captured first by a single image of the overview camera and then by a sequence of 10 images with the detailed view camera with a reduced resolution of 800 × 640 pixels at a video frame rate of 10 fps. The average scan process for a 96-well plate took 18 min. The content of the images was studied, and the ratio of videos showing the heart region was determined ( Table 1 ).
Result of the Automated Heart Detection
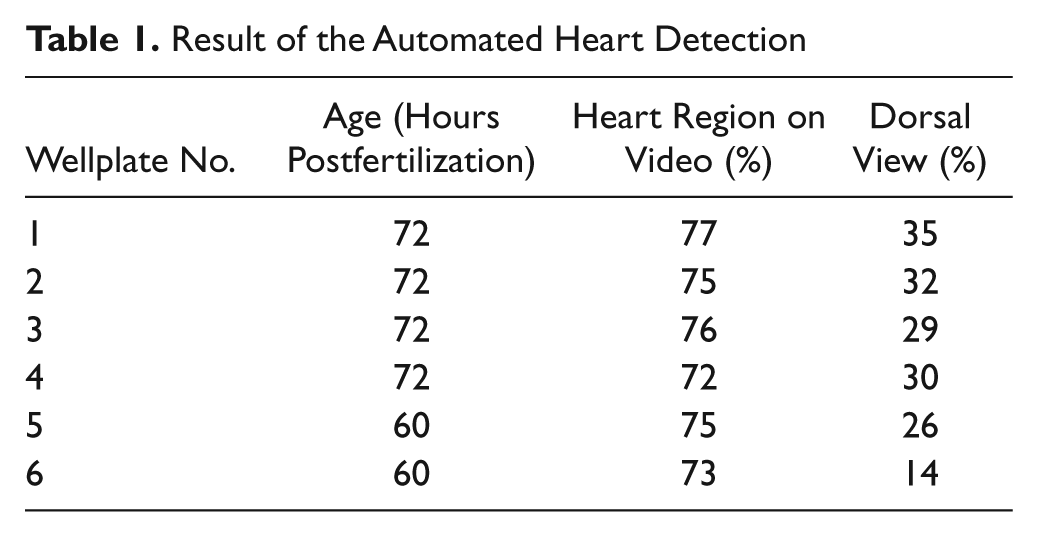
On average, 75% of the videos showed the entire heart region of the zebrafish. In 5% of the videos, the tail of the zebrafish or just a part of the heart region was displayed, and 20% contained no part of the zebrafish at all. Reasons for nondetection of the heart region were that the zebrafish larvae were either in a head-over-tail position or close to the surface of the well, thus too far away from the range where the autofocus expected the position of the zebrafish or the algorithm for heart detection failed.
After placing the embryos automatically into the well plate, they were not aligned manually. The larvae did not show morphological signs of malformations. However, depending on the age of the zebrafish, 14% to 34% of all detected zebrafish appeared in the dorsoventral view and did not lie on their side. Ninety percent of these were located next to the wall of the well, thus stabilized in a dorsoventral position. Heart detection analysis can be more difficult in the dorsoventral or transverse view, because of the pigmentation interfering with the heart’s contour. In this case, treatment of the embryos with 0.003% PTU (1-phenyl-2-thiourea) at 24 hpf is recommended to suppress pigmentation.
Functional Validation
Finally, a simple functional validation test was performed. By 60 hpf, both zebrafish heart chambers, the ventricle and the atrium, contract rhythmically, sequentially, and vigorously in wild-type embryos. In contrast to the wild-type situation, the ventricular chamber of heart failure main squeeze (msq) mutant embryos displays severe contractile dysfunction.
14
Because of the progressive reduction of cardiac contractility, main squeeze mutant embryos develop a pericardial edema, and blood circulation through the vascular bed is completely abolished (see the
Conclusion
An intelligent microscope was presented that automatically detects the heart of a zebrafish and records image sequences at up to 30 frames/s. In contrast to other robot-assisted microscopes, the objects do not have to be oriented accurately in molds. Hence, they can be identified and autofocused in a micro well. The success rate for automatic screening of the heart region of zebrafish larvae without any manual handling was 75%. The components used are low priced, and both the hardware design and the software are simple but effective and can be easily replicated for high-throughput drug screening on a large scale. The new screening tool presented will allow for the identification of new active compounds, for example, for the treatment of cardiomyopathy and arrhythmia.
In the near future, a software add on will be available for automatic detection of the frequency and beat-to-beat interval of zebrafish hearts that were recorded with our microscope. 23
Footnotes
Acknowledgements
The authors thank Christine Wittmann from the Institute of Toxicology and Genetics (Karlsruhe Institute of Technology, Germany) and the Rottbauer Lab (University Hospital Ulm, Germany) for counseling and support with fresh zebrafish larvae.
Declaration of Conflicting Interests
The authors declared no potential conflicts of interest with respect to the research, authorship, and/or publication of this article.
Funding
The authors received financial support for the research, authorship, and publication of this article from basic funding of the Helmholtz Association. They received no financial support from a third party.
References
Supplementary Material
Please find the following supplemental material available below.
For Open Access articles published under a Creative Commons License, all supplemental material carries the same license as the article it is associated with.
For non-Open Access articles published, all supplemental material carries a non-exclusive license, and permission requests for re-use of supplemental material or any part of supplemental material shall be sent directly to the copyright owner as specified in the copyright notice associated with the article.