
Abstract
High-content tumor cell migration assays in 3-dimensional (3D) extracellular matrix are a powerful tool for modeling and understanding the biology of this critical step in the process of metastasis. Currently available methods offer very limited throughput and are not amenable to studies of comparative pharmacology or small-scale screening. The authors present an automated approach to high-content tumor cell migration assays. A standard screening-sized plate with an array of microchannels was designed and constructed from common thermoplastics. After filling the channels with 3D matrix, cells were placed at one end of the channel, and migration into the channel was monitored via an imaging system. All liquid-handling steps were performed by standard liquid-handling robotics. Tumor cell migration in the channel was truly 3D and correlated with metastatic potential. The information-rich data from these assays were used to rank the potency of compounds inhibiting migration through 3D collagen as well as to gain additional insights into the compounds’ activities related to cell health. This approach is compatible with a variety of multiparametric, morphological, and/or kinetic readouts.
Introduction
M
Fibrillar collagen is the main component of the stromal ECM and as such is often used as a model for tumor cell migration through the connective tissue. Using fibrillar type I collagen as a 3D scaffold, Wolf and others 1 probed the role of proteolysis in tumor cell migration. They showed that multiple types of cancer cells continue to migrate when protease activity is strictly inhibited; this is accompanied by a transition from spindle-shaped mesenchymal morphology to a rounded amoeboid morphology. The biological relevance of these in vitro observations has been corroborated by in vivo imaging using intravital multiphoton microscopy. 1 On the other hand, Matrigel, a laminin-rich ECM (lrECM) preparation from Engelbreth-Holm-Swarm (EHS) tumors in mice, can support differentiation and polarization of epithelial cells in vitro. 6 For this reason, lrECM is often used as a model for the epithelial basement membrane, both in studies of differentiation and early aspects of invasion (i.e., the traversing of the basement membrane).
In practice, the throughput of high-content assays for tumor cell migration in 3D ECM is quite limited. Very few experimental conditions can be processed in parallel. The key limitations to increased throughput are the manual steps required and the need for kinetic cell tracking to quantify migration distances. To overcome the obstacles associated with horizontally oriented, image-based 3D migration assays, we designed and fabricated an array of 192 microchannels in a standard screening-sized tray. These devices can be operated by generic liquid handling and imaging instrumentation, allowing the entire assay to be automated. Because the cells are patterned specifically at one end of the very thin, matrix-filled microchannels, the assay can be read as an endpoint assay and imaged in a single optical plane, thus avoiding the need for both kinetic and multiplane imaging.
Materials and Methods
Devices
The microchannel plates were produced using a thermoplastic material commonly used for cell-based screening plates (cyclo-olefin polymer [COP]) and standard molding techniques. The internal surfaces were exposed to a tissue-culture treatment, which renders them hydrophilic; the top surface of the plate was protected from the treatment to retain the natural hydrophobic property of the material. This enables them to maintain a volume of fluid—a droplet—typically 5 µL, constrained at the perimeter of the output port by surface energy (see Fig. 1D ).
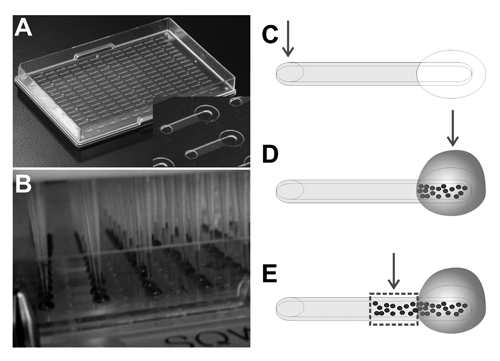
Device design and operation. (
Reagents
High-density Rat Tail Collagen Type I and growth factor reduced basement membrane, Matrigel™, were purchased from BD Biosciences (San Jose, CA). Blebbistatin, Y-27632, and Latrunculin B were purchased from Calbiochem (San Diego, CA). Cytochalasin D, Hoechst-33342, and paraformaldehyde were purchased from Thermo Fisher Scientific (Pittsburg, PA). PC3-M cells were a generous gift from Dr. Ray Bergan (Northwestern University, Evanston, IL). Penicillin/streptomycin (pen/strep) solution, RPMI Basal Media, fetal bovine serum, amphotericin B, sodium pyruvate, permeabilization buffer, and blocking buffer (10% goat serum in phosphate-buffered saline [PBS]) were obtained from Thermo Fisher Scientific (Waltham, MA). Alexa-594 conjugated phalloidin was purchased from Life Technologies (Portland, OR).
Cell culture
PC3-M cells, a metastatic 7 and invasive 8 variant of the prostatic carcinoma cell line PC3, were cultured in T25 or T75 flasks and kept between 10% and 90% confluent. Cells were grown in RPMI supplemented with 10% heat-inactivated fetal bovine serum, 1 mM sodium pyruvate, and 100 IU/mL pen/strep and subcultured every 2 to 3 d. Eight micrograms per milliliter amphotericin B was added to the media during migration assays. Culture of T47D and MDA-MB-231 cells was similar to that of PC3-M, with the exception of MDA-MB-231 media composition, which was DMEM supplemented with 10% fetal bovine serum and 1 mM sodium pyruvate.
Invasion protocol and liquid handling
The microchannel arrays were sterilized via γ-irradiation (STERIS Corp., Mentor, OH). Type I collagen was provided in 0.02 N acetic acid, which was first neutralized according to the protocol provided by BD Biosciences. 9 Briefly, the collagen was neutralized and diluted to a final concentration of 1 mg/mL by adding to a solution of 10× PBS, 1 N NaOH, and diH2O. lrECM (Matrigel, BD Biosciences) was diluted 1:1 in PC3-M growth media. All components and solutions were kept on ice until added to the device.
The microchannels were filled with matrix using either a CyBi-Well with a 96-channel, 25-µL head (CyBio, Jena, Germany) or a Multidrop Combi nL (Thermo Scientific). All subsequent addition and removal of liquid from the tray was done using the CyBi-Well. The volume dispensed to fill the channel was optimized such that the matrix wicks just to the end of the channel without flowing into the output port: 800 nL and 782 nL for the CyBi-Well and Combi nL, respectively. Plates filled with lrECM were incubated at 37°C for 60 min to allow matrix to gel, and a 0.5-µL droplet of PBS containing 100 IU/mL Pen/Strep was then added to the output port. After neutralization, type I collagen was kept on ice for 20 to 30 min prior to dispensing to initiate collagen fiber formation. The plates were then incubated at 37°C for 60 min to allow the collagen fibers to fully form and gel. A 0.5-µL droplet of PBS with 1× Pen/Strep was then added to the input port, which seeped through the collagen mesh to fill the output port with a small amount of liquid. The plates were then wrapped with parafilm and stored at room temperature in a sealed plastic bag up to 6 d prior to use.
PC3-M cells were harvested and resuspended in growth media containing 1× Pen/Strep and 0 to 8 µg/mL amphotercin B. The cell and inhibitor compound addition was performed by the CyBio in 1 of 2 ways: 1) 2000 cells were added in a 2.5-µL droplet and allowed to adhere for a minimum of 30 min. A subsequent 2.5-µL droplet containing 2× compound was added; or 2) 2000 cells were added in a 5-µL droplet and allowed to adhere for a minimum of 30 min. This droplet was then removed and replaced with a 5-µL droplet containing 1× compound. Any time the plate was not being actively handled, it was housed inside a 245-mm × 245-mm bioassay dish (Corning, Corning, NY) surrounded by paper towels moistened with PBS. The plate in the humidified bioassay dish was then placed in an incubator for up to 5 d. Growth media was exchanged daily by removing and replacing the 5 µL output port droplet.
Immunoassay
Cells were fixed for 20 min at room temperature (RT) with 2% paraformaldehyde diluted in PBS, then permeabilized for 30 min at RT. The channels were washed twice with PBS. Blocking buffer was then added for 30 min at RT. Alexa 594-conjugated phalloidin was diluted 1:50, added to the plate, and incubated for 1 h at RT. All additions of immunostaining reagents in collagen-filled plates were done by first removing the output port droplet and then performing 4 sequential additions of 1 µL to the input port, except for the permeabilization step. Approximately 1 min was allowed between additions for the droplet to seep through the collagen in the channel to the output. Only 1 µL of permeabilization buffer was added to the input port, followed by 3 µL to the output port. All additions of reagents in lrECM-filled plates were done by removing and replacing 4-µL droplets at the output port.
Cell density and migration assay
The cell density assays were performed by removing the output droplet and replacing with 5 µg/mL Hoechst 33342 solution in PBS. The plate was incubated at 37°C for 30 to 60 min. The output droplet was exchanged with a 5-µL droplet of PBS prior to imaging. After imaging the output port, the cells in the channel and output port were fixed and permeabilized by removing the output droplet and replacing with 3 µL of 70% ethanol for 30 min. This droplet was then removed and replaced with 5 µL of 5 µg/mL Hoechst 33342 in PBS, and the plate was incubated for 30 min. The droplet was removed and replaced with 5 µL PBS prior to imaging the channel region.
Imaging and image analysis
A Nikon TE-2000U microscope was outfitted with an automated stage, camera, shutters, and epifluorescent filter wheel. The excitation and emission filter set was the 89000 Sedat Quad–ET from Chroma. Hoechst was imaged with the blue 350/455 (nm Ex/nm Em) set, and Alexa 594 was imaged with the 555/605 filter sets. Metamorph software (Molecular Devices, Downington, PA) was used to direct the automation of acquiring images with a 4× or 10× objective. Because precise positioning of the region of interest was critical for high-quality data, a custom acquisition method was optimized for positioning of the stage. For both assays, a built-in autofocus algorithm was used in the output port to find the bottom surface. In the cell density assay, a region in the output port was captured in a single exposure using the 10× objective. The total time to image the output port for 192 channels was approximately 25 min. To image the migration region of interest, an intermediate plane (75 µm above the floor of the channel) was captured with the blue filter pair and 4× objective. Total imaging time to capture the migration region of interest was approximately 25 min.
The count nuclei application provided by Metamorph was used to segment the Hoechst image into individual objects and identify cells in the region. The user settings defining the objects were 6 µm minimum diameter, 14 µm maximum diameter, and 400 gray-scale levels above background. The count nuclei and integrated morphometry analysis applications were used in combination to first identify and segment nuclei as objects and then record the X and Y coordinates of each object. The user settings here were 10 µm minimum diameter, 14 µm maximum diameter, and 300 gray-scale levels above background. The X coordinates were converted to the distance migrated from the interface between the collagen and output port.
Results
Device and assay design
To realize migration assays featuring cell patterning, automated reagent changes, and a thin, microscopically accessible 3D matrix compartment, an array of linear microchannels was produced. Figure 1A shows an image of the entire plate and a close-up image of 2 channels (inset). Each channel is 1-mm wide, 140-µm tall, and 3.4-mm long, with a volume of approximately 500 nL. The channel is open to the air at each end, with a 1.2-mm-diameter input port on the left and a 2.5-mm output port on the right. When a small (<1 µL) droplet of ECM is added to the input port, the channel becomes filled with matrix, and the flow stops reliably at the end of the channel. Once the channel is filled with liquid or fibrillar collagen, the fluid contents of the channel can be exchanged without disrupting the gel by simply placing a 1- to 2-µL droplet on the input port. Surface tension–driven flow, termed droplet-based passive pumping, results in the liquid being driven into the output port. 10 The 192 channels are arrayed on the tray with spacing such that standard liquid handlers can be used to access either port, and all channels can be captured using standard imaging equipment. 11
For the invasion assay, all liquid-handling steps were carried out using a CyBi-Well liquid-handling instrument equipped with a 96-channel dispensing head ( Fig. 1B ). Dry channels were first filled with matrix through the input port (shown schematically in Fig. 1C ). Once the 3D matrix had gelled, tumor cells were added to the output port ( Fig. 1D ). Cells were then incubated for 5 d at 37°C and 5% CO2, and media were changed daily at the output port. Cells migrated from the right end of the channel leftward into the matrix ( Fig. 1E ). At the end of the assay, cells were stained with a nuclear dye and images were taken of the channel region and also the output port where cells were originally added.
Characteristics of tumor cell migration in 3D collagen
Cells of different metastatic potential were subjected to the 3D collagen microchannel invasion assay. Over the course of 72 h, highly metastatic PC3-M cells ( Fig. 2A ) and MDA-MB-231 cells (not shown) readily entered the matrix and migrated up to 500 µm. The invading cells were mostly individual cells without significant cell-cell contacts. In contrast, nonmetastatic T47D cells ( Fig. 2B ) barely entered the channel and completely lacked independent cell movement. To further characterize the invasion of PC3-M cells and determine the role of 3D collagen, assays were carried out in channels either prefilled with 3D collagen ( Fig. 2C ) or containing only liquid media ( Fig. 2D ). There was little movement of cells (<200 µm) into channels containing only liquid media, whereas migration distances were evenly distributed across more than 1000 µm in the presence of 3D collagen. Without matrix, cells moved into the channel as a monolayer on the bottom surface of the channel, but in the collagen-filled channels, the movement of the cells was truly 3D. Imaging the channel at various Z-heights representing the top, middle, and bottom of the channel revealed cells were clearly distributed across the full height of the channel, illustrated in Figure 2C and shown graphically in Figure 2E . Higher magnification of the cells migrating in collagen show cell membrane protrusions that coincide with collagen fibers, suggesting that their movement is directly influenced by interactions with the extracellular matrix ( Fig. 2F and 2G ).
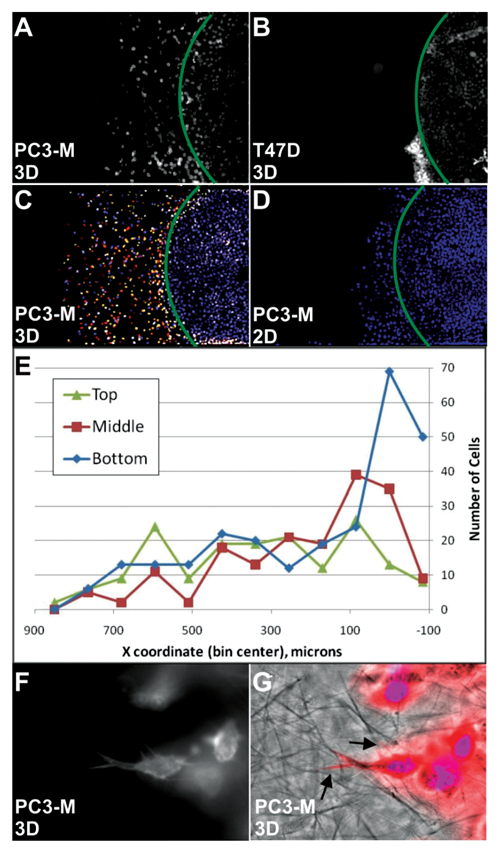
Tumor cell migration in type I collagen gel correlates with metastatic potential and is 3-dimensional (3D). Metastatic PC3-M cells (
Because the cells migrate into the channel horizontally, the region of interest for this assay is viewable throughout the duration of the assay. Daily imaging of this region under phase contrast microscopy revealed that the average migration distance was greatest at day 5 ( Fig. 3 ). This, coupled with the observation that variability relative to signal:background ratios was best at 5 d (not shown), led us to run subsequent endpoint assays using a 5-d incubation period.
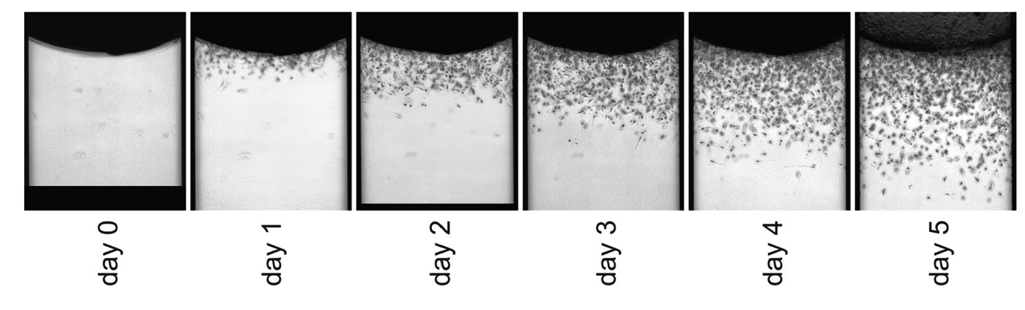
Tumor cell migration can be monitored over the duration of the assay. PC3-M cells migrated into type I collagen–filled microchannels over 5 d following the protocol outlined in the Methods section. Phase contrast images were captured daily with a 4× objective.
Inhibitor profiling
Using this assay, inhibition of PC3-M cell invasion by a single, high dose of blebbistatin or Y-27362 has been previously reported. 12 Here we investigate the ability of the assay to support determination of rank order of potency for use in compound profiling. To this end, titrations of active compounds were assayed, including latrunculin B, cytochalasin D, and blebbistatin. Latrunculin B and cytochalasin D are potent disrupters of actin polymerization and microfilament organization, 13,14 whereas blebbistatin is a specific inhibitor of myosin II. 15 The extent of migration was measured by counting the number of cells that had migrated past the vertical line tangent to the left-most edge of the output port, as indicated in Figure 1C . This line marks the interface between the 2D and 3D compartments of the microchannel: The output port to which cells are added contains only liquid media, whereas the channel is filled with collagen. To probe for general effects on cell health, images in the output port were also taken and quantified for cell number. To assess the effects on cell migration normalized for any differences in total cell number, a ratio was determined by dividing the number of migrating cells by the number of cells in the output port. In each case, the inhibitors produced a clear, dose-dependent reduction in number of cells migrating, and these reductions were not accompanied by proportional decreases in number of cells in the output port ( Fig. 4A ). At higher doses, however, each compound had some effect on the number of cells in the output port. In the case of cytochalasin D and latrunculin B, the highest doses led to complete loss of cells, whereas with blebbistatin, the maximal effect was a reduction of cells by about 50%. In each case, the comparison of the 2 effects, particularly the separation of the invasion and output port cell number curves, yields insights into the window of specific antimigration activity versus more general cell health effects. Furthermore, images of nuclear stained cells in the output port can be used for nuclear morphology assessments. In this case, it was revealed that high doses of blebbistatin resulted in aberrantly large nuclear morphology ( Fig. 4B ). In terms of data quality and potential for compound screening applications, this assay yields a Z′ of 0.44, as determined by treatment with 5 µM blebbistatin compared with untreated controls.
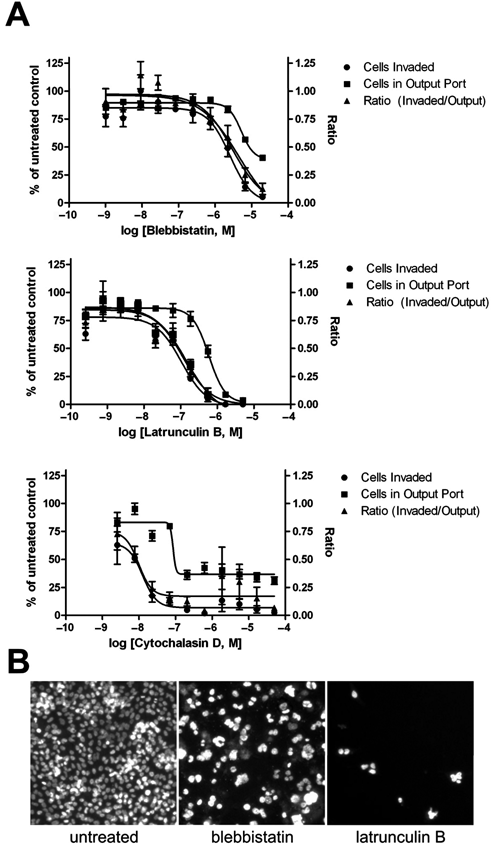
Quantitative analysis of inhibitors of migration. PC3-M cells migrate into type I collagen–filled microchannels over 5 d. Media containing a titrated dose of inhibitor were replenished daily. The number of cells that migrated greater than 150 µm from the port edge was quantified and shown normalized to the untreated control. Nonlinear variable-slope curves were fit to the data (GraphPad Prism). Corresponding IC50 values and 95% confidence intervals are shown in Table 1. n = 4. Error bars represent standard deviations. (
Because effects on the number of migrating cells can potentially be influenced by differences in cell proliferation rates during the assay, alternative methods of analysis were explored. When compared to a count of cells that enter a region of interest, the distribution of cells is more likely to be independent of effects on proliferation. We reasoned that if a distribution-based analysis yielded similar results to cell count–based approaches, this would improve the understanding of the specificity of a compound’s activity. Figure 5 shows the cumulative frequency of distances travelled by the cells, as a percentage of the cell population ( Fig. 5A ). For example, 25% of the untreated cells moved 371 µm or more, whereas for the inhibitor treatments, this distance was decreased to 130 to 150 µm. This underscores that treatment with inhibitor leads to a clear shift in distribution of distance migrated, not just number of cells entering the channel. Furthermore, the distances traveled in this assay are similar to previous studies. PC3M cells in our assay moved with a median rate of 1.7 µm/h, whereas Niggemann and others 16 have recorded median rates of related tumor cell types of 2 to 3 µm/h. A box-whisker plot of cell migration distances, as shown in Figure 5B , reveals that the top 5% of the cells have traveled at least 650 µm in the untreated control as compared with 325 µm or less for the cells treated with any of the inhibitor compounds. For each of the 3 inhibitor compounds, the changes in cell distribution were statistically significant by the Mann-Whitney test (p < 0.001). These results confirm that the effects on number of cells migrating into the channels are not simply due to alterations in proliferation rates.
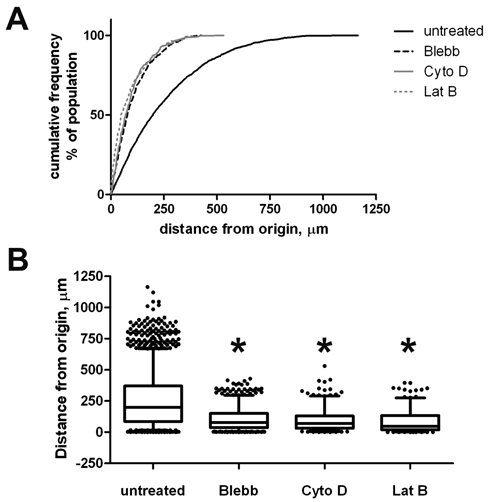
Analysis of migration based on cell population distribution. PC3-M cells were treated with 6.7 µM blebbistatin, 0.56 µM latrunculin B, 7.6 nM cytochalasin D, or left untreated for a 5-d migration assay in type I collagen. Migration distances were reported based on an origin corresponding to a vertical line tangent to the boundary between channel and output port; positive distance reflects distance from this line into the channel region. (
In terms of ranking compound potencies, the cell distribution method is also a viable alternative. IC50s using both methods were calculated and are reported in Table 1. Confidence intervals on these IC50 determinations were ±0.3 log molar units or less, and the correlation between cell number and distance-based analysis methods was high. In terms of data reproducibility, IC50s for blebbistatin determined on 3 separate days yielded 2.1, 3.9, and 2.5 µM, corresponding to a mean of 2.9 ± 0.9 µM (SD).
Compound Potencies Determined by 2 Different Analysis Methods
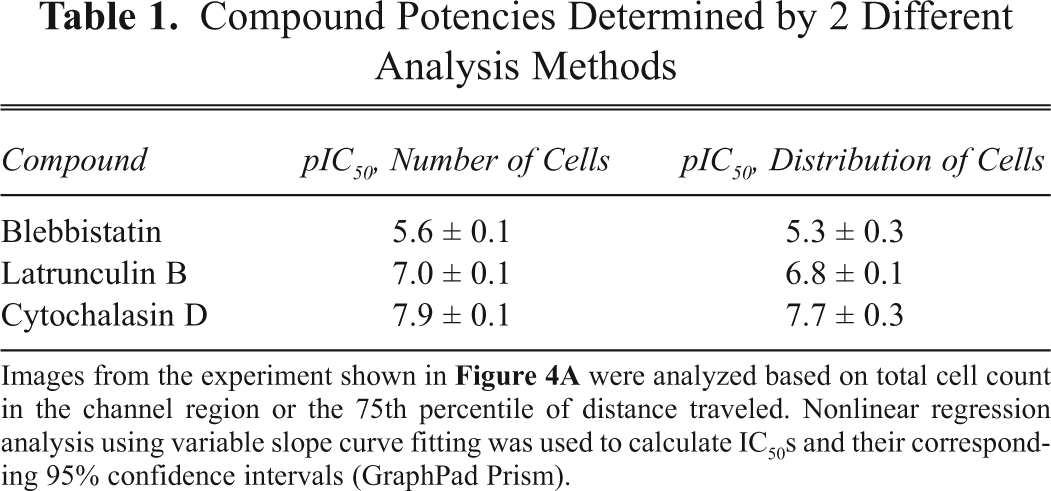
Images from the experiment shown in
Invasion through 3D lrECM
Invasion through laminin-rich ECM provides a model for the breaching of the basement membrane at the primary tumor site, a very early event in metastasis. We observed invasion of PC3-M cells into the lrECM over 5 d (
Fig. 6
). Staining of nuclei and F-actin revealed far fewer cells entered the channel compared with collagen, and those that did possessed a strikingly different organization. After 1 d in lrECM culture, cells formed extensions into the matrix (
Fig. 6A
). After 5 d, the cells in lrECM had fully entered the matrix and in some instances formed chainlike columns of cells protruding into the gel (
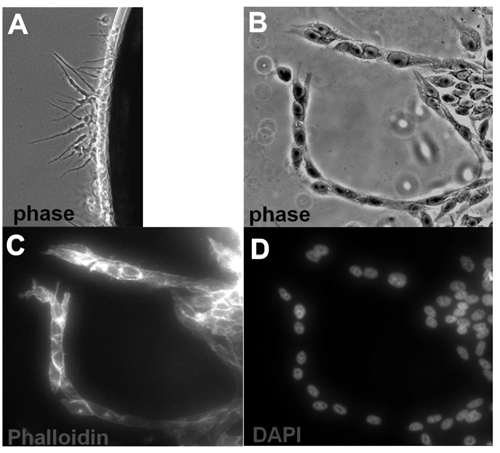
Invasion through laminin-rich extracellular matrix. Channels were filled with laminin-rich ECM (Matrigel™) with CyBi-Well liquid handler. (
Discussion
We have demonstrated that arrays of microchannels can be used to extract quantitative assessments of a compound’s effect on tumor cell migration through 3D collagen. Operation of the device can be automated using standard liquid handling and imaging instrumentation. The movement of the cells is truly 3D, whereas imaging can be 2D. The assay can be read out in terms of number of cells migrated or distances migrated by individual cells, and analyses based on individual cells helps distinguish migration from proliferation. Additional information on the relative effects of a compound on invasion versus general cell health can be readily obtained. The demonstrated ability to incorporate molecular staining in these assays sets up the potential for target- or pathway-specific information to be multiplexed; the full potential of this aspect of analysis has yet to be realized. The assay also can be run in kinetic mode, shown here using transmitted light microscopy, but also amenable to cells expressing fluorescent proteins and/or chemical tracking dyes. The images gathered during this analysis allow conclusions on mode of migration to be ascertained. The clear distances between single cells migrating in type I collagen are consistent with an individualistic migration pattern typically associated with more metastatic cells, 17 whereas the migration seen in lrECM resembles the collective migration pattern seen in less metastatic tumor cells.
This approach opens up new possibilities previously precluded by reagent availability. The reduced cell numbers used (1000-2000 per channel) represents between 10- and 100-fold reductions from current methods while maintaining tight confidence intervals for potency and good Z′; this is attractive for primary cell assays in which cell number limitations cannot be exceeded. Also, the small volume of matrix (~800 nL) required opens up the possibility of running the assay in precious matrices purified from rare biological samples, which can represent specific physiological microenvironments. And because immunostaining can be readily achieved in these microchannels, the microenvironment can be further enhanced by co-culturing other stromal cell types such as fibroblasts or macrophages. The important role of these cells in tumor migration can then be captured while focusing on the tumor cells for the readout using selective staining strategies.
Footnotes
Acknowledgements
We would like to thank Ray Bergan and Becky Farmer at Northwestern University for their helpful discussions and insights and also for kindly providing the PC3-M cells.
This work was supported by NIH grant 5R44CA133909-03 from the National Cancer Institute.