
Abstract
With approval rates <5% and the probability of success in oncology clinical trials of 3.4%, more physiologically relevant in vitro three-dimensional models are being deployed during lead generation to select better drug candidates for solid tumors. Multicellular tumor spheroids (MCTSs) resemble avascular tumor nodules, micrometastases, or the intervascular regions of large solid tumors with respect to morphology, cell–cell and cell–extracellular matrix contacts, and volume growth kinetics. MCTSs develop gradients of nutrient and oxygen concentration resulting in diverse microenvironments with differential proliferation and drug distribution zones. We produced head and neck squamous cell carcinoma (HNSCC) MCTSs in 384-well U-bottom ultra-low-attachment microtiter plates and used metabolic viability and imaging methods to measure morphologies, growth phenotypes and the effects of 19 anticancer drugs. We showed that cell viability measurements underestimated the impact of drug exposure in HNSCC MCTS cultures, but that incorporating morphology and dead-cell staining analyses increased the number of drugs judged to have substantially impacted MCTS cultures. A cumulative multiparameter drug impact score enabled us to stratify MCTS drug responses into high-, intermediate-, and low-impact tiers, and maximized the value of these more physiologically relevant tumor cultures. It is conceivable that the viable cells present in MCTS cultures after drug exposure arise from drug-resistant populations that could represent a source of drug failure and recurrence. Long-term monitoring of treated MCTS cultures could provide a strategy to determine whether these drug-resistant populations represent circumstances where tumor growth is delayed and may ultimately give rise to regrowth.
Introduction
Historically, new cancer drug leads are identified in high-throughput screening (HTS) growth inhibition (GI) assays conducted in panels of tumor cell lines maintained and assayed in two-dimensional (2D) cultures.1–3 Cytotoxic compounds progress to antitumor efficacy studies in mice, and mechanism of action studies are instigated for compounds that demonstrate in vivo efficacy.2,4,5 For molecular agents targeting specific oncogenic alterations in tumor cells, biochemical or cell-based screens usually precede these steps.1–3 However, <5% of new small-molecule cancer drugs that enter phase I clinical trials gain Food and Drug Administration (FDA) approval, and between 2000 and 2015, the overall probability for success in oncology clinical trials was a dismal 3.4%.2,4–8 To improve clinical development success rates for solid tumors, more physiologically relevant in vitro three-dimensional (3D) models are being deployed at the lead generation stage to select better cancer drug candidates.9–24 Multicellular tumor spheroids (MCTSs) resemble avascular tumor nodules, micrometastases, or the intervascular regions of large solid tumors with respect to morphology, cell–cell and cell–extracellular matrix (ECM) contacts, and volume growth kinetics that develop gradients of nutrient distribution and oxygen concentration that give rise to diverse microenvironments with differential zones of proliferation and drug distribution.9,10,16,20,22,23,25
Head and neck cancers (HNCs) are the eighth leading cause of cancer worldwide, with an estimated 600,000 new cases and 300,000 deaths per annum.26–28 In 2019 it is projected that 53,000 people in the United States will develop oral cavity or pharynx cancer and 10,860 will die of these cancers. Seven drugs are approved for HNC therapy: methotrexate, 5-fluorouracil (5-FU), bleomycin, cisplatin, docetaxel, cetuximab, and pembrolizumab. However, HNC cure rates have hovered at around 50% for >30 years, and patients with advanced, recurrent, or metastatic HNC have median survival rates of 6–12 months.26–31 Only 10%–25% of HNC patients respond to monotherapy with the approved chemotherapeutics or cetuximab, an epidermal growth factor receptor (EGFR) blocking antibody, and they have not improved 5-year survival or cure rates.26,27 Although pembrolizumab (Keytruda) was well tolerated in patients with recurrent or metastatic head and neck squamous cell carcinoma (HNSCC) and produced clinically relevant antitumor activity, only 16% of HNSCC patients responded to Keytruda treatment.32–34 The low response rates and limited efficacy of existing drugs for HNSCC underscores the need to discover new and effective HNC therapies.
We have described the production of HNSCC MCTSs in 384-well U-bottom ultra-low-attachment microtiter plates (ULA-plates) at a scale compatible with HTS cancer drug discovery.9,20,22,25 We developed cell viability and imaging methods to characterize HNSCC MCTS morphologies, viability, and growth phenotypes, and to analyze the effects of anticancer drug exposure.9,20,22,25 The present paper describes the implementation of five HNSCC MCTS cultures with different morphologies and growth phenotypes to screen a set of 19 cancer drugs (
To provide a benchmark for comparison, we also screened the 19 drugs in established 2D monolayer GI assays using the same HNSCC cell lines.35,36 In 95 possible pairwise cancer drug × HNSCC cell line experiments performed using the CellTiter-Blue (CTB) metabolic activity viability reagent, 97.9% of the 2D monolayer cultures exhibited concentration-dependent GI responses compared with only 35.8% of the matching MCTS cultures. Only 24.4% of the pairwise drug × HNSCC cell line combinations reduced MCTS calcein AM (CAM) live-cell staining by ≥50%, whereas 67.8% increased the ethidium homodimer (EHD) dead-cell staining by ≥50%. When MCTS morphology parameters including size, shape, the type of perimeter, and the density or compactness of spheroids were considered, 89.5% of the drug × HNSCC cell line conditions altered more than one morphology attribute. Our results demonstrate that the application of multiple analysis methods is required to accurately determine the impact of cancer drugs on HNSCC MCTS cultures and to maximize the value of these more physiologically relevant tumor cultures.
Materials and Methods
Reagents
Thirty-seven percent formaldehyde was purchased from Sigma-Aldrich (St. Louis, MO). Hoechst 33342 was purchased from Life Technologies (Thermo Fisher Scientific, Waltham, MA). DMSO 99.9% high-performance liquid chromatography grade was obtained from Alfa Aesar (Ward Hill, MA). Dulbecco’s Mg2+- and Ca2+-free phosphate-buffered saline (PBS) was purchased from Gibco (Grand Island, NY). Dulbecco’s modified Eagle’s medium (DMEM) and Dulbecco’s modified Eagle’s medium/Ham’s F12 50/50 (DMEM/F12) was purchased from Corning (Manassas, VA). Fetal bovine serum (FBS),
Anticancer Drug Test Set and Mechanisms of Action
Nineteen FDA-approved cancer drugs were obtained from commercial sources and shipped to the University of Pittsburgh by the National Cancer Institute (NCI) Developmental Therapeutics Program (DTP).37,38
Cells and Tissue Culture
Five human HNSCC cell lines were provided by Dr. Jennifer Grandis of the Head and Neck Cancer Spore at the University of Pittsburgh Medical Center Hillman Cancer Center and were maintained in a humidified incubator at 37 °C, 5% CO2, and 95% humidity: Cal33, FaDu, UM-22B, BICR56, and OSC-19. All cell lines were cultured in DMEM supplemented with 10% FBS, 1%
Generation of HNSCC MCTSs in ULA-Plates
We have previously described the production of MCTSs by seeding HNSCC cell lines into 384-well ULA-plates (cat. 4516; Corning, Tewksbury, MA).9,20,22,25 Briefly, 384-well ULA-plates were rehydrated by the addition of 50 µL of serum-free culture medium to each well and incubated in a humidified incubator for 15 min. Media was removed from the wells of the ULA-plates and 45 μL of a single-cell suspension of the HNSCC cell lines at a seeding density of 2500 cells/well in the appropriate growth medium was transferred into each well using a Matrix automated multichannel pipette (Thermo Fisher Scientific). ULA-plates were centrifuged at 17g for 1 min and then placed in an incubator at 37 °C, 5% CO2, and 95% humidity for the indicated time periods. If HNSCC MCTS cultures were maintained in the ULA-plates beyond 3 days, spent media was exchanged for fresh medium every 3 days using a Janus MDT Mini (PerkinElmer, Waltham, MA) automated liquid handler platform equipped with a 384-well transfer head. Each medium exchange cycle consisted of 2 × 20 µL aspiration and discard steps, followed by 2 × 20 µL fresh media dispense steps. Three media exchange cycles were performed to achieve ~85% exchange of fresh medium for spent medium and a uniform volume of 45 µL/well.
Investigation of HNSCC MCTS Morphology, Viability, and Growth in ULA-Plates by High-Content Imaging
We used the ImageXpress Micro (IXM) automated wide-field high-content imaging platform integrated with MetaXpress Imaging and Analysis software (Molecular Devices LLC, Sunnyvale, CA) to acquire and analyze images of HNSCC MCTSs. The IXM optical drive uses a 300 W Xenon lamp broad-spectrum white light source and a 1.4-megapixel 2/3-inch-chip Cooled CCD Camera and optical train for standard fluorescence imaging and transmitted light (TL) phase-contrast imaging. The IXM is equipped with Zero Pixel Shift (ZPS) filter sets: DAPI, FITC/ALEXA 488, CY3/TRITC, CY5, and Texas Red. Single images of HNSCC MCTSs were sequentially acquired using a 4× Plan Apo 0.20 NA objective in both the TL and fluorescent image acquisition modes; DAPI, FITC, and Texas Red.9,20,22,25,39 To acquire the best focus images of MCTSs, we used the IXM automated image-based focus algorithm to obtain a coarse-focus (large-micrometer steps) set of images of Hoechst stained objects in the DAPI channel for the first MCTS to be imaged, followed by a fine-focus (small-micrometer steps) set of images. In all subsequent wells and channels only a fine-focus set of images were acquired to select the best focus Z plane.9,20,22,25,39 MCTS morphology and growth were assessed daily by the acquisition of 4× TL images on the IXM, and we used the line-scan tool of the MetaXpress image analysis software to measure HNSCC MCTS diameters.25,39
To label viable and/or dead cells within HNSCC 2D monolayer and MCTS cultures, we used the CAM live-cell and EHD dead-cell reagents. The nonfluorescent cell-permeant CAM dye is converted to green fluorescent calcein after acetoxymethyl ester hydrolysis by intracellular esterase enzymes in live cells.9,20,25 The cell-impermeant EHD-1 dye is excluded from live cells but stains the DNA of dead cells.9,20,25 HNSCC 2D monolayer and MCTS cultures were incubated with a cocktail of the Hoechst (8 µg/mL) DNA stain, the CAM (2.5 µM) live reagent, and the EHD (5 µM) dead reagent for 1 h, and single images of HNSCC MCTSs were sequentially acquired on the IXM using a 4× objective in both the TL and fluorescent image acquisition modes: DAPI, FITC, and Texas Red channels. We used the multiwavelength cell scoring (MWCS) image analysis module to analyze HNSCC MCTS fluorescent images as described previously.9,20,22 To create a whole MCTS mask, we set the approximate minimum width of the Hoechst stained nuclei of the MCTS to be 150 µm, with an approximate maximum width of 550 µm, and applied a threshold intensity above the local background of 70. The total MCTS mask from the Hoechst channel was used to count the number of MCTSs per image, typically one. After applying user-defined background average intensity thresholds, typically 50–70 in both the FITC and Texas Red channels, the MWCS module image segmentation then created total MCTS masks in all three fluorescent channels. The derived HNSCC total MCTS masks were used to quantify the mean integrated fluorescence intensity (MIFI) of the CAM live-cell signal in the FITC channel and the EHD dead-cell signal in the Texas Red channel. MIFI values represent the total pixel fluorescent intensities in channel 1, 2, or 3 within MCTS masks of positively stained MCTSs above preset background thresholds.
Analysis of HNSCC 2D Monolayer and MCTS Culture Viability and GI Using the CTB Reagent
The homogeneous CTB cell viability reagent provides a fluorescent method for monitoring cell viability and/or GI that is based on the ability of living cells to convert the redox dye resazurin into a fluorescent end-product resorufin. 2D monolayer HNSCC GI assays were performed as described previously, save that CTB was used instead of CellTiter-Glo (CTG) as the detection reagent.35,36 Each of the five HNSCC cell lines was harvested, counted, and seeded into 384-well assay plates at 500 cells/well in 45 µL of tissue culture media and cultured overnight at 37 °C, 5% CO2, and 95% humidity. On the next day, 5 µL of test compounds at the indicated concentrations or plate controls diluted in SFM was transferred to assay plates on the Janus MDT Mini liquid handler equipped with a 384-well transfer head, and assay plates were then cultured for an additional 72 h in an incubator at 37 °C, 5% CO2, and 95% humidity. Maximum control wells (max controls, n = 32) received 5 µL of DMSO (0.25% DMSO final) and minimum control wells (min controls, n = 32) received 200 μM doxorubicin plus 0.25% DMSO. After the 72 h compound exposure period, 10 μL of the CTB cell viability detection reagent was dispensed into the wells of HNSCC assay plates and incubated for 4 h at 37 °C, 5% CO2, and 95% humidity before capturing the relative fluorescent unit (RFU) signals (excitation 560 nm/emission 590 nm) on a SpectraMax M5e (Molecular Devices, LLC, Sunnyvale, CA) microiter plate reader platform.
For MCTS GI assays HNSCC cell lines were seeded at 2500 cells/well into 384-well ULA-plates in 45 μL of growth medium incubated at 37 °C, 5% CO2, and 95% humidity for 3 days. 25 After 3 days, spent media was exchanged for fresh media as described above and test compounds at the indicted concentrations were transferred to the wells using a Janus MDT Mini platform equipped with a 384-well transfer head, and the plates were returned to the incubator for an additional 72 h. Maximum and minimum control wells received 0.25% DMSO and 200 μM doxorubicin plus 0.25% DMSO, respectively. After the 72 h compound exposure period, 10 μL of the CTB cell viability detection reagent was dispensed into the wells of HNSCC MCTS assay plates and incubated for 4 h at 37 °C, 5% CO2, and 95% humidity before capturing RFU signals (excitation 560 nm/emission 590 nm) on a SpectraMax M5e microtiter plate reader platform.
Data Processing, Analysis, and Curve Fitting
For HNSCC 2D monolayer and MCTS GI (GI50) assays, the mean maximum DMSO control wells (max controls, n = 32) and 200 μM doxorubicin mean minimum plate control wells (min controls, n = 32) were used to normalize the data from compound-treated wells and to represent uninhibited growth and 100% cytotoxicity, respectively. The GI50 data were fit to a nonlinear sigmoidal log (inhibitor) versus normalized response variable slope model using the following equation: Y = 100/(1 + 10^((LogIC50 – X)*Hillslope)), where Y is the percent GI and X is the corresponding log10 of the compound concentration. GI50 is the concentration of compound that gives a 50% response, halfway between 0% and 100%. Hillslope describes the steepness of the curve. All curve fitting, linear regression analysis, and graphs were created using the GraphPad Prism 6 software.
Drug Impact Scoring
To facilitate the analysis of the effects of cancer drugs on HNSCC cultures, we used a drug impact score to summarize our observations for each of the readouts that we acquired: HNSCC GI, MCTS live/dead staining, and MCTS morphology. If a drug produced a calculable GI50 in CTB GI assays, it scored 1; if it failed to produce a calculable GI50 but exhibited a concentration-dependent GI response and achieved ≥25% GI, it scored 0.5; and it received a score of 0 if it achieved neither of these attributes. In MCTS HNSCC cultures stained with the CAM live reagent, if the maximum concentration of the drug reduced the CAM MIFI by ≥50% relative to DMSO controls, it scored 1; if it reduced the CAM MIFI by ≥20% but <50%, it scored 0.5; and if it reduced the CAM MIFI by <20%, it scored 0. In MCTS HNSCC cultures stained with the EHD dead reagent, if the maximum concentration of the drug increased the EHD MIFI by ≥50% relative to DMSO controls, it scored 1; if it increased the EHD MIFI by ≥20% but <50%, it scored 0.5; and if it increased the EHD MIFI by <20%, it scored 0. We analyzed the effects of drugs on three MCTS morphology readouts: MCTS perimeters and shape, MCTS density or compactness, and MCTS size indicated by diameter measurements. If a drug altered ≥2 of the 3 morphology readouts, it scored 1; if it only altered 1 readout, it scored 0.5; and if it did not change any of the 3 readouts, it scored 0. The maximum cumulative MCTS drug impact score for an individual HNSCC cell line was 4, and 20 across all five HNSCC cell lines.
Results
Cancer Drug Induced GI in 2D Monolayer and MCTS HNSCC Cultures
We used the CTB metabolic activity reagent to monitor MCTS cell viability, growth, and drug-induced GI.
25
In 2D HNSCC monolayer GI assays run for comparison, cell lines were seeded at 500 cells/well in 384-well flat-bottom tissue culture-treated plates and cultured overnight before 72 h compound exposure.35,36 HNSCC cell lines cultured in 2D monolayers exhibited exponential growth rates (r2 > 0.93), and their doubling times provided the following rank order of growth: Cal33 (33.6 h) = UM-22B (35.5 h) = FaDu (37.4 h) < BIRC56 (39.5 h) << OSC-19 (61.8 h) (
Figure 1
shows representative GI50 curves produced in 2D monolayer and MCTS cultures exposed to the approved HNC drugs: 5-FU, methotrexate, bleomycin, docetaxel, and cisplatin. In 2D monolayer cultures, cisplatin, docetaxel, and 5-FU exhibited complete concentration–response curves (two asymptotes) with good-quality curve fits (r2 > 0.95), efficacies >80%, and calculable GI50 values (

2D monolayer and MCTS CTB GI curves for FDA-approved HNSCC drugs. For 2D monolayer cultures, the five HNSCC cell lines were seeded into 384-well assay plates and cultured for 24 h before they were exposed to the indicated concentrations of cisplatin, docetaxel, 5-FU, bleomycin, or methotrexate for 72 h prior to the addition of the CTB and measurement of the RFU signals. For MCTS cultures, the five HNSCC cell lines were seeded in 384-well ULA-plates, and after 3 days in culture, the MCTSs were exposed to the indicated concentrations of the drugs for 72 h prior to the addition of CTB and measurement of the RFU signals. The mean maximum (0.5% DMSO) and minimum (200 µM doxorubicin + 0.5% DMSO) plate control CTB RFUs were used to normalize the RFU data from the compound treated wells as percent inhibition of growth and the GI50 data were fitted to a nonlinear sigmoidal log inhibitor concentration versus the normalized response variable slope model using the GraphPad Prism 6 software. The normalized mean ± SD (n = 3) GI data from triplicate wells for each compound concentration are presented. The data and curve fits for 2D monolayer () and MCTS ( ) cultures are indicated in blue and red, respectively. Representative experimental data from one of three or four independent experiments are shown.
HNSCC 2D Monolayer and MCTS Culture GI50 Determinations.
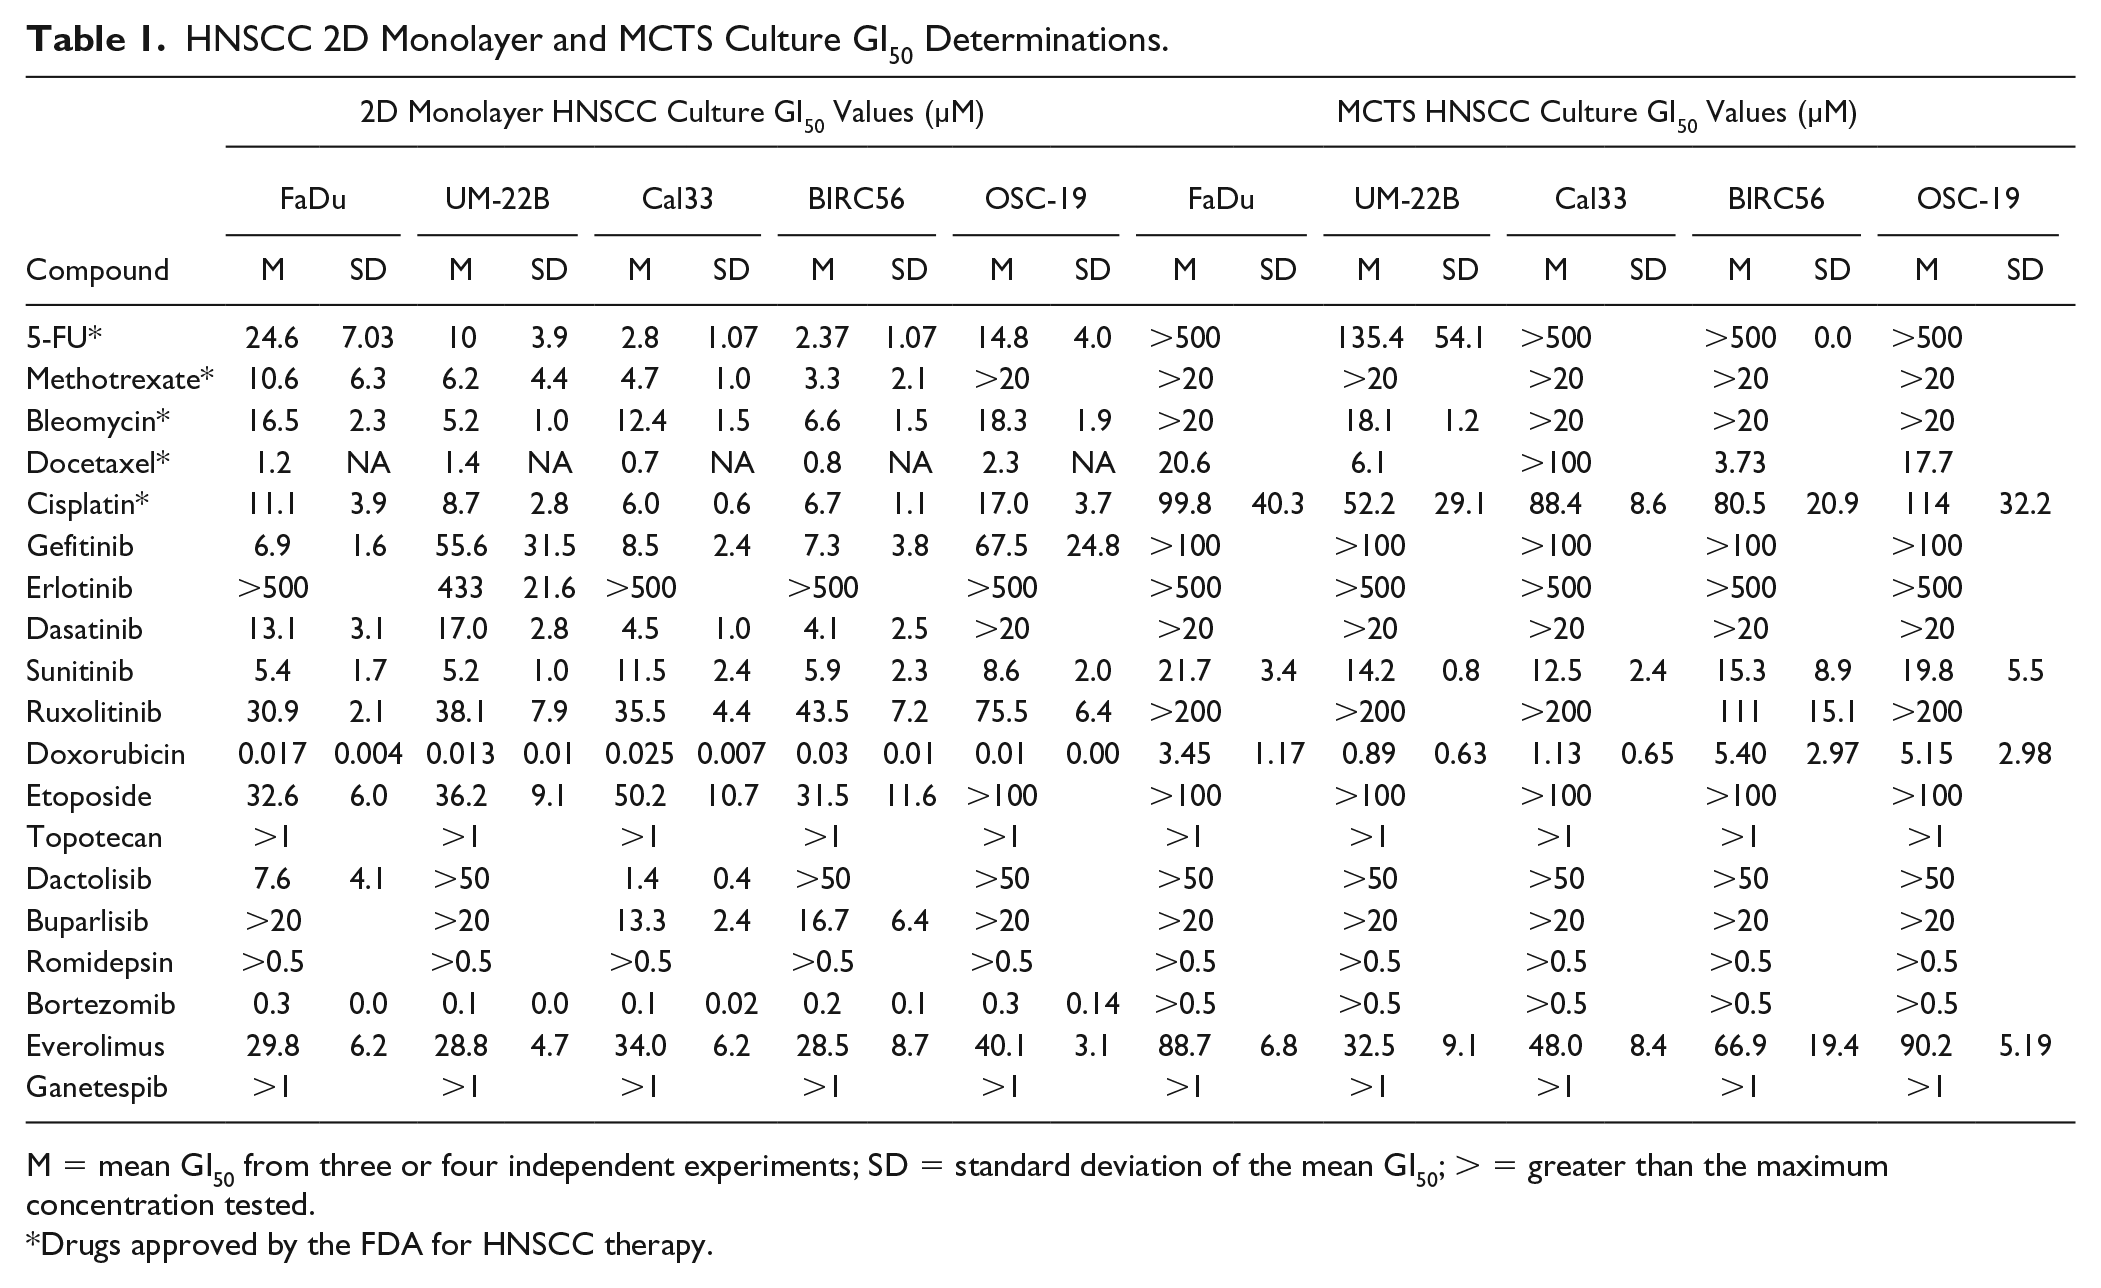
M = mean GI50 from three or four independent experiments; SD = standard deviation of the mean GI50; > = greater than the maximum concentration tested.
Drugs approved by the FDA for HNSCC therapy.
Table 1
summarizes the CTB assay GI50 values for the 19 test drugs in 2D monolayer and MCTS HNSCC cultures assayed at the top starting concentrations listed in
Cancer Drug Effects on HNSCC MCTS Cell Viability and/or Death

Live/dead staining of HNSCC MCTS cultures exposed to DMSO or HNSCC approved drugs. () and EHD ( ) staining in HNSCC MCTS DMSO controls. The MIFI CAM () and EHD () signals of HNSCC MCTSs exposed to the top concentration of the HNSCC approved drugs were normalized and expressed as percent of DMSO controls for (
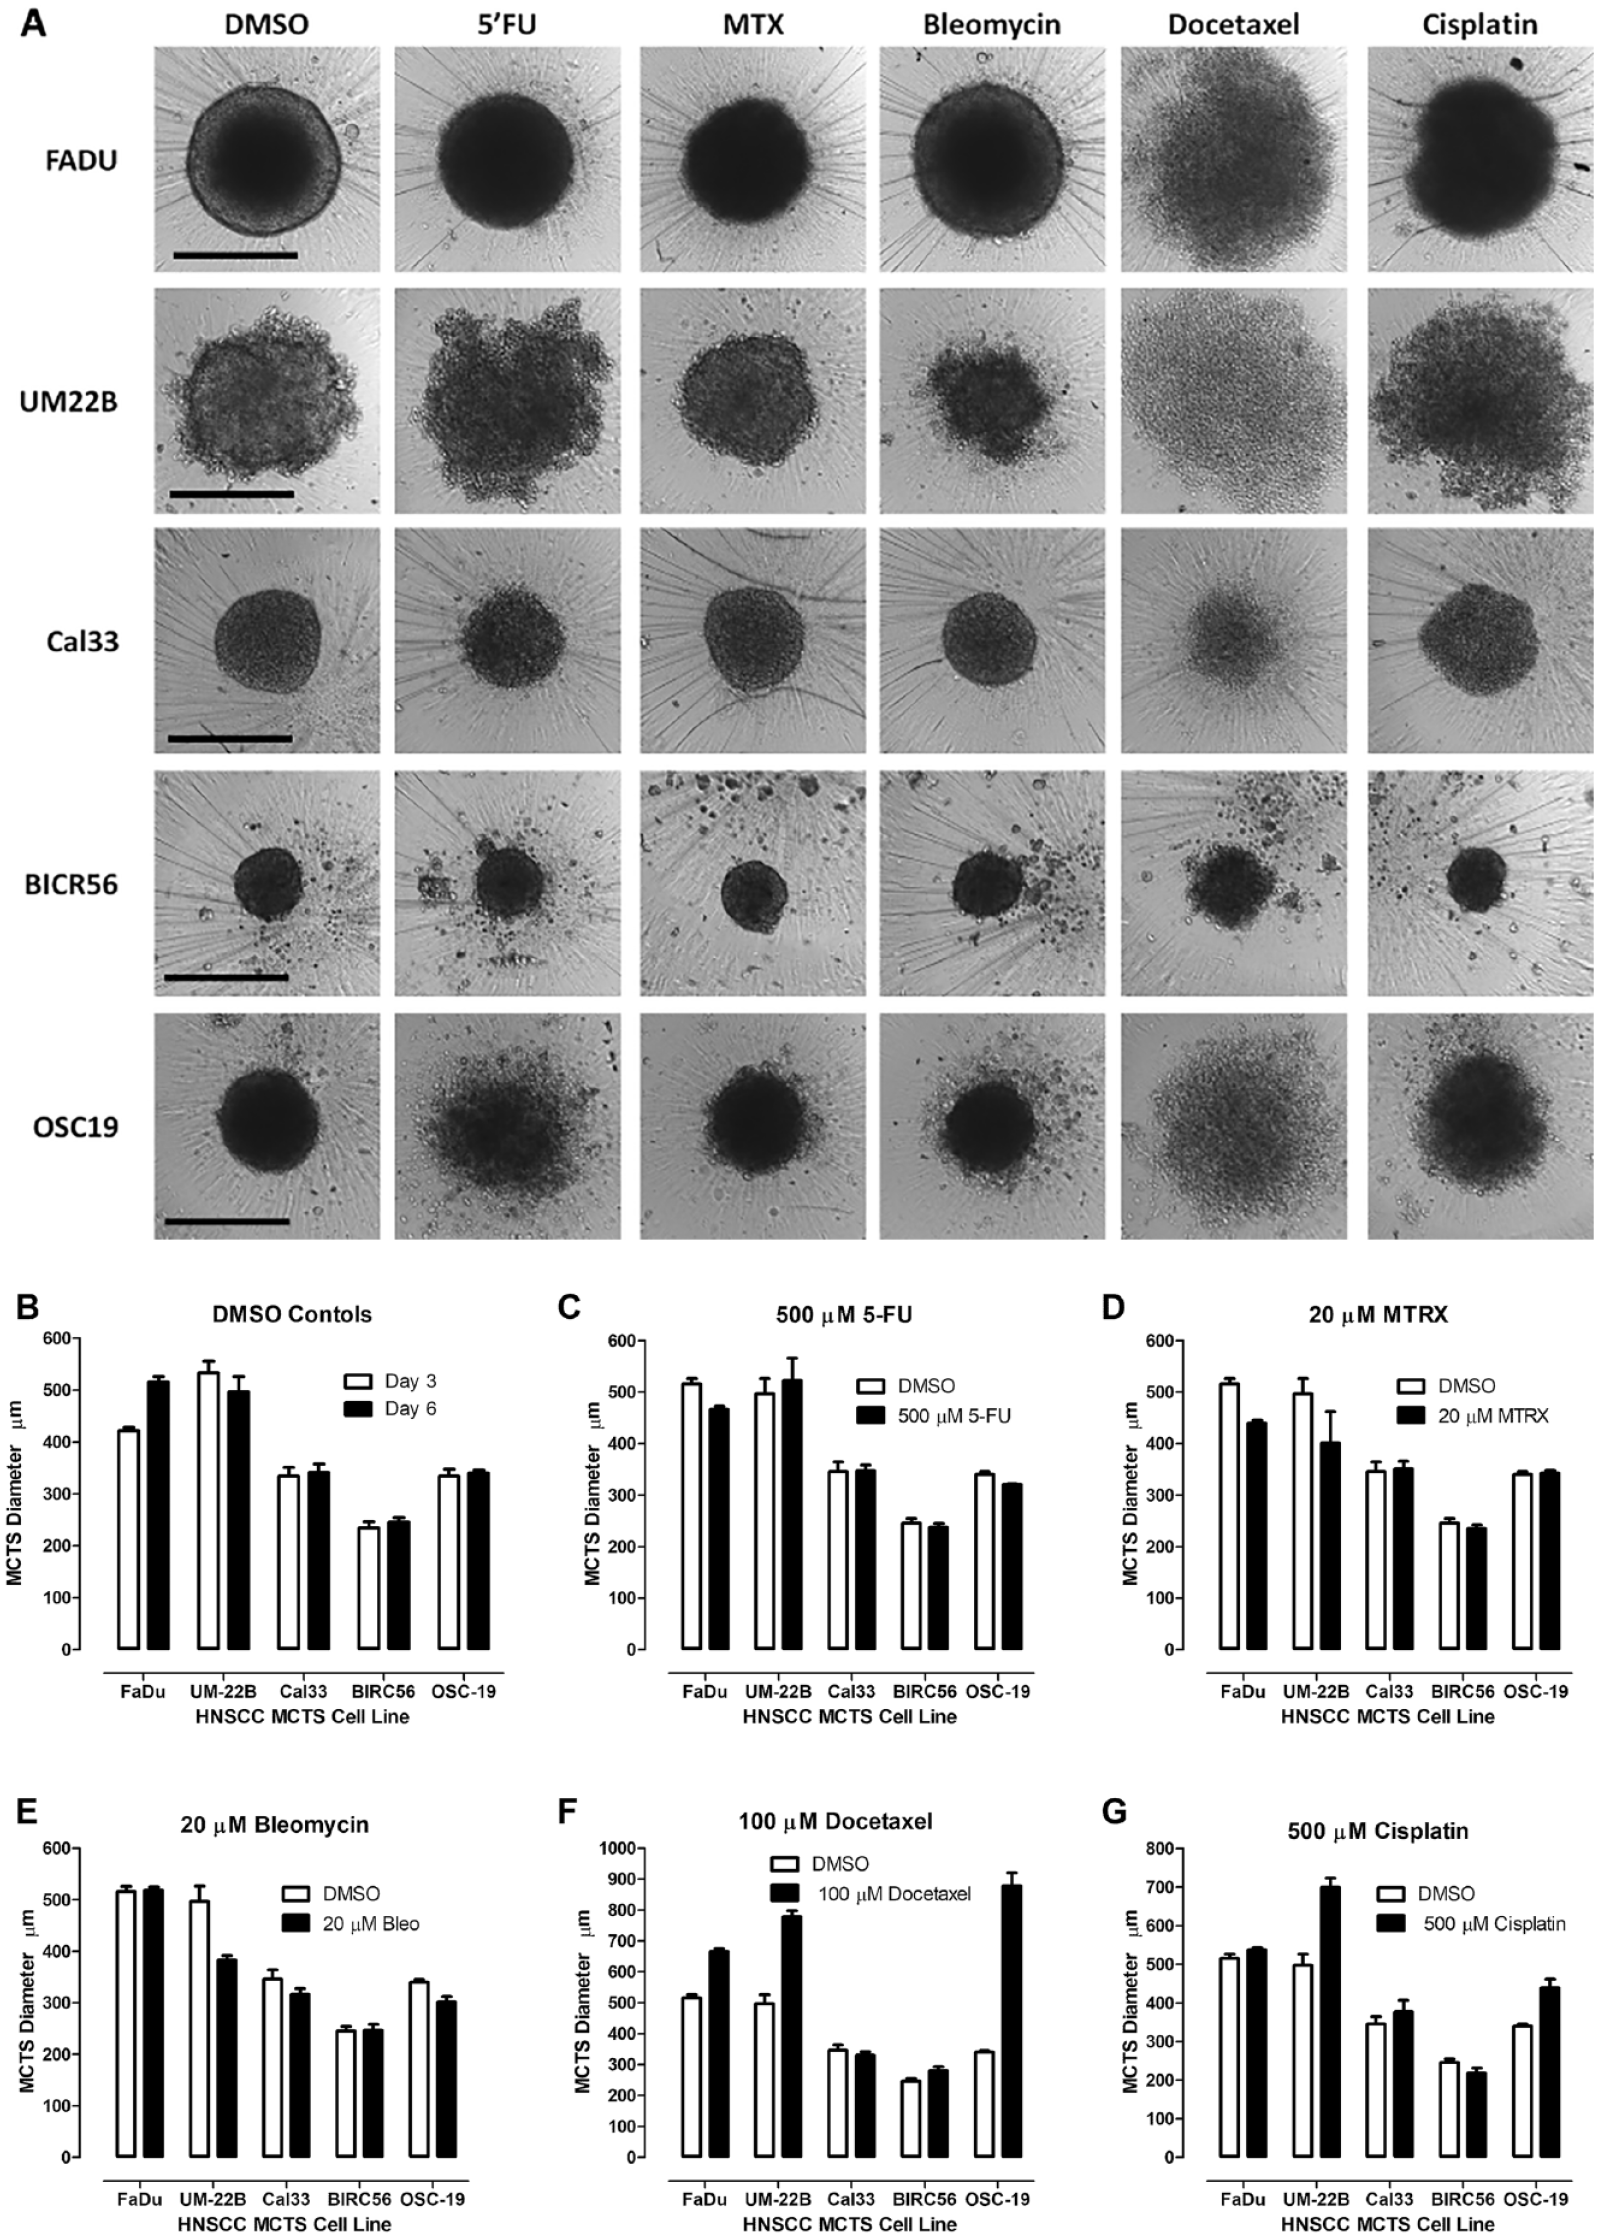
Morphologies of HNSCC MCTS cultures exposed to DMSO or HNSCC approved drugs. (
Cancer Drug Effects on HNSCC MCTS Morphologies
To evaluate the effects of drug exposure on MCTS morphology, we acquired TL images and qualitatively compared the perimeters, shapes, and compactness of DMSO controls to treated MCTSs, and measured spheroid or aggregate diameters using the line-scan tool of the MetaXpress image analysis software.
Effects of Exposure to Sunitinib and Everolimus on HNSCC MCTS Cultures
Impact of sunitinib and everolimus exposure on HNSCC MCTS cultures: TL (grayscale), Hoechst (blue), CAM (green), EHD (red), and live/dead composite images of HNSCC MCTS cultures exposed to DMSO or the top concentrations of () and MCTS () HNSCC cultures exposed to the indicated concentrations of () and EHD () signals of HNSCC MCTSs exposed to the top concentration of (
Effects of Exposure to 5-FU and Etoposide on Cal33 HNSCC Cultures
Figure 5
summarizes the effects of 72 h exposure to 500 µM 5-FU or 100 µM etoposide on Cal33 2D monolayer and MCTS cultures.
Figure 5A
shows TL, Hoechst, CAM, and EHD images of Cal33 monolayers and MCTS cultures exposed to DMSO or to 18.5 or 500 µM 5-FU. Cal33 monolayers exposed to 18.5 µM 5-FU contained much fewer cells, Hoechst stained nuclei, and CAM-positive cells than DMSO controls. Even with fewer cells, the number of EDH-positive cells in Cal33 monolayers treated with 18.5 µM 5-FU increased. In contrast, images of Cal33 MCTSs treated with 18.5 µM 5-FU were not noticeably different from DMSO controls. At 500 µM 5-FU, however, Cal33 MCTS morphology was changed and EHD staining was substantially higher. In 2D Cal33 monolayers, 5-FU produced complete CTB concentration–response curves with good-quality curve fits and a mean GI50 of 2.8 ± 1.07 µM (
Impact of 5-FU and etoposide exposure on Cal33 HNSCC 2D monolayer and MCTS cultures: TL (grayscale), Hoechst (blue), CAM (green), EHD (red), and live/dead composite images of 2D monolayer and MCTS HNSCC cultures exposed to DMSO or the top concentrations of () and MCTS () HNSCC cultures exposed to the indicated concentrations of () and EHD () signals of HNSCC MCTSs exposed to the top concentration of (
HNSCC MCTS Drug Impact Scores
We wanted to explore whether a consolidated drug impact score that incorporated all these parameters might be a better indicator of cancer drug responses in HNSCC MCTS cultures. CTB GI drug impact scores for the 19 test drugs in both culture formats are presented in
The cumulative HNSCC MCTS drug impact scores for the 19 drugs are presented in
Table 2
. Doxorubicin attained a perfect cumulative drug impact score of 20, consistent with its ability to disrupt and effectively kill all five HNSCC MCTS cultures.22,25 None of the drugs achieved an MCTS drug impact score of 0, indicating that they all produced measurable responses in at least some of the cultures. Even the 9 (47.4%) cancer drugs that failed to display evidence of concentration-dependent CTB GI against any of the 5 HNSCC MCTS cultures (
Cumulative HNSCC MCTS Drug Impact Scores.
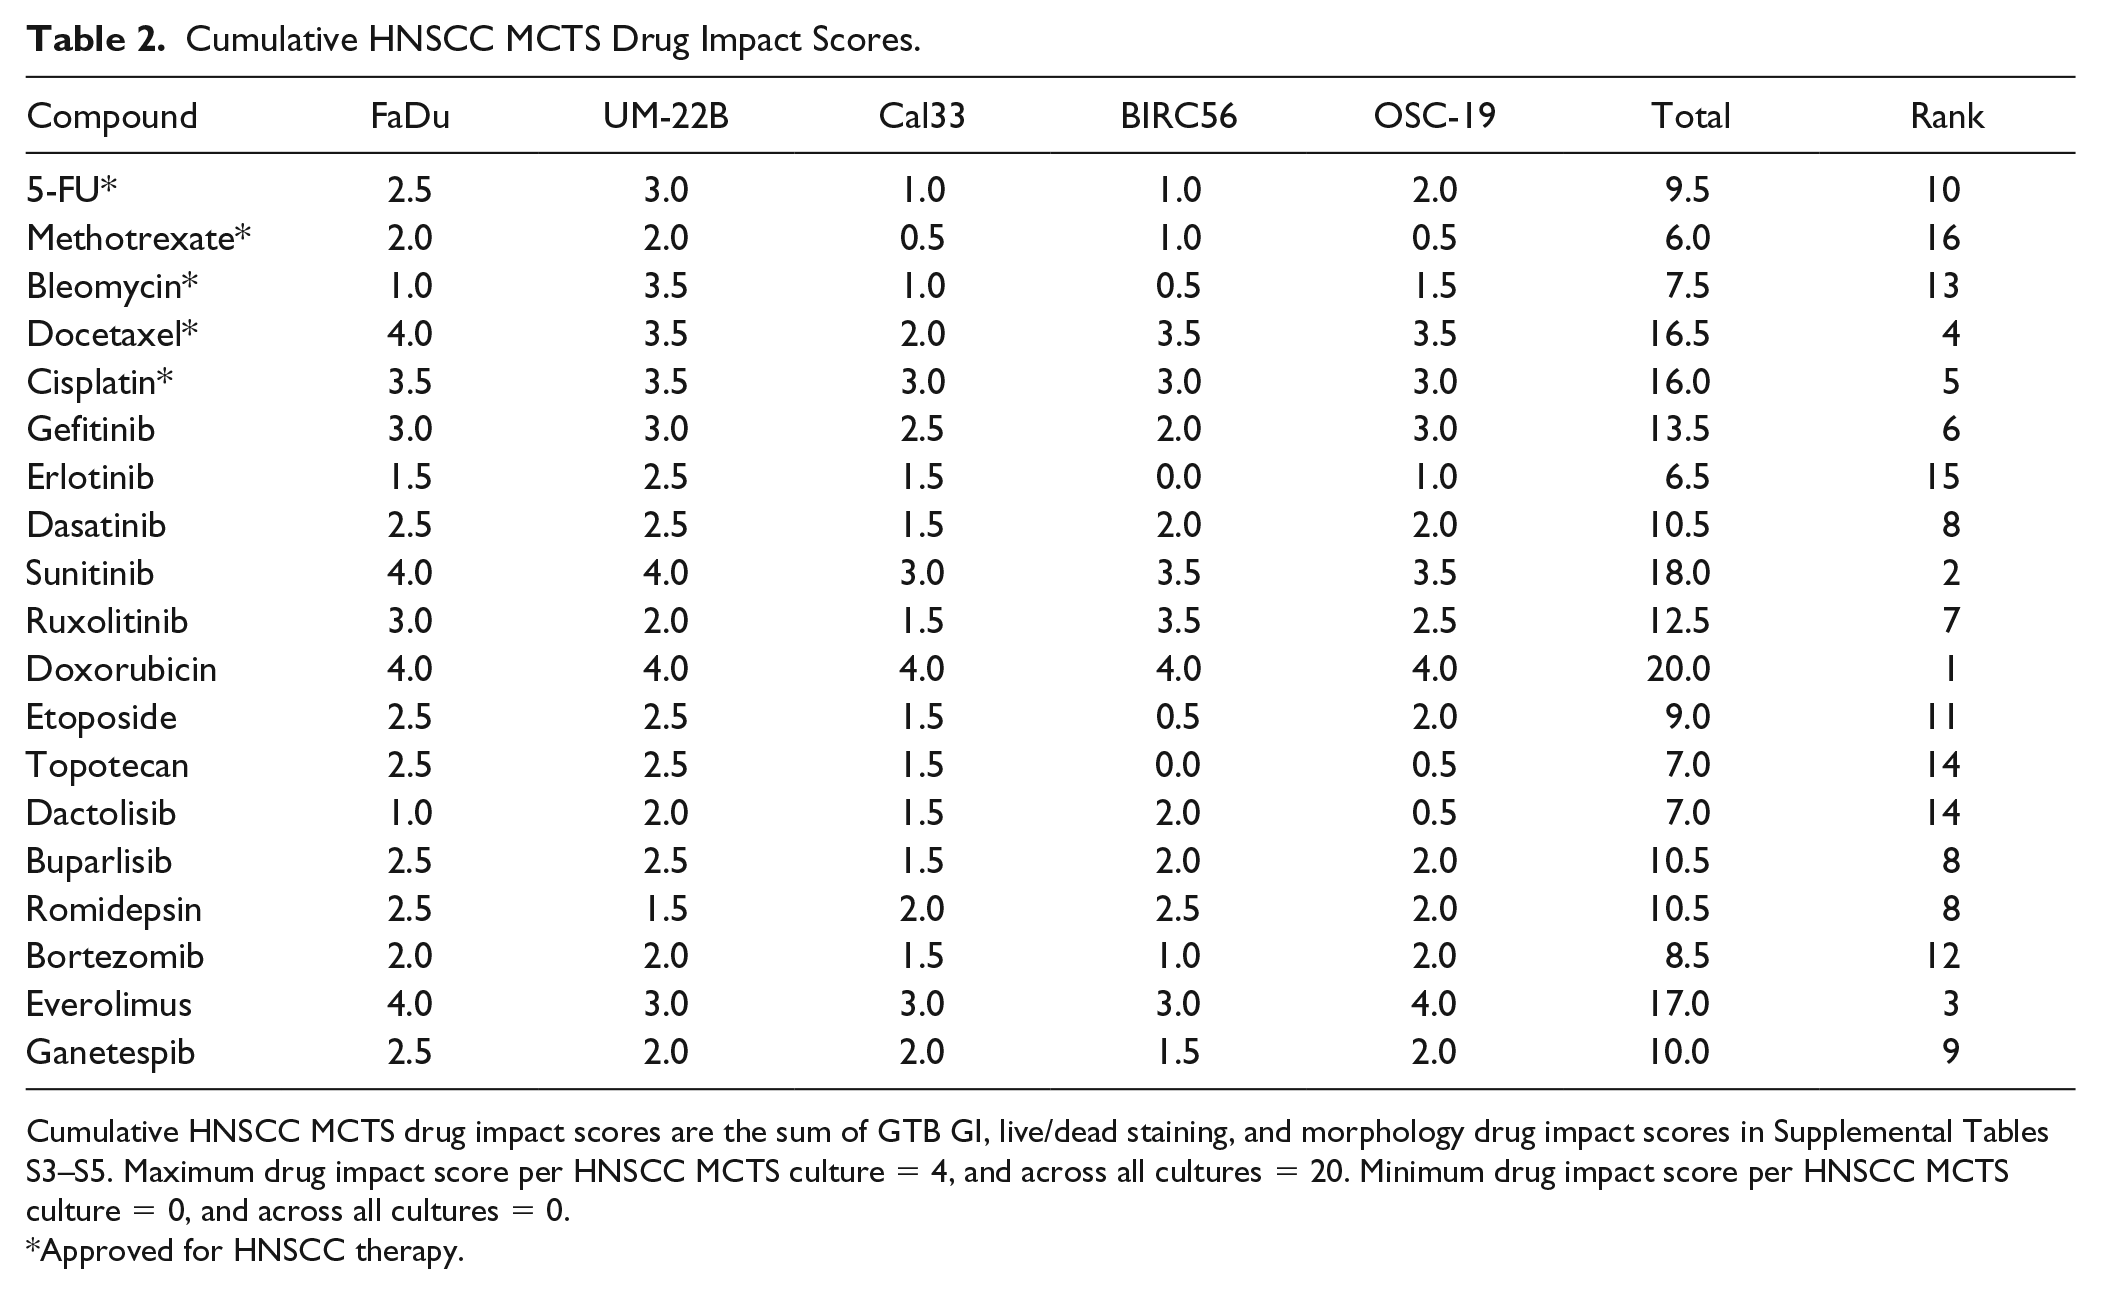
Cumulative HNSCC MCTS drug impact scores are the sum of GTB GI, live/dead staining, and morphology drug impact scores in Supplemental Tables S3–S5. Maximum drug impact score per HNSCC MCTS culture = 4, and across all cultures = 20. Minimum drug impact score per HNSCC MCTS culture = 0, and across all cultures = 0.
Approved for HNSCC therapy.
Discussion
We investigated the use of HNSCC MCTS cultures to screen for cancer drug leads that could be developed into candidates with a better probability of success in in vivo animal models and patients. The five HNSCC cell lines selected form xenografts in immunodeficient mice, have genetic profiles similar to those of patient tumors, and have been used for HNSCC drug discovery.30,35,36 These HNSCC cell lines produce MCTS cultures with distinct morphologies, sizes, and growth phenotypes (
Cellular metabolic pathways convert components of viability reagents into forms that produce easily detectable increases in absorbance or fluorescence, or they generate ATP that promotes the luminescence signal of added luciferase. Larger signals correlate with increased cell numbers that are used as surrogate measurements of proliferation- and/or drug-induced GI in 2D and 3D cultures. We used CTB for these studies because the RFUs produced by the same number of cells in 2D and 3D HNSCC cultures were comparable, whereas the relative light units (RLUs) produced by the CTG ATP detection reagent were ~10-fold lower in 3D than in 2D cultures.
25
In 2D monolayer HNSCC cultures, 71.6% of the 95 drug–tumor cell line pairwise combinations produced GI50 values and 97.9% exhibited concentration-dependent GI (
Tumor cell lines adapted to long-term 2D culture conditions proliferate faster than cells isolated from primary tumors, tend to underrepresent self- and population-renewing tumor stem cells that contribute to recurrence and metastasis, and display enhanced sensitivity to antiproliferative agents.10,12,13,22,40,41 In regions of MCTSs with reduced nutrient and/or oxygen concentrations, dormant or quiescent tumor cells that have either stopped replicating or are replicating slowly display resistance to molecules targeting cell proliferation mechanisms.48–50 Only the cells in the outer layers of FaDu and UM-22B MCTSs contained actively proliferating cells detectable by 5-ethynyl-2′-deoxyuridine (EdU) incorporation.
25
Based on Ki-67 staining, the proliferation rates of eight of nine HNSCC MCTS cultures formed in 96-well ULA-plates declined substantially compared with their matching 2D cultures.
51
The 2D monolayer HNSCC cultures used in these studies were proliferating exponentially throughout the 96 h culture period and underwent >2 but <3 doublings (
Cells in solid tumors and MCTSs experience adhesive, topographical, and mechanical cues that alter their underlying biology and responses to stimuli.10–14,19–26 Tumor cell packing densities and adhesion junctions between adjacent cells and with the ECM constitute permeability barriers that can restrict cancer drug penetration, distribution, and efficacy.48–50,52–54 Drug physiochemical properties also affect tissue distribution, and cells that are distal to blood vessels in solid tumors experience lower concentrations due to limited drug penetration.50,52,53 Reduced drug penetration in solid tumors contributes to the resistance toward several chemotherapeutic agents, including doxorubicin, epirubicin, daunorubicin, mitoxantrone, methotrexate, 5-FU, vinblastine, paclitaxel, and docetaxel.27–29,44–54 Three breast cancer cell lines that formed dense MCTSs showed greater resistance to paclitaxel and doxorubicin than cell lines that formed loose MCTSs or their matching 2D cultures.
43
The UM-22B cell line produced the least densely packed HNSCC MCTS cultures and was the most sensitive to drug-induced GI, with 7 of the 19 drugs producing GI50 values, while only 4 drugs produced GI50 values in the more densely packed Cal33 MCTSs (
Table 1
). Ellipticine, idarubicin, daunorubicin, and doxorubicin accumulation in 2D monolayer and MCTS HNSCC cultures increases linearly with respect to drug concentration.
22
2D monolayers accumulate uniform drug levels independent of cell number and/or cell seeding density.
22
In MCTS cultures, however, drug accumulation increases as cell numbers and MCTS sizes become larger.
22
Initially, drugs accumulate preferentially in cells in the outer layers of HNSCC MCTSs compared with those in the inner cores.22,25 Doxorubicin and other anthracycline drugs may become sequestered in the peripheral layers of MCTSs and solid tumors because they are trapped in acidic compartments such as endosomes or lysosomes, or because they bind so avidly to DNA.49,50,55,56 Similarly, paclitaxel binding to tubulin may lead to its sequestration in the peripheral layers of MCTSs and human solid tumor histocultures.
57
After 24 h of drug exposure, however, drugs penetrated throughout HNSCC MCTSs that were smaller than DMSO controls and displayed other changes in morphology; outer cell layers were either missing, smaller, or disintegrating, and inner core regions were darker.22,25 Cal33 MCTSs were 6-, 20-, 10-, and 16-fold more resistant than 2D monolayers to GI by ellipticine, idarubicin, daunorubicin, and doxorubicin, respectively.
22
Drug-induced cell death of peripheral cell layers is a major determinant of solid tumor drug penetration.22,25,49,52,53,57–59 In our studies, FaDU, UM-22B, Cal33, BIRC56, and OSC-19 MCTS cultures were 199-, 67-, 44-, 213-, and 366-fold more resistant than 2D monolayers to GI by doxorubicin. MCTS cultures were 9-, 6-, 15-, 12-, and 7-fold more resistant than 2D monolayers to cisplatin. FaDU, UM-22B, BIRC56, and OSC-19 MCTS cultures were 18-, 4-, 5-, and 7.5-fold more resistant than 2D monolayers to docetaxel. On average, MCTS HNSCC cultures were 2.5- and 2-fold more resistant than 2D monolayers to sunitinib and everolimus, respectively. Reduced drug penetration and distribution in HNSCC MCTS cultures may also be contributing to the increased resistance of some drugs versus 2D monolayer cultures (
CAM live- and EHD dead-cell staining in conjunction with fluorescence imaging and image analysis have been used to evaluate and characterize MCTS cell viability, growth, and the consequences of cancer drug exposure.9,20,21,25,45,60 In HNSCC MCTS cultures exposed to the maximum concentrations of the test drugs, only 24.4% of the 95 drug–cell line pairwise combinations reduced CAM MIFI values by ≥50% (
Spheroid integrity and volume growth kinetics can be rapidly and easily visualized by noninvasive phase-contrast and/or bright-field imaging, and both have been used to monitor the effects of cancer drug exposure.9,10,12,20–23,25,41,43,44,51,60 We used TL images to characterize the distinct morphologies and growth of the five HNSCC MCTS cultures.9,22,25 HNSCC develops in the paranasal sinuses, nasal cavity, oral cavity, pharynx, larynx, salivary gland, and thyroid, and histology, molecular characteristics, and clinical outcomes vary widely across different anatomical sites.28,61–63 Cal33 and BICR56 HNSCC cell lines were established from oral cavity tumors, the OSC-19 cell line was established from a tumor in the tongue that had metastasized to a cervical lymph node, and the FaDu and UM-22B cell lines were established from hypopharynx tumors.
30
The different HNSCC MCTS morphologies displayed here (
Our studies demonstrate that CTB and CAM viability parameters were the least sensitive indicators of MCTS drug responses and that relying solely on cell viability measurements can seriously underestimate the impact of cancer drug exposure on HNSCC MCTS cultures. Incorporating changes in MCTS morphology and increased EHD dead-cell staining into the analysis more than doubled the number of drugs that were considered to have caused substantial changes in MCTS cultures. The cumulative drug impact score allowed us to stratify MCTS test drug responses into high-, intermediate-, and low-impact tiers (
Supplemental Material
Kochanek_et_al_Suppl_Information_DISC-19-0098_Revised – Supplemental material for Maximizing the Value of Cancer Drug Screening in Multicellular Tumor Spheroid Cultures: A Case Study in Five Head and Neck Squamous Cell Carcinoma Cell Lines
Supplemental material, Kochanek_et_al_Suppl_Information_DISC-19-0098_Revised for Maximizing the Value of Cancer Drug Screening in Multicellular Tumor Spheroid Cultures: A Case Study in Five Head and Neck Squamous Cell Carcinoma Cell Lines by Stanton J. Kochanek, David A. Close, Daniel P. Camarco and Paul A. Johnston in SLAS Discovery
Footnotes
Supplemental material is available online with this article.
Declaration of Conflicting Interests
The authors declared no potential conflicts of interest with respect to the research, authorship, and/or publication of this article.
Funding
The authors disclosed receipt of the following financial support for the research, authorship, and/or publication of this article: The studies were supported in part by a Development Research Project award (Johnston, PI) from the Head and Neck Cancer Spore P50 (Ferris and Grandis, CA097190) of the University of Pittsburgh Medical Center Hillman Cancer Center.
References
Supplementary Material
Please find the following supplemental material available below.
For Open Access articles published under a Creative Commons License, all supplemental material carries the same license as the article it is associated with.
For non-Open Access articles published, all supplemental material carries a non-exclusive license, and permission requests for re-use of supplemental material or any part of supplemental material shall be sent directly to the copyright owner as specified in the copyright notice associated with the article.