
Abstract
The effective analysis and interpretation of high-content screening (HCS) data requires joining results to information on experimental treatments and controls, normalizing data, and selecting hits or fitting concentration-response curves. HCS data have unique requirements that are not supported by traditional high-throughput screening databases, including the ability to designate separate positive and negative controls for different measurements in multiplexed assays; the ability to capture information on the cell lines, fluorescent reagents, and treatments in each assay; the ability to store and use individual-cell and image data; and the ability to support HCS readers and software from multiple vendors along with third-party image analysis tools. To address these requirements, the authors developed an enterprise system for the storage and processing of HCS images and results. This system, HCS Road, supports target identification, lead discovery, lead evaluation, and lead profiling activities. A dedicated client supports experimental design, data review, and core analyses and displays images together with results for assay development, hit assessment, and troubleshooting. Data can be exported to third-party applications for further analysis and exploration. HCS Road provides a single source for high-content results across the organization, regardless of the group or instrument that produced them.
Keywords
Introduction
H
HCS data can be divided into 3 types: image data, derived data (e.g., single-cell measurements and well-level summary statistics), and metadata. 4 This last data type includes both procedural information (e.g., how the images were acquired and analyzed) and experimental annotation (e.g., what cell lines, fluorescent probes, and treatments were used). Procedural metadata are captured by most HCS platforms and by open-source projects such as the Open Microscopy Environment (OME). 5,6 Experimental annotation metadata are less well supported, even though they are essential for the interpretation and analysis of HCS results. The Minimum Information About a Cellular Assay (MIACA) standard established guidelines for what experimental annotation should be included in scientific publications 7 but is not intended for laboratory data management.
HCS data share many requirements with other types of high-throughput screening (HTS) data, especially from cell-based assays. In particular, the need to capture assay design information in a structured and consistent manner is essential for the analysis and reporting of experimental results. 8 Other essential components include a reagent registry (for compounds, RNAi reagents, and other reagent types), a reagent inventory database (with information on plate maps), and tools for hit selection and concentration-response analysis. 9
Despite the parallels to HTS data, managing and analyzing HCS data presents distinct challenges not encountered with other assay platforms, including single-endpoint cell-based assays. First, HCS is image based. Access to the underlying images is essential to troubleshoot problems, confirm and understand results, and communicate results to colleagues. Second, HCS produces large amounts of data. For example, a single 384-well plate can produce over 2 GB of images and millions of records of derived data 4 ; this scale of data requires support from information technology experts along with mechanisms to systematically identify and delete unneeded data. Third, HCS assays often multiplex several distinct biological readouts in the same well. This requires the ability to designate separate positive and negative controls for different channels or even measurements so that assay performance and result normalization can generate meaningful values. Fourth, multiple vendors produce HCS readers and image analysis packages, along with third-party analysis packages such as CellProfiler. 10 Results and images must be converted to a common format so data and analysis tools can be shared between groups. Finally, HCS assays are inherently cell based. Consistent identification of the cell lines, fluorescent dyes or antibody conjugates, and fluorescent proteins used in each assay is essential for the proper documentation and long-term mining of HCS results.
To address these requirements, we developed HCS Road, a data management system specifically designed for HCS. As the name indicates, HCS Road provides a smooth, well-defined route from image quantification to data analysis and reporting. The system combines an experiment definition tool, a relational database for results storage, assay performance reports, data normalization, and analysis capabilities. HCS Road currently supports multiple imaging platforms and provides a common repository for HCS data across instruments and user groups. In this work, we describe the approaches we took for data storage, experimental annotation, and data analysis and the scientific and business reasons for those decisions. We also present a XML schema for HCS data that supports multiple HCS platforms.
Methods
Image acquisition and analysis
Images were acquired using multiple HCS instrument types and analyzed using software supplied by the individual instrument manufacturers. HCS Road currently supports 3 instrument types and software: the Cellomics ArrayScan and vHCS Scan application (Thermo Scientific Cellomics, Pittsburgh, PA), the InCell 1000 and InCell Investigator application (GE Healthcare Life Sciences, Piscataway, NJ), and the Evotec Opera and Acapella application (PerkinElmer Life and Analytical Sciences, Waltham, MA).
Databases and software
Databases were implemented using Oracle 11g (Oracle Corporation, Redwood Shores, CA). The database is hosted on a dedicated server with 4 IA64 CPUs and 24 MB RAM. The HCS Road Data Explorer client was developed using VB.NET, and the Data Import client was developed using VB.NET and ASP.NET. Both clients run on Microsoft Windows XP. The clients interact with the Road database using Web services implemented in VB.NET and ASP.Net and Oracle PL-SQL stored procedures. Image conversion services were implemented using LeadTools Raster Imaging Pro 15 (Lead Technologies, Inc., Charlotte, NC) and Image Magick 6.4.4 (Image Magick Studio, LLC; www.imagemagick.org). Concentration-response curve fitting was performed using XLfit equation 205 within MathIQ (IDBS Business Solutions, Guilford, UK).
Results and Discussion
System architecture
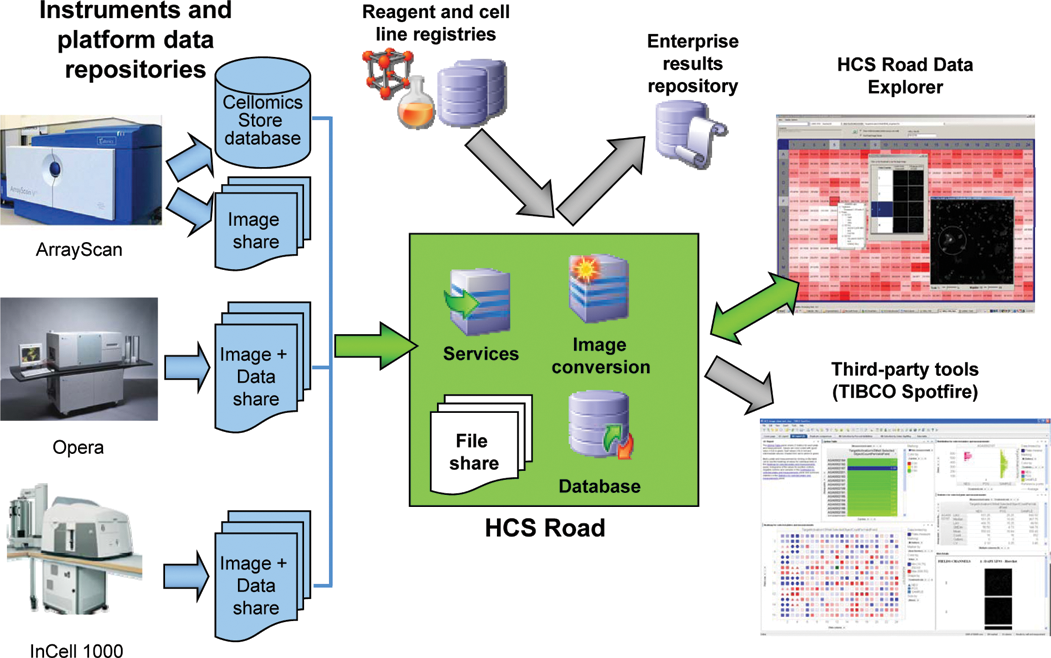
Overview of HCS Road components showing data flow from high-content screening (HCS) instruments through the HCS Road database and file share to data analysis and visualization tools. Blue icons designate instrument-specific databases and file shares. Green arrows and the green box indicate HCS Road components. Gray arrows indicate data import or export to existing enterprise databases or third-party analysis tools.
Users interact with HCS Road through 2 client applications. The Data Import application enables users to select plates for import from the platform-specific data repository (Cellomics database, Opera, or InCell file share). The import job is performed on a central server. Multiple plates can be transferred in parallel for faster import, and well summary results are imported separately from cell-level measurements so users can review well-level results more quickly. A Web-based administration tool controls the number of threaded processes and other data import settings. Experimental annotation, data mining, and visualization are supported by the dedicated Data Explorer client application. Data-intensive operations, including data extraction and updates, quality control (QC), and data analysis, are implemented on the servers and the database to reduce the amount of data transferred from server to client. The Data Explorer also allows users to view images for selected wells or as a “poster” of images for an entire plate. Images can also be viewed in third-party applications such as TIBCO Spotfire as Web pages (
The large volumes of data generated by HCS require particular attention to image and data storage and management. For file storage, we adopted a disk-based network attached storage system (Isilon Systems, Seattle, WA). This system provides scalable and extensible storage that is well suited for managing large numbers of files such as HCS images. The distributed nature of the system means that input and output bandwidth grow in parallel with capacity, avoiding a potential bottleneck. Images are stored at or near the site where they were acquired (and where they are likely to be analyzed or viewed) to reduce network latency issues. This approach reduces storage costs while increasing the bandwidth for image transfer.
The large number of data records generated by HCS also presents an informatics challenge. We store HCS results in Oracle relational databases, as do other HCS users. 11 These databases can become very large, primarily because of cell-level data. We observed that as the size of our databases grew, performance deteriorated. To address this, we worked with Thermo Scientific Cellomics to apply Oracle’s database partitioning capabilities to the Cellomics Store database. We focused our efforts on the 2 largest tables in the database: the CELL table, which contains identifiers and locations for individual cells, and the CELLFEATURE table, which contains derived results for individual cells. Our partitioning scheme exploits the fact that, once written, cell-level data are unlikely to change. Partitioning the tables in a coordinated fashion provided 10-fold reductions in data load times and 20-fold reductions in query times. Historical partitions are accessed in read-only mode, which helps to protect data integrity and speeds up database backup and recovery.
Eventually an organization with multiple HCS groups and readers will exhaust the capacity of any storage system. Managing data growth requires tools for selectively loading result types into the database for each assay and data retention mechanisms to delete images and data that are no longer required. During data loading, HCS Road allows users to select whether to import cell-level data in addition to well summary results. To support data retention policies, HCS Road associates data and images with the scientist and group who generated them and with the program or project they support using company-wide standard identifiers.
Experimental annotation
Analysis and mining of results requires extensive and controlled annotation of experimental treatments and conditions. We sought to capture this information in a way that enabled long-term mining of results across assays and users and enforced consistent nomenclature for cell lines, detection reagents, and control or experimental treatments.
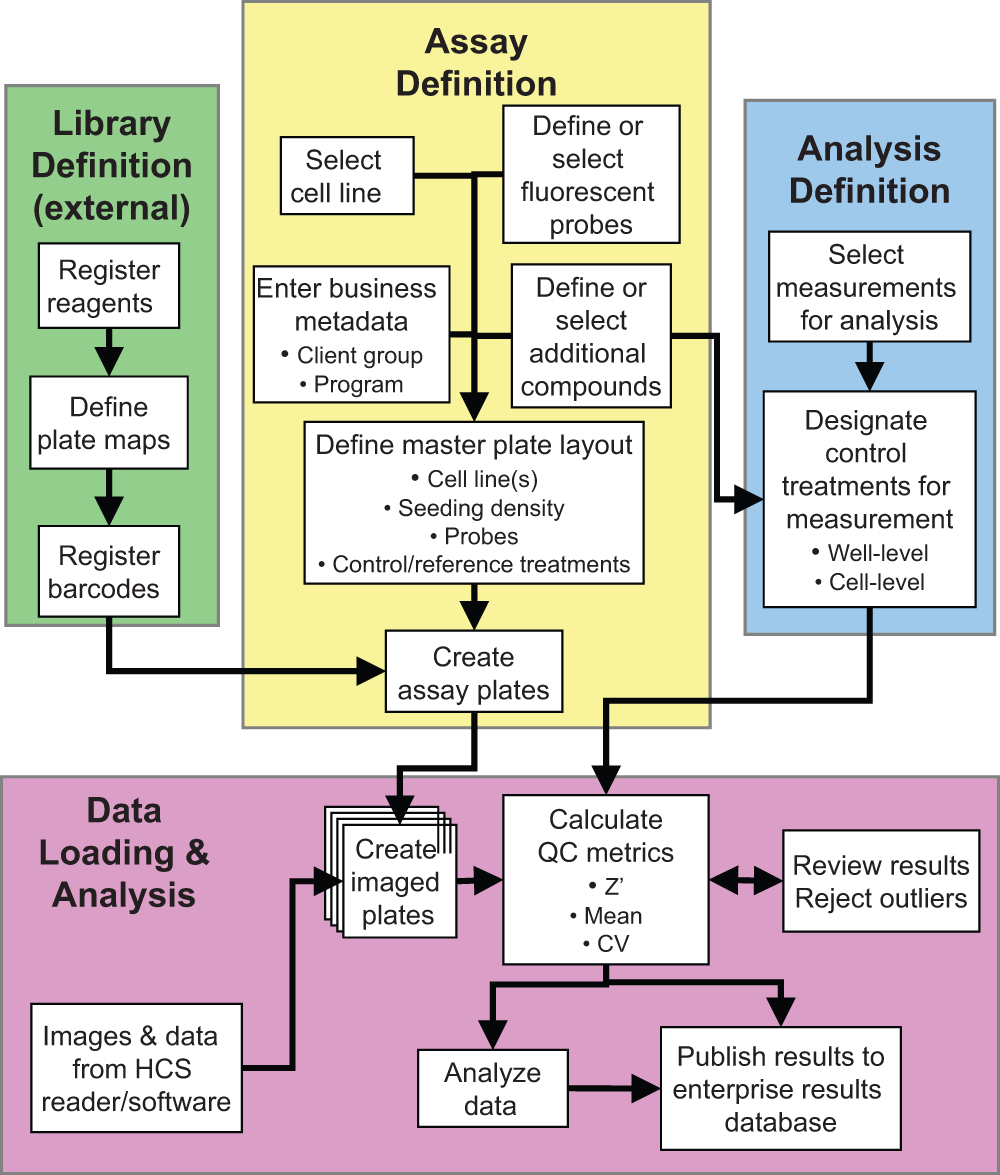
Workflow for experiment definition, data import, and analysis. White boxes show workflow steps, and colored boxes indicate functional subsets of the process. Black arrows indicate workflow progression and dependencies between steps.
The creation of a new assay begins with the selection of the cell line(s) and fluorescent probes used in an experiment (yellow box in
The last step in experimental annotation is the assignment of positive and negative control treatments (blue box in
Data loading and review
Once images have been collected and analyzed, the results are loaded into HCS Road for analysis (pink box in
The data-loading process can be automated; users register their assay plates in HCS Road and enter the time range, imaging protocol, and primary database or file share where the results will be deposited. HCS Road monitors the designated repository for corresponding plates and imports them automatically. This enables users to go directly from setting up their scans to reviewing the fully annotated results and performance metrics within HCS Road. Alternatively, users may import their results first and define the assay and link assay plates to the results later. This provides the flexibility to support both large-scale screens and small-scale assay development or experiments.
For data review, HCS Road automatically calculates metrics for assay performance. In addition to the Z′ metric of Zhang et al.,
12
the plate mean, median, standard deviation, minimum, and maximum are reported for negative control, positive control, and sample wells for each plate in a run (
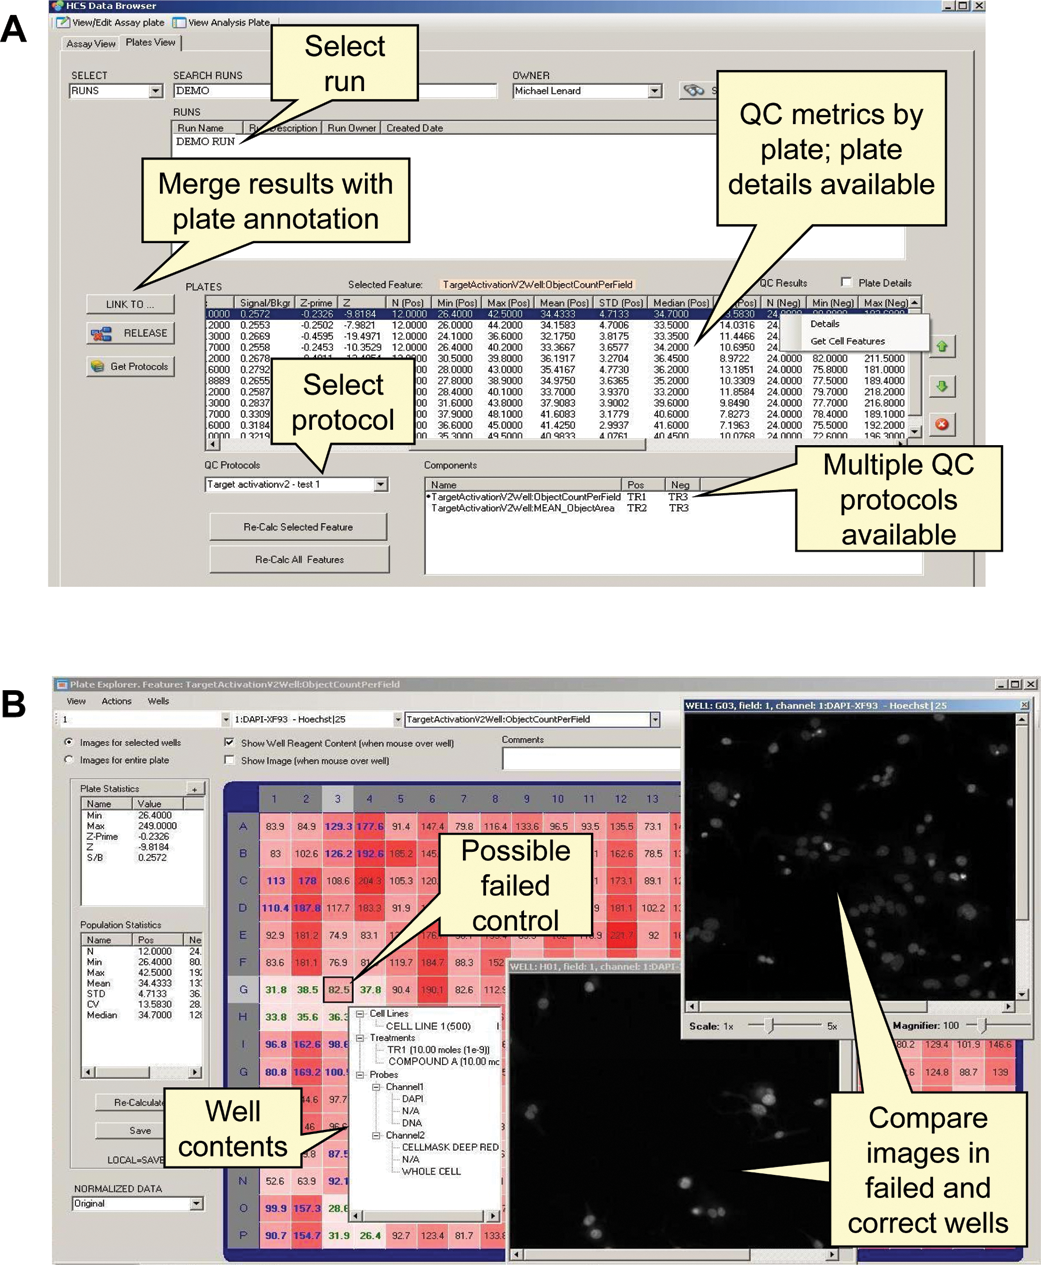
Assay performance reports and data review tools. (
Data analysis
HCS Road automatically calculates multiple normalizations when data are loaded. The calculations include percent control, percent inhibition, signal to background, and z score. 13 These normalizations are calculated on a per-plate basis. Both raw and normalized results can be exported or analyzed within the HCS Road Data Explorer. Users can select the appropriate normalization for their assay and measurements.
We implemented analyses that are performed frequently with fixed workflows within the HCS Road Data Explorer application. The first analysis we implemented was concentration-response curve fitting. Curves are fit using a 4-parameter logistic regression with XLfit equation 205 (IDBS Business Solutions). Replicate wells from single or multiple plates are incorporated into a single analysis as independent data points.
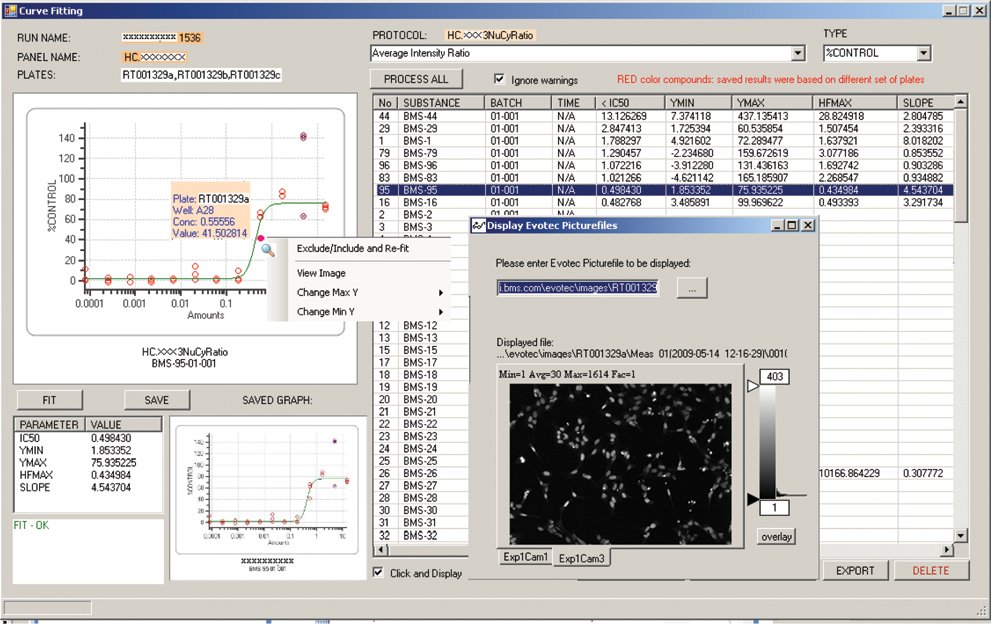
Concentration-response analysis within the HCS Road client showing data points and fit line for selected treatment (top left), fit parameters for all treatments in the selected plates (top right; blue highlighting indicates the selected treatment displayed in panels
We also identified a need to export results and annotation from HCS Road to third-party applications so researchers can perform calculations and generate visualizations that are not part of a common workflow. We use TIBCO Spotfire for many of our external visualizations because it can retrieve data directly from the HCS Road database, supports multiple user-configurable visualizations, provides tools for filtering and annotating data, and can perform additional analyses using internal calculations or by communicating with Accelerys PipelinePilot (San Diego, CA).
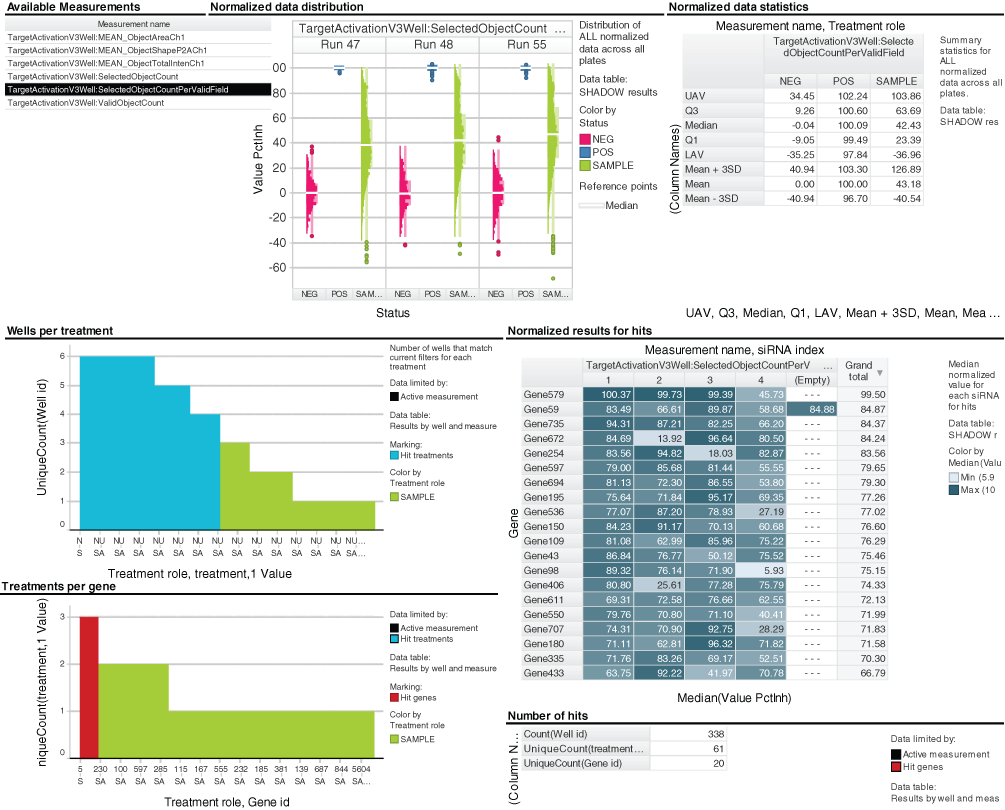
TIBCO Spotfire workflow for hit selection from RNAi screens from HCS Road showing: (top left) table of available measurements; (top center) histograms of cell count percent inhibition for control and library wells across multiple runs; (top right) table of summary statistics for normalized cell count for control and library reagents; (middle left) bar chart of numbers of wells per RNAi reagent with normalized values above a user-defined threshold (blue shading indicates hit reagents where at least 4 of 6 replicate wells passed the threshold); (bottom left) bar chart of numbers of individual RNAi reagents per gene where 4 or more replicate wells passed the normalized value threshold (red shading indicates hit genes where 3 or more independent RNAi reagents for the same gene were selected as hits); (middle right) table of median cell count percent inhibition values for all hit genes; (bottom right) numbers of wells, RNAi reagents, and genes selected as hits.
Cell-level data
Managing and analyzing cell-level data was a high priority in the development of HCS Road. Cell-level data enable the analysis of correlations between measurements at the cellular level, the use of alternative data reduction algorithms such as the Kolmogorov-Smirnov distance, 14,15 classification of subpopulations by cell cycle phase, 16 and other approaches beyond basic well-level summaries. 17 Implementing these and other methods requires a single format for cell-level measurements from multiple instrument platforms and groups. However, the volume of cell data in an HCS experiment can be very large. A single 384-well plate can generate many millions of database rows if stored in normal relational form. As the data tables grow, performance deteriorates and storage costs mount. Instead, we store cell-level results in a pair of comma-separated value (.CSV) files for each plate. The cell-level data are generated by instrument-specific analysis applications; for Opera results, the data are extracted from the output file specified by the file path in the XML import file (Suppl. data S2), and for ArrayScan results, the data are extracted from the platform database. The cell-level results are written to new, standardized comma-delimited files on the HCS Road file share. One file contains the cell coordinates (well, field, cell number, X and Y position, width, and height), and a second contains the values for each individual measurement on each cell. A future version will support cell-level data from the InCell 1000 system. When cell-level results are needed, these files are accessed in place by the database using Oracle’s external table functionality. A database stored procedure automatically creates separate external tables for each requested plate. These tables can be created quickly at the cost of slower query performance. Extracting values for a single cell-level measurement for 1 well from a plate with over 34 million cell measurements takes 1 s to create the table and 93 s to perform the query with our current server configuration (described in Methods). The cell measurements can then be analyzed automatically using algorithms such as the Kolmogorov-Smirnov distance 14,15 to create new well-level results or exported using the HCS Data Explorer application. Alternatively, if the same cell-level data will be queried repeatedly, then the requesting user or application can instruct the procedure to copy it to the database. This takes longer to create the table (84 s for the same operation as the previous example) but enables faster queries (3 s). Cell data tables of either type that have not been accessed in the past 30 days are automatically removed from the Road database but are still retained as files on the share. This controls database growth and improves performance compared to retaining large numbers of records in the database.
Comparison to other image management tools
The growing use and importance of HCS has led to the development of various systems for the management and analysis of images and derived results. Vendor-provided systems such as InCell Miner (GE Healthcare) and HCSDiscover (Thermo Scientific) primarily support single HCS platforms, although some import capabilities may be available. These systems offer varying levels of support for experimental annotation and would require modification to integrate with existing internal databases. The best-known and most mature platform-independent solution is the OMERO application and the corresponding OME-XML data model developed by the OME consortium (http://openmicroscopy.org). Although OMERO and HCS Road have superficially similar functions (the organization and management of microscopy images and results), the two packages have quite different objectives and designs. OMERO was developed to support a broad range of microscopy types, resulting in a very flexible data model, 5,6 whereas HCS Road was developed specifically for HCS and is tailored for this use. OMERO emphasizes the organization and management of images 6 and includes a rich data model for image metadata (objective, exposure time, and similar properties) but has only general support for treatment information and only recently added support for screening results encompassing large numbers of multiwell plates. 6 By contrast, HCS Road captures a smaller amount of image acquisition metadata; instead, it emphasizes derived results from image analyses and describes experimental treatments, reagents, and conditions in greater detail and in a more structured manner to enable cross-referencing between databases and data mining across assays. HCS Road also captures higher level results, such as slope and IC50 values from a concentration-response experiment. Both packages face common issues, particularly reconciling the variety of proprietary image file formats and data models used by different instrument vendors. One interesting future direction would be to integrate HCS Road with OMERO and OME, using the former for experimental annotation and numeric results and the latter for image management and image metadata.
Benefits of integrated data management
We chose to develop our own HCS data management system rather than adopt an existing package because at the time, the available HTS data management and analysis tools were not well suited for HCS. 9 Furthermore, we needed to integrate our HCS data with existing internal databases for treatment information, plate maps, cell line annotation, and data publication. Developing our own database and tools provided the flexibility to align to our existing systems. This integration reduces the amount of data users must enter, reduces opportunities for mistakes, and ensures that HCS results can be integrated with results from other assay types. The common XML schema we developed for image analysis results facilitates the integration of new HCS instruments and third-party image analysis applications with HCS Road. An enterprise-wide data management system also facilitates the sharing of assays and analysis tools between groups within an organization. Users can view assay data, determine whether a cell line or fluorescent probe has been used successfully, and see how a hit from their assay performed in previous experiments.
Because HCS Road is so closely integrated with existing internal databases, it cannot readily be adapted for standalone use and distribution. Furthermore, some organizations will wish to adapt their HCS database to their own existing enterprise systems. Instead, we have described design choices and solutions that we found valuable for the management and analysis of HCS results. We describe solutions for managing the large volume of images and derived data inherent to HCS using network storage and the database partitioning and external table functionalities of Oracle. We present the XML schema we developed for derived data (Suppl. data S1-S2). We plan to contribute additional portions of our work to projects working to establish standard formats for data exchange and reporting, particularly the data models we developed for experimental annotation and for image analysis results. In the interim, interested parties may contact us for additional details.
Footnotes
Acknowledgements
The authors acknowledge Isaac Neuhaus for assistance with cell data management and analysis, David Mosenkis of TIBCO Software for assistance with the use and configuration of TIBCO Spotfire, Thermo Scientific Cellomics for assistance with database partitioning, and Namjin Chung and John Feder for comments on this manuscript. The authors are employees or contractors of Bristol-Myers Squibb, which funded this work.