
Abstract
A major decision at the time of hearing aid fitting and dispensing is the amount of amplification to provide listeners (both adult and pediatric populations) for the appropriate compensation of sensorineural hearing impairment across a range of frequencies (e.g., 160–10000 Hz) and input levels (e.g., 50–75 dB sound pressure level). This article describes modern prescription theory for hearing aids within the context of a risk versus return trade-off and efficient frontier analyses. The expected return of amplification recommendations (i.e., generic prescriptions such as National Acoustic Laboratories—Non-Linear 2, NAL-NL2, and Desired Sensation Level Multiple Input/Output, DSL m[i/o]) for the Speech Intelligibility Index (SII) and high-frequency audibility were traded against a potential risk (i.e., loudness). The modeled performance of each prescription was compared one with another and with the efficient frontier of normal hearing sensitivity (i.e., a reference point for the most return with the least risk). For the pediatric population, NAL-NL2 was more efficient for SII, while DSL m[i/o] was more efficient for high-frequency audibility. For the adult population, NAL-NL2 was more efficient for SII, while the two prescriptions were similar with regard to high-frequency audibility. In terms of absolute return (i.e., not considering the risk of loudness), however, DSL m[i/o] prescribed more outright high-frequency audibility than NAL-NL2 for either aged population, particularly, as hearing loss increased. Given the principles and demonstrated accuracy of desensitization (reduced utility of audibility with increasing hearing loss) observed at the group level, additional high-frequency audibility beyond that of NAL-NL2 is not expected to make further contributions to speech intelligibility (recognition) for the average listener.
Introduction
The assignment of gain across frequencies (e.g., 160–10000 Hz) for the improvement of speech understanding has been an overarching goal of recommending hearing aid amplification for the past 100 years in both electronic developments and clinical practice advancements. The implementation of the particulars, pertaining to the overarching goal, has taken many different forms with specific formulas, methods, and recommendations. As in any subject area, generally there is greater credit/more success with some forms of implementation than other forms. In the case of hearing aids, this is also true. A brief part of this introduction is devoted to some past and current forms of implementation more commonly known as prescriptions. A general goal of prescription development for hearing aids is the application of recommended amplification to real patients wearing hearing aids to serve the best interests of patients usually in the outcome domain of improving speech recognition. Forthcoming in this article is the demonstration that given the recommended amplification of prescriptions, realistic expectations for speech recognition across a wide variety of sensorineural hearing loss magnitudes and configurations in both quiet and noisy listening environments can be closely approximated for a highly specified average listener of various ages.
Even though many individuals with hearing impairment have difficulty understanding speech in noise, ironically, to date, prescriptions have focused almost exclusively on recommending gain–frequency responses that optimize speech intelligibility in quiet. A justification for this approach is that the gain–frequency response that provides the best speech intelligibility performance in quiet is the best for speech intelligibility performance in noise, as was demonstrated recently by Crukley and Scollie (2012), who indicated, however, that the prescription may need to differ for speech in quiet versus speech in noise listening to alleviate aversive loudness. Before reviewing some of the specifics of certain prescriptions, a general framework on which prescriptions operate is needed. The framework of operation is of relevance to substantiate that amplification for hearing aids, designed to remediate hearing loss, can be expressed in the proposed concept of modern prescription theory (MPT).
Modern Prescription Theory
MPT is predicated on the observation that a trading relationship exists between a desired outcome (return) and an undesired consequence (risk). A prominent illustration of this observation, unrelated to hearing aids, was the seminal introduction of financial portfolio allocation (investment) under uncertainty (Markowitz, 1952), which later became known as modern portfolio theory. In modern portfolio theory, Markowitz succinctly demonstrated that optimal allocations of investments within a portfolio (ones that approximated the efficient frontier) could achieve the maximal return on investment for a given amount of risk.
With application of the concepts in modern portfolio theory, MPT for hearing aids, newly developed and presented herein, proposes that desired outcomes/returns (e.g., speech intelligibility, high-frequency audibility) can be traded against undesired risks (e.g., too much loudness). In MPT for hearing aids, the trading relationship of return versus risk for a listener with normal hearing sensitivity (i.e., 0 dB hearing level [HL]) is put forth as the means for establishing the efficient frontier. From establishment of the efficient frontier, the recommendations of prescription methods for fitting hearing aids to individuals with hearing loss can be compared with one another and with the normal hearer. The goal of comparing with the normal hearer, however, is not for prescription recommendations to make amplified speech for individuals with hearing loss like the normal hearer. Rather, the goal is to assess the degree to which individuals with hearing loss function as well as the normal hearer given the recommended amplification of a prescription and signal-to-noise ratio (SNR)-changing technologies. Thus, given a stated return of interest and accompanying presumed risk, prescription methods that more closely approximate the efficient frontier of the listener with normal hearing sensitivity are, as presented in this article, more efficient (better) than methods that are less efficient (worse). In this manner, MPT for hearing aids operates like modern portfolio theory for financial asset allocation in an investment portfolio.
Existing methods of comparing the performance of prescriptions, without an efficient frontier approach, in very recent years has been to compare performance on isolated dependent variables (e.g., insertion gain, real-ear output, speech intelligibility, speech recognition, loudness, and audibility). For example, the loudness of speech at low, medium, and high input levels for a listener with normal hearing sensitivity is sometimes used as a reference point for comparing prescriptions. Such loudness reference points were used in a recent publication by Ching et al. (in press), where a low speech level of 52 dB sound pressure level (SPL) yielded 8.5 sones of loudness, a medium speech level of 65 dB SPL yielded 18.6 sones of loudness, and a high speech level of 76 dB SPL yielded 41.7 sones of loudness for children listening to a NAL-NL2 prescription. At each of these speech levels, though, including even the low-level speech, the listener with normal hearing sensitivity had already reached an asymptotic return for both speech intelligibility and high-frequency audibility. The ability to compare the performance of prescriptions with that of the listener with normal hearing sensitivity was consequently not meaningful.
Therefore, MPT was designed to not compare performance but rather the efficiency of prescriptions. Focusing on efficiency rather than performance, with regard to loudness, is scientifically defensible because restoring loudness perception to that of the normal hearer is now regarded as philosophically flawed with regard to the observations of preferences and behaviors of individuals with hearing impairment who wear hearing aids (for a review, see Elberling, 1999; Keidser, Dillon, Carter, & O’Brien, 2012). That is, neither normalizing nor equalizing loudness perception to that of the normal hearer is the goal of modern-day prescriptions as was true for early prescriptions a decade ago. Instead, hearing-impaired listeners prefer about half the loudness of a normal hearer when listening to a conversational speech input level (Smeds et al., 2006a, 2006b). Efficiency is further logical as a means of comparison because prescriptions, at least well-validated ones, are already commonly regarded as ensuring adequate benefit and satisfactory outcomes for patients at the group level (Abrams, Chisolm, McManus, & McArdle, 2012; H. Mueller, 2005; Valente et al., 2006).
Within the context of hearing aid amplification, the most generalized assets allocated in a hearing aid fitting are prescribed gain values across frequencies (i.e., the gain–frequency response), which is akin to allocating assets across investments in keeping with the extension of modern portfolio theory to MPT. Prescribed gain values, which vary with respect to input level (i.e., the definition of amplitude compression), when added to the input level, determine the prescribed output level. As a result of gain or output allocation across frequencies, a resulting inevitable trade-off is perceived loudness by the wearer of hearing aids. The term trade-off is used because, while loudness is often acceptable to a point, uncomfortable or excessive loudness can be a predominant reason for rejecting amplification (e.g., Cox, Alexander, Taylor, & Gray, 1997; Pascoe, 1988; Smeds et al., 2006a, 2006b). Controlling for excessive, but ensuring adequate, loudness has often been considered in the development of prescriptions for hearing aids.
The return on the prescribed gain and accompanying output values then can be any number of outcome measures (e.g., speech intelligibility, high-frequency audibility, patient benefit, and patient satisfaction). Within the context of speech intelligibility and high-frequency audibility, this article will discuss the two most prominent generic prescription methods for hearing aids, each with an approximate 40-year history, spanning linear and nonlinear eras of amplification. Again, the most generalized risk for prescriptions that ensure returns of sufficient speech intelligibility and high-frequency audibility performance is excessive loudness. Thus, prescriptions embody much of the preceding research on optimal frequency responses to ensure these two returns while managing risk (e.g., Humes, 1996; Pascoe, 1975, 1988; Skinner, 1980; Skinner, Karstaedt, & Miller, 1982). MPT is hence a means to compare the efficiency of different prescriptions.
Modern-Day Generic Prescriptions
The progression of two modern-day prescriptions exists in the current implementation of the Australian National Acoustic Laboratories—Non-Linear 2 (NAL-NL2) and the University of Western Ontario implementation of the Desired Sensation Level Multiple Input/Output (DSL m[i/o]). NAL-NL2 seeks to maximize the Speech Intelligibility Index (SII) with the constraint of not exceeding the perceived loudness of a listener with normal hearing sensitivity (Dillon, 2006; Keidser & Dillon, 2006; Keidser et al., 2012; Keidser, Dillon, Flax, Ching, & Brewer, 2011). DSL m[i/o] seeks to ensure audibility of amplified speech with consideration of loudness comfort (Scollie et al., 2005; Seewald, Moodie, Scollie, & Bagatto, 2005).
Stated differently, but important to clearly convey meaning, NAL-NL2 prescribes audibility to frequencies that are useful to speech recognition (i.e., offers an incremental improvement of >0.00 SII units) and intentionally does not prescribe audibility to frequencies that are useless to speech recognition (i.e., where consideration of the sensation level/audibility, band importance functions, and the desensitization factor result in 0.00 additional SII units). The upper limit on the prescribed desired sensation levels of NAL-NL2 is how much utility for speech recognition can be extracted from the SII of useful frequencies, while simultaneously referencing the Moore and Glasberg (2004) loudness model as an additional means to place a cap on the amount of recommended sensation levels. In contrast, DSL m[i/o] attempts to maximize bandwidth (audibility of frequencies), with the intent of ensuring access to speech cues that could possibly improve speech recognition. Therefore, DSL m[i/o], while considering loudness comfort based on past subjective evaluation of individuals with hearing impairment, makes no assertion about when audibility is useless and assumes audibility in the range of frequencies relevant to speech understanding (e.g., 160–10000 Hz) could be useful to speech recognition, no matter the severity of loss, as a means to determine the recommended amplitude–compression frequency response. Consequently, the two prescriptions operate on two different philosophies (one prioritizes SII units and one prioritizes audible bandwidth); the result is differing desired sensation levels and loudness.
Speech intelligibility modeling
The SII model is a standardized method of calculating audibility of a speech signal for predicting speech intelligibility (American National Standards Institute [ANSI] S3.5-1997, 2007). The SII is represented by the following equation:
The SII model has been successfully used to predict speech scores for different types of speech material for listeners with normal hearing. The model has previously overestimated performance, however, for listeners with hearing loss because of a lack of agreement between audibility and intelligibility. The amount of intelligible speech information that can be extracted from an audible signal decreases as hearing loss increases (Carhart, 1951; Ching, Dillon, & Byrne, 1998; Hogan & Turner, 1998; Pavlovic, Studebaker, & Sherbecoe, 1986; Studebaker, Sherbecoe, McDaniel, & Gray, 1997). This decreased ability of the impaired ear is commonly referred to as hearing loss desensitization (HLD) and has recently been demonstrated as not frequency specific (Ching, Dillon, Lockhart, van Wanrooy, & Flax, 2011; Johnson & Dillon, 2011), consistent with the results and interpretation of findings from Hornsby and Ricketts (2003) and Hornsby, Johnson, and Picou (2011). Desensitization is a broad estimate of suprathreshold distortion based on the magnitude of the hearing loss to reflect impaired auditory function in domains such as frequency resolution and temporal processing. Bernstein, Summers, Grassi, and Grant (2013) demonstrated the improvement to speech intelligibility estimates that is achieved when measures of suprathreshold distortion were added to auditory models of audibility-based SII calculations. In essence, speech recognition will be overestimated if an audibility-based SII calculation does not allow for desensitization. The overestimation is larger when the hearing threshold exceeds approximately 60 dB HL because suprathreshold distortion increases with accompanying damage to inner hair cells in the cochlea. Therefore, the SII model needs modification to include HLD (Ching et al., 1998, 2011; Humes, 2002). This article has used both the ANSI S3.5-1997 (2007) method of SII calculation without desensitization (referred to as traditional) and the ANSI SII calculation with desensitization (referred to as revised). Input data to the SII model were (a) hearing sensitivity thresholds from the 27 audiograms and (b) real-ear aided response (REAR) values in one-third octave bands generated from the NAL-NL2 and DSL m[i/o] prescriptions.
In applying the SII model to estimating speech intelligibility for children, speech scores will be lower for children than for adults at a given SII (Gustafson & Pittman, 2011; McCreery & Stelmachowicz, 2011; Scollie, 2008). The observed difference between adult and child performance was not, however, due to differences in the contribution of frequency regions to speech recognition. In other words that the frequency importance functions (e.g., Pavlovic, 1994) in the standard SII calculation do not need modification for children (McCreery & Stelmachowicz, 2011). The pediatric group SII values, calculated based on gain and output recommendations by the two different prescriptions, are, therefore, reduced by the age-related proficiency factor of Scollie (2008). No age-related proficiency factor was used for the adult SII data.
Although the SII has been used to compare prescriptions for children (Ching et al., in press; Stelmachowicz, Lewis, Kalberer, & Creutz, 1994), SII is not the only measure of adequacy to consider (Ching et al., in press; Stelmachowicz et al., 1994). The major determinants for SII (based on audibility alone) are hearing sensitivity thresholds and the amplified speech spectrum. Assuming noise is not present, a prescription that applies enough gain and output at each frequency to allow audibility of speech across frequencies should, in turn, yield a higher SII value. SII values will not be higher, though, when desensitization is assumed to accompany substantial magnitudes of hearing loss (i.e., the expected performance based on repeated evidence to date, e.g., Ching et al., 1998, 2011; Hogan & Turner, 1998; Pavlovic et al., 1986; Studebaker et al., 1997). Even if amplification technology allows for the desired gain and output for audibility, such amplification may result in excessive saturation of the hearing aid. In practical applications, the prescriptions with a higher SII value may result in excessive loudness (e.g., Rankovic, 1991) and potential threshold shifts, as a consequence of hearing aid sound exposure levels (Macrae, 1994, 1995, 1996). These considerations require any approach to evaluating hearing aid prescriptions to include calculations of audibility across frequencies, SII, and estimations of loudness. This multiple perspective approach is present in the proposal of MPT for hearing aids.
High-frequency audibility
The audibility of speech is the amount of sensation (in decibels SPL) that is above the HL when the threshold is converted into decibels SPL. Audibility is commonly reported as a function of frequency. There are two ways to quantify audibility known as peak and root mean square (RMS) audibility. When the peak sensation level is below 0 dB SPL, the frequency is referred to as completely inaudible. When RMS sensation level is 0 dB, all the peaks of speech are still audible. The focus on quantifying audibility at high frequencies rather than lower frequencies is generally because of the following:
Greater contribution to speech recognition by mid to high frequencies (i.e., frequency importance functions; e.g., Pavlovic, 1994) than by lower frequencies. Improvement in the detection of word endings that contain the phoneme /s/, particularly in the English language, as the phoneme conveys meaning such as plural or possessive form (e.g., Stelmachowicz, Pittman, Hoover, & Lewis, 2001).
Loudness modeling
The perception of loudness has been estimated accurately for individuals with normal hearing and cochlear hearing loss by the Moore and Glasberg (2004) model. As explained by Moore et al. (2010), the model relies on two key concepts: (1) excitation pattern along the basilar membrane transformed into an equivalent rectangular bandwidth (ERBN) scale to represent frequency and (2) specific loudness of the frequency-specific loudness density, measured in sones per ERB. The ERBs are approximations of the filters in the human auditory system, with bandwidth as a function of frequency ( f ) given by the formula 0.108f + 24.7 (Moore & Glasberg, 1996). The formula relating ERBN to frequency f (in kilohertz) is given in Glasberg and Moore (1990) as follows: ERBN − number = 21.4log10(4.37f + 1).
Specific loudness is calculated by frequency in the ERBN scale from the amount by which excitation at each frequency exceeds the threshold excitation at that frequency (Moore & Glasberg, 1997, 2004). When specific loudness, N′, equals 0.00537 in any ERBN, the energy level (E) of the input sound is sufficient to excite the cochlea and a threshold response (ETHRQ) is reached (i.e., E = ETHRQ = 2.31). Overall loudness (in units of sones and phons) is then calculated by summing specific loudness across ERBs.
The calculation of specific loudness includes the effect of hearing loss on the transfer function of the inner and outer hair cells. Default assumptions of the model partitioning loss between the inner and outer hair cells have been adopted: Outer versus inner hair cell damage was 0.9 and 0.1, respectively, up to the maximum outer hair cell loss of 57.6 dB HL (Moore & Glasberg, 2004). In clinical practice, the amount of underlying outer versus inner hair cell loss is almost always unknown.
The loudness model has been derived from adult data, but there is no evidence to suggest that it needs modification when applied to children (B. C. J. Moore, personal communication, February 6, 2013). Indeed, data from Serpanos and Gravel (2004) revealed no significant difference in loudness functions between children and adults with normal hearing. Children with auditory experience at high in-the-ear sound pressure levels from amplification have been reported to prefer listening at those levels (Scollie, Seewald, Moodie, & Dekok, 2000; Scollie et al., 2010). Consequently, appropriate amplification recommendations should include limits on the loudness. Indeed, excessive amplification can potentially cause deterioration of hearing loss due to, in essence, noise exposure (e.g., Macrae, 1996). As observed by Ching et al. (in press), and again demonstrated in this article, NAL-NL2 and DSL m[i/o] are not similar to one another with regard to the recommended limits of loudness.
A Bigger Picture to Hearing Aid Product and Service Provision Than Numbers of Prescriptions and Modeling
No matter the brand or model of a hearing aid, the following items are proposed as top priorities in the treatment of hearing loss for patients who are candidates for and choose to wear hearing aids.
To address the communication goals and listening needs of the patient. To ensure satisfaction with the recommended treatment plan, as well as the fit, comfort, and aesthetics of the physical device. To lessen SNR loss caused by the suprathreshold distortion component of sensorineural loss. To establish realistic expectations of speech recognition performance. To maximize suitable audibility (sensation level as a function of frequency). To provide the widest audible bandwidth deemed effective. To constrain loudness to an acceptable, but appropriately adequate, amount. To ensure sound quality has favored clarity and pleasantness. To ensure the aforementioned priorities are realized in such a manner to maximize the outcomes of individual patients.
Together, the hearing health-care provider and patient work together to ensure the first two priorities are met in the rehabilitative model of hearing aid health-care delivery. The third priority can be addressed with hearing aid product components such as directional microphone technology, noise reduction technology, or wireless remote microphone technology (Valente et al., 2006). Prescriptions are, in the medical model of hearing aid health-care delivery, best attempts to accomplish the fourth through eighth priorities via numeric recommendations of amplification. Because of philosophical differences in prescriptions, however, how these priorities are accomplished and presumably how well the priorities are accomplished are impacted by the prescription (numbers) with which the hearing aid is fit. Therefore, consistent with the comparative approach (Carhart, 1946) and demonstrated and discussed herein, there may well be the need for patients to compare amplification offered as treatment, even with the highly selective prescriptions, available for hearing aids today. Synthesis of the numbers and words in an empathetic and personalized manner by the hearing health-care professional with the patient, blending what has been referred to vaguely as the science and art of hearing aid fitting, is suggested to consistently achieve favorable patient outcomes—the ninth and ultimate priority.
Purpose of Work Described Herein
Summary of Recent Research Comparing DSL m[i/o] and NAL-NL2 on SII, Loudness, and High-Frequency Audibility.

Methods
Subject Age Groups
Both adult (i.e., no-specific age) and pediatric (i.e., 3 years old) designators were used in this study, and the results will be reported separately for each age-group. These two age groups were selected because both DSL m[i/o] and NAL-NL2 have long acknowledged that recommended amplification for adults and children should not be the same.
Audiograms
Twenty-seven audiograms of a sensorineural type were selected for use in this study and are consistent with the mean and range of audiograms used by Ching et al. (in press). The mean hearing sensitivity thresholds for the left and right ears of 27 audiograms are reported (see Figure 1, left) alongside the mean thresholds of audiograms in Ching et al. (in press; see Figure 1, right) for comparison purposes. Consistent with a population of audiology patients, the 27 audiograms span a wide magnitude and contain various configurations of typically expected sensorineural losses (Wilson, 2011; Wilson, Noe, Cruickshanks, Wiley, & Nondahl, 2010). For children, the average real-ear to coupler difference (RECD) of 3-year-old children was assumed because that was the age of the children whose prescription targets were studied by Ching et al. (in press).
The mean hearing sensitivity thresholds for the left and right ears of 27 audiograms (left panel). Note. The mean thresholds of the 27 audiograms compared with the audiograms in Ching et al. (in press). The same 27 audiograms were used during the generation of both the pediatric and adult prescriptions.
Input Speech Levels
The input speech levels designated as low, medium, and high are representative of typical speech presentation levels when verifying the prescription targets for real-ear measures (e.g., 50, 65, and 75 dB SPL; G. Mueller, Ricketts, & Bentler, 2013).
Real-Ear-Aided Gain and Response Targets
Real-ear-aided gain targets from the DSL m[i/o] and NAL-NL2 prescriptive techniques were added to the input speech levels, yielding the prescribed REAR values (i.e., the output of a hearing aid in the ear canal). These REAR values were entered into speech intelligibility and loudness models.
SII Modeling
In this study, to estimate speech intelligibility, a standardized method of calculating audibility of a speech signal for predicting speech intelligibility (ANSI S3.5-1997, 2007) was used and is referred to as ANSII SII herein. To account for the distortion of sensorineural hearing loss, desensitization was added to create a second estimation herein referred to as reduced or desensitized SII. Input data to the speech intelligibility models were hearing sensitivity thresholds and REAR levels in one-third octave bands generated from both the NAL-NL2 and DSL m[i/o] prescriptions and each of the 27 audiograms.
Loudness Modeling
In this study, to create estimates of loudness, the Moore and Glasberg (2004) loudness model was used. Input data to the loudness model were hearing sensitivity thresholds and REAR levels in one-third octave bands generated from both the NAL-NL2 and DSL m[i/o] prescriptions and each of the 27 audiograms.
High-Frequency Audibility
To obtain the high-frequency audibility, hearing sensitivity thresholds in decibels SPL and REAR levels of SPL at the eardrum simply are compared for their relation to one another as described in the following text.
For each of the audiograms, the audiometric thresholds of both ears were entered into the Verifit (Audioscan, 2012) real-ear equipment in the appropriate left and right ear fields. Age-appropriate average RECD values associated with either the NAL-NL2 or DSL m[i/o] prescription methods were used. The age choice options of either adult or 36 months (3 years) were chosen to designate the desired adult or pediatric prescription. The SpeechMap Speech-std (1) signal (i.e., carrot passage from the Speech Intelligibility Rating test; Audioscan, 2012; Cox & McDaniel, 1989), which is shaped to the international long-term average speech spectrum (ILTASS; i.e., Byrne et al., 1994), was selected as the speech stimulus because the ILTASS signal is used in the DSL m[i/o] (Audioscan, 2012; Scollie et al., 2005) and NAL-NL2 prescription methods. High-frequency cutoffs of the prescribed frequency response (based on RMS levels) for low (50 dB SPL), medium (65 dB SPL), and high (75 dB SPL) input levels were determined by locating the intersection with straight-line tools (rounding to the nearest one-third octave frequency band) of the right-most prescription output targets (REARs) and the audiometric thresholds in SPL, just above (high-frequency cutoff) the point where speech energy was positive (audible). For example, in Figure 2, the highest frequency with RMS audibility using the NAL-NL2 prescriptive recommendation is indicated by the line segment with an arrow pointing to the frequency axis, whereas DSL m[i/o] recommends audibility across the entire range of frequencies for the same audiogram.
A SpeechMap plot on the Audioscan Verifit of hearing sensitivity thresholds in decibels SPL and the accompanying NAL-NL2 (left panel) and DSL m[i/o] (right panel) real-ear aided response prescriptive targets which demonstrates audibility of frequencies. Note. The vertical arrow points to the frequency at which root mean square audibility in the high frequencies is no longer present.
Efficient Frontier of Normal Hearing Sensitivity
Data points for plotting the efficient frontier for a normal listener with 0 dB HL thresholds across frequencies were obtained by beginning at high-level speech plus the real-ear unaided response of an average ear canal for adults (Bentler & Pavlovic, 1992) or 3-year-old children (Kruger, 1987), accordingly. The high-level speech input was then systematically decreased in 5-dB steps. Because values were asymptotic above a soft speech level of 50 dB SPL, data points for plotting the efficient frontier of the listener with normal hearing sensitivity span a range of speech levels below 50 dB SPL (soft speech).
The efficient frontier curves for normal hearing sensitivity for each age population are given by the following equations:
Pediatric
ANSI SII (y) = Loudness (x), where Desensitized SII (y) = Loudness (x), where High-frequency audibility (y) = Loudness (x), where ANSI SII (y) = Loudness (x), where Desensitized SII (y) = Loudness (x), where High-frequency audibility (y) = Loudness (x), where
Adult
The reason the efficient frontier for normal hearing sensitivity is equal for ANSI SII and desensitized SII (i.e., Equations 1 and 2 are the same for the pediatric population, and Equations 4 and 5 are the same for the adult population) is because with 0 dB HL thresholds there is no desensitization (i.e., the desensitization factor has no effect of reduction, as the 0 dB HL threshold implies no distortion). The efficient frontier for SII is different between the adult and pediatric populations (Equation 1 vs. 4, as well as Equation 2 vs. 5) because of the age-related proficiency factor of Scollie (2008) in use for the pediatric data. The high-frequency audibility versus loudness efficient frontier is the same for both adults and children (Equations 3 and 6) because loudness summation across frequency bandwidth is equivalent for both populations according to the Moore and Glasberg (2004) loudness model.
Improved Efficiency Analysis
The loudness of each audiogram, prescription, and input level was used to calculate the return of interest (i.e., SII or high-frequency audibility), as though the loudness had originated from a listener with normal hearing sensitivity, which will be known as the reference location (i.e., the efficient frontier). The efficient frontier was then compared against the actual performance data points for each audiogram, prescription, and input level. The Euclidean distance difference (i.e., interpreted herein as a measure of efficiency) between the actual and the efficient frontier could then be calculated. The difference between NAL-NL2 and DSL m[i/o] prescriptions and their individual efficiency can then be expressed as a percentage to compare one prescription with the other prescription (i.e., prescription with a higher return/prescription with a lower return ×100).
Results
Pediatric Selection
SII versus loudness
The performance for DSL m[i/o] (Figure 3, top) and NAL-NL2 (Figure 3, bottom) prescriptions is plotted for SII versus loudness for low, medium, and high input levels. The leftmost two panels plot the ANSI S3.5 SII values on the ordinate axis, and the rightmost two panels plot the desensitized or reduced SII values on the ordinate axis. The larger marker points indicate where the average data for amplified low (circle), medium (X), and high (diamond) input levels are located. Figure 3 indicates that DSL m[i/o] (top curves) reveals greater loudness than NAL-NL2 as the spread of data points span farther along the right of the abscissa.
Scatterplot of SII versus loudness when compared with the efficient frontier of the normal hearer for the pediatric population fit with DSL m[i/o] (top panels) or NAL-NL2 (bottom panels). Note. Low, medium, and high refer to the input level of speech. The large symbols are the average of all the low-, medium-, and high-input-level data in accordance to the corresponding symbol shape.
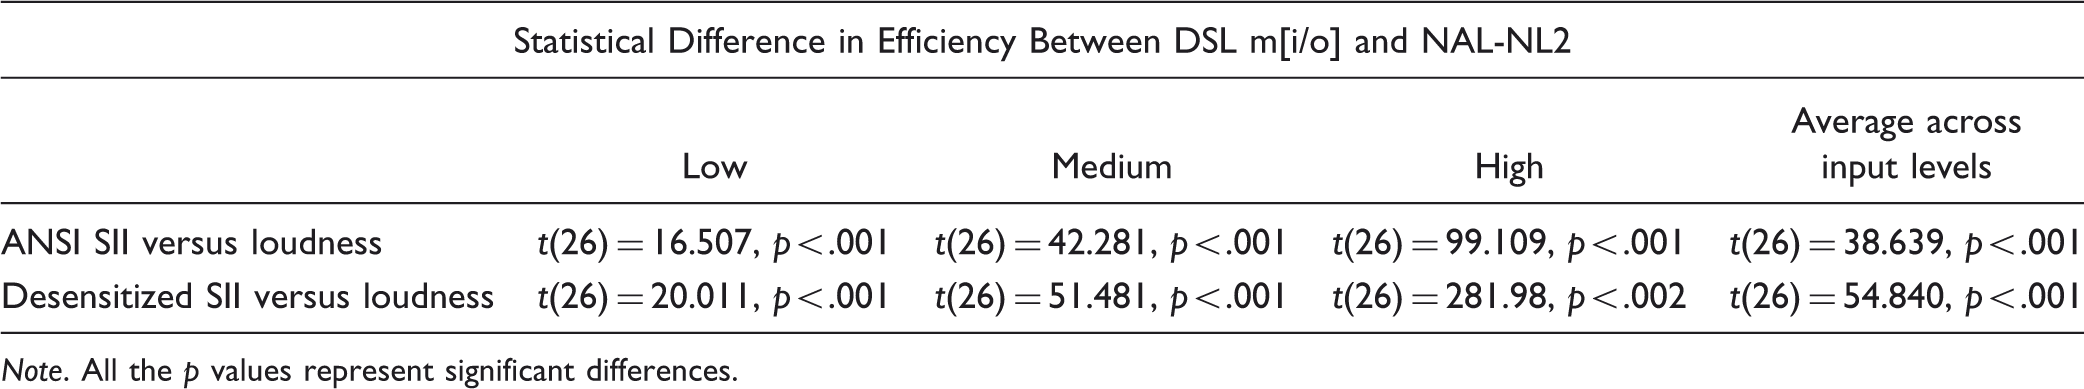
The improved efficiency analysis, as previously described, demonstrated with regard to return of SII for the risk of loudness that NAL-NL2 has a clear advantage over DSL m[i/o] (Figure 4). This finding is evident for the ANSI SII (black bars) and desensitized SII (white bars) calculations. A significant difference (using multiple t-test comparisons) in the improved efficiency (in percentages) relative to a 0% difference (i.e., no difference) between the two prescriptions is marked with an asterisk in Figure 4, and the accompanying statistical analysis is found in Table 2.
The improved efficiency for children fit with NAL-NL2 when compared with DSL m[i/o] in a return versus risk (SII vs. loudness) analysis. Note. The asterisk refers to a statistically significant difference between the two prescriptions in efficiency. t-Test Statistics on Whether the Improved Efficiency Calculation for Return of SII Was Better Than No Difference (0%) for the Pediatric Population. Note. All the p values represent significant differences.
To demonstrate the impact of SII values on percent correct scores for speech, transfer functions for the two commonly used speech materials in clinical audiology; that is, the Northwestern University-6 (NU-6; Studebaker, Sherbecoe, & Gilmore, 1993) and Connected Speech Test (CST; Humes, 2002; Sherbecoe & Studebaker, 2002, 2003) were used.


The estimated percent correct score for each audiogram (unaided, aided with DSL m[i/o], and aided with NAL-NL2) is plotted as a function of the 0.5 -, 1 -, and 2-kHz pure tone average (PTA; Figure 5). The NU-6 predictions are shown in the top panels, and the CST predictions are shown in the bottom panels. The left panels include the predictions based on the ANSI SII values, and the right panels include the predictions based on the desensitized SII. Hence, the benefit from amplification for speech in quiet can be visualized.
A scatter plot of percent correct scores with (right column) and without (left column) desensitization as a function of PTA for children fit with DSL m[i/o] (squares) or NAL-NL2 (circles) on both the NU-6 (top row) and CST (bottom row) speech material.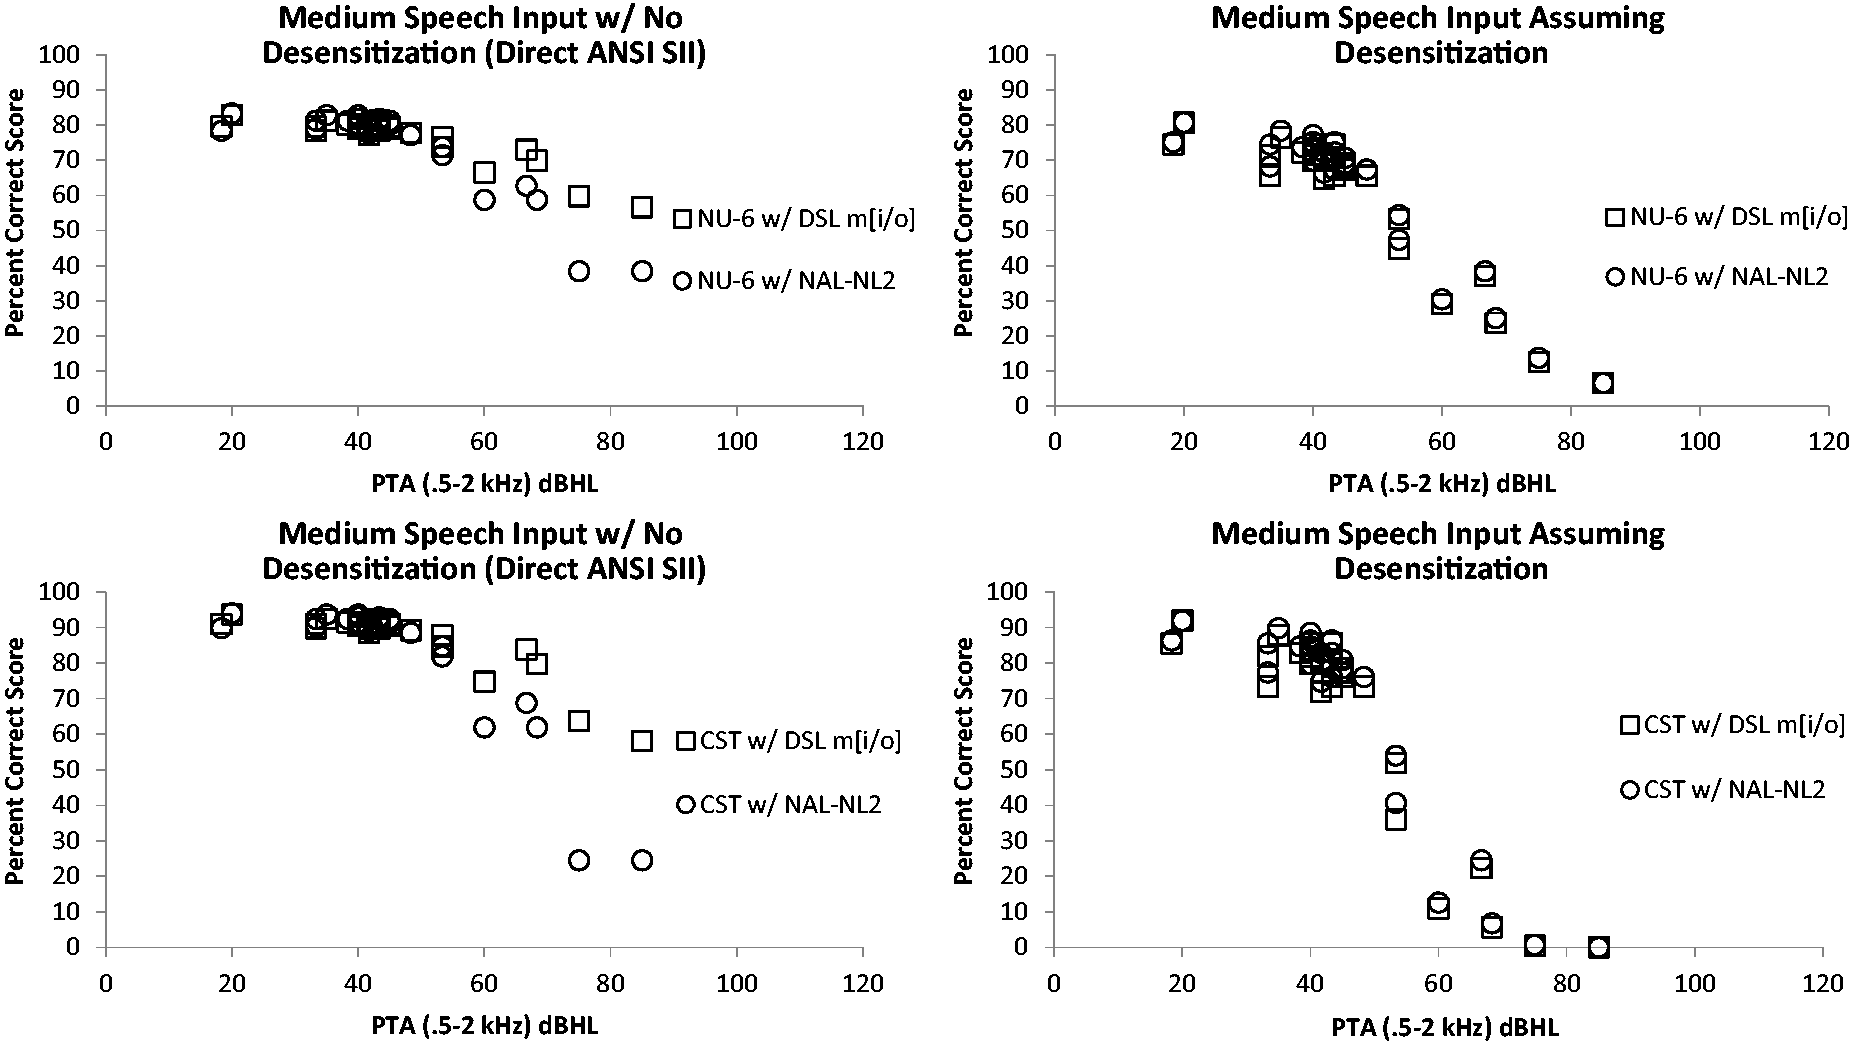
In general, the scattergrams indicate scores for the CST speech material plateau more quickly than predicted for the NU-6 material, which is consistent with the sentence versus word nature of the two tests. In comparisons of the two prescriptions, the percent correct ANSI SII predictions are better for the DSL m[i/o] prescription than the NAL-NL2 prescription when the PTA hearing loss exceeds approximately 60 dB HL. When the predictions are desensitized (Figure 5, right) for increasing hearing sensitivity thresholds, however, the expected performance with the two prescriptions is near equivalent. In other words, the estimated percent correct scores decrease with desensitization, when compared with the ANSI S3.5 SII values without desensitization, to yield similar expected performance for both the DSL m[i/o] and NAL-NL2 prescriptions.
Figure 6 (with second-order polynomial regression trend lines) is reflective of the fact that with increasing hearing loss, even when aided with well-validated generic prescriptions, individuals are expected to have decreased performance abilities to recognize speech. This concept is often generalized in realistic expectations counseling for hearing aids in clinical practice. Such counseling has traditionally been without any quantified reference as to the expectation, as no known quantified expectation(s) exist based on published literature. The aforementioned data provide a quantified expression of realistic expectations for a typical listener of a given hearing loss. In other words, once SII has been approximated, then realistic expected amounts (e.g., percent) of speech recognition abilities can be predicted using previously published transfer functions. Transfer functions for two commonly used speech materials in clinical audiology are provided by (a) Studebaker et al. (1993) for the NU-6 words and (b) Sherbecoe and Studebaker (2002, 2003) for the CST sentences.
The reduction of SII for children as hearing loss increases. Note. The ANSI SII values (black triangles) and desensitized SII values (white squares) are shown for DSL m[i/o] (top panel) and NAL-NL2 (bottom panel).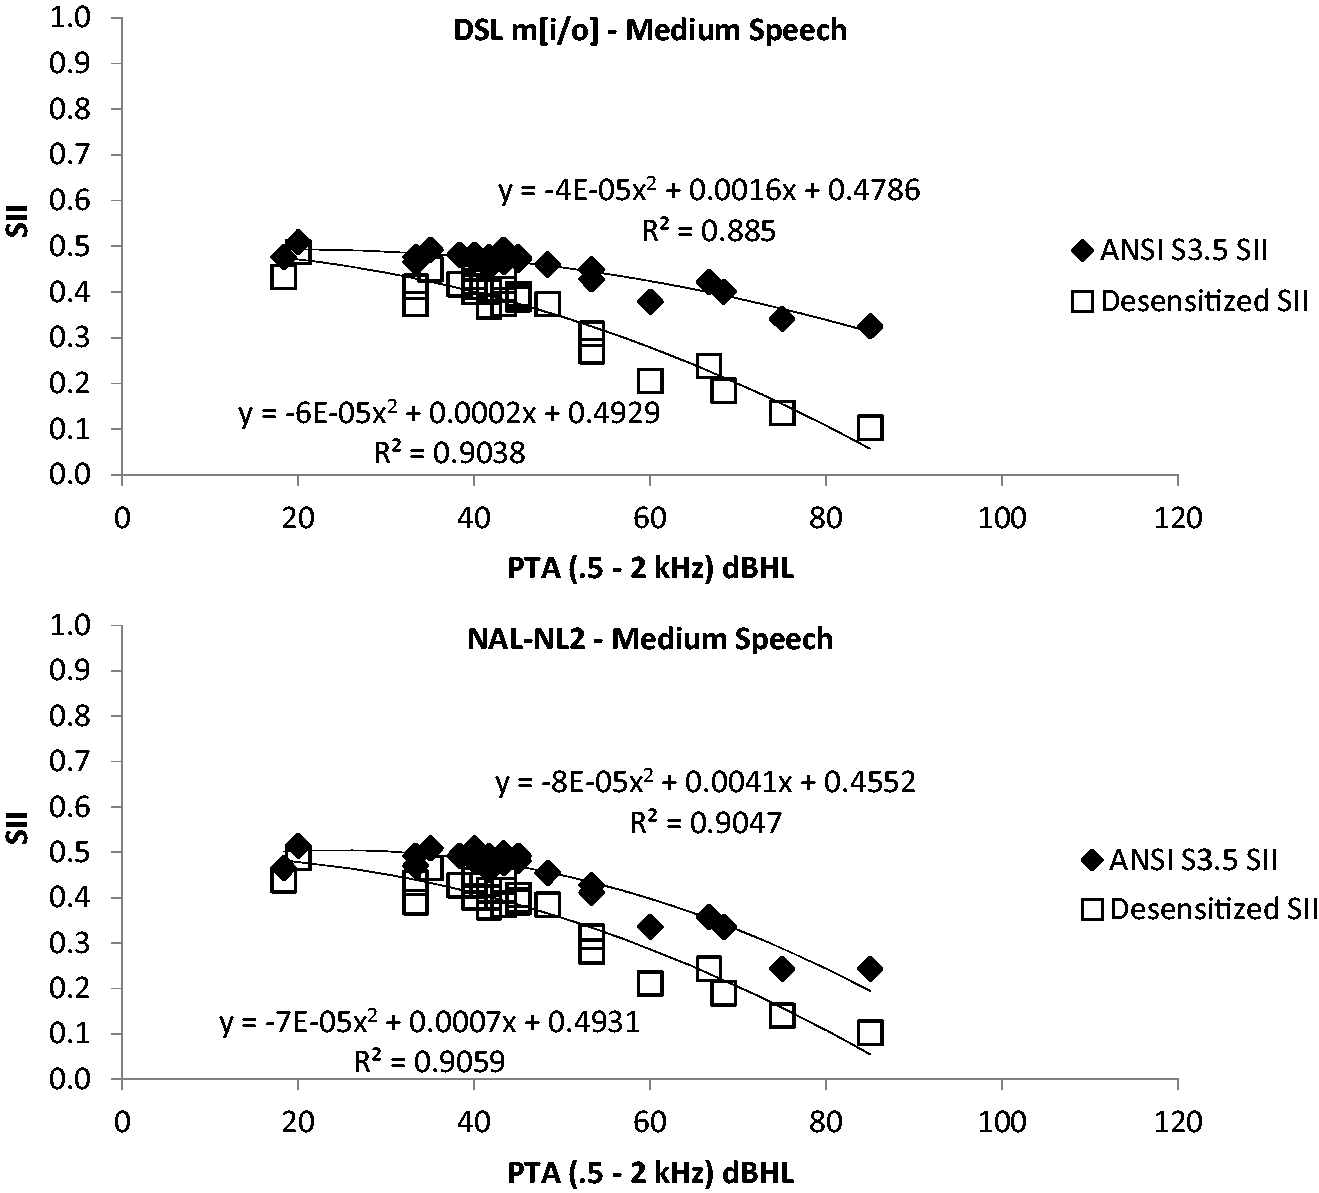
For example, in an auditory-only listening environment, without visual cues, an SII value of 0.5 is expected to lead to percent correct scores of 82% and 93% on the NU-6 and CST, respectively, for the typical listener.
Figure 6 shows the reduction in expected SII values as a result of desensitization compared with no desensitization (ANSI S3.5 SII). From these data (the white squares), realistic expectations are essentially unaffected by the prescription used (i.e., see the similar magnitude and slope of the regression function for both NAL-NL2 and DSL m[i/o] for the desensitized SII data).
High-frequency audibility versus loudness
Plots of the performance for DSL m[i/o] and NAL-NL2 prescriptions for high-frequency audibility versus loudness are shown in the top and bottom rows of Figure 7, respectively. The larger marker points indicate where the average data for amplified low (circle), medium (X), and high (diamond) input levels are located. DSL m[i/o] is shown to have more loudness than NAL-NL2, as the spread of data points span farther along the right end of the abscissa.
Scatterplot of high-frequency audibility versus loudness when compared with the efficient frontier of the normal hearer for children fit with DSL m[i/o] (top panel) or NAL-NL2 (bottom panel). Note. Low, medium, and high refer to the input level of speech. The large symbols are the average of all the low-, medium-, and high-input-level data in accordance to the corresponding symbol shape.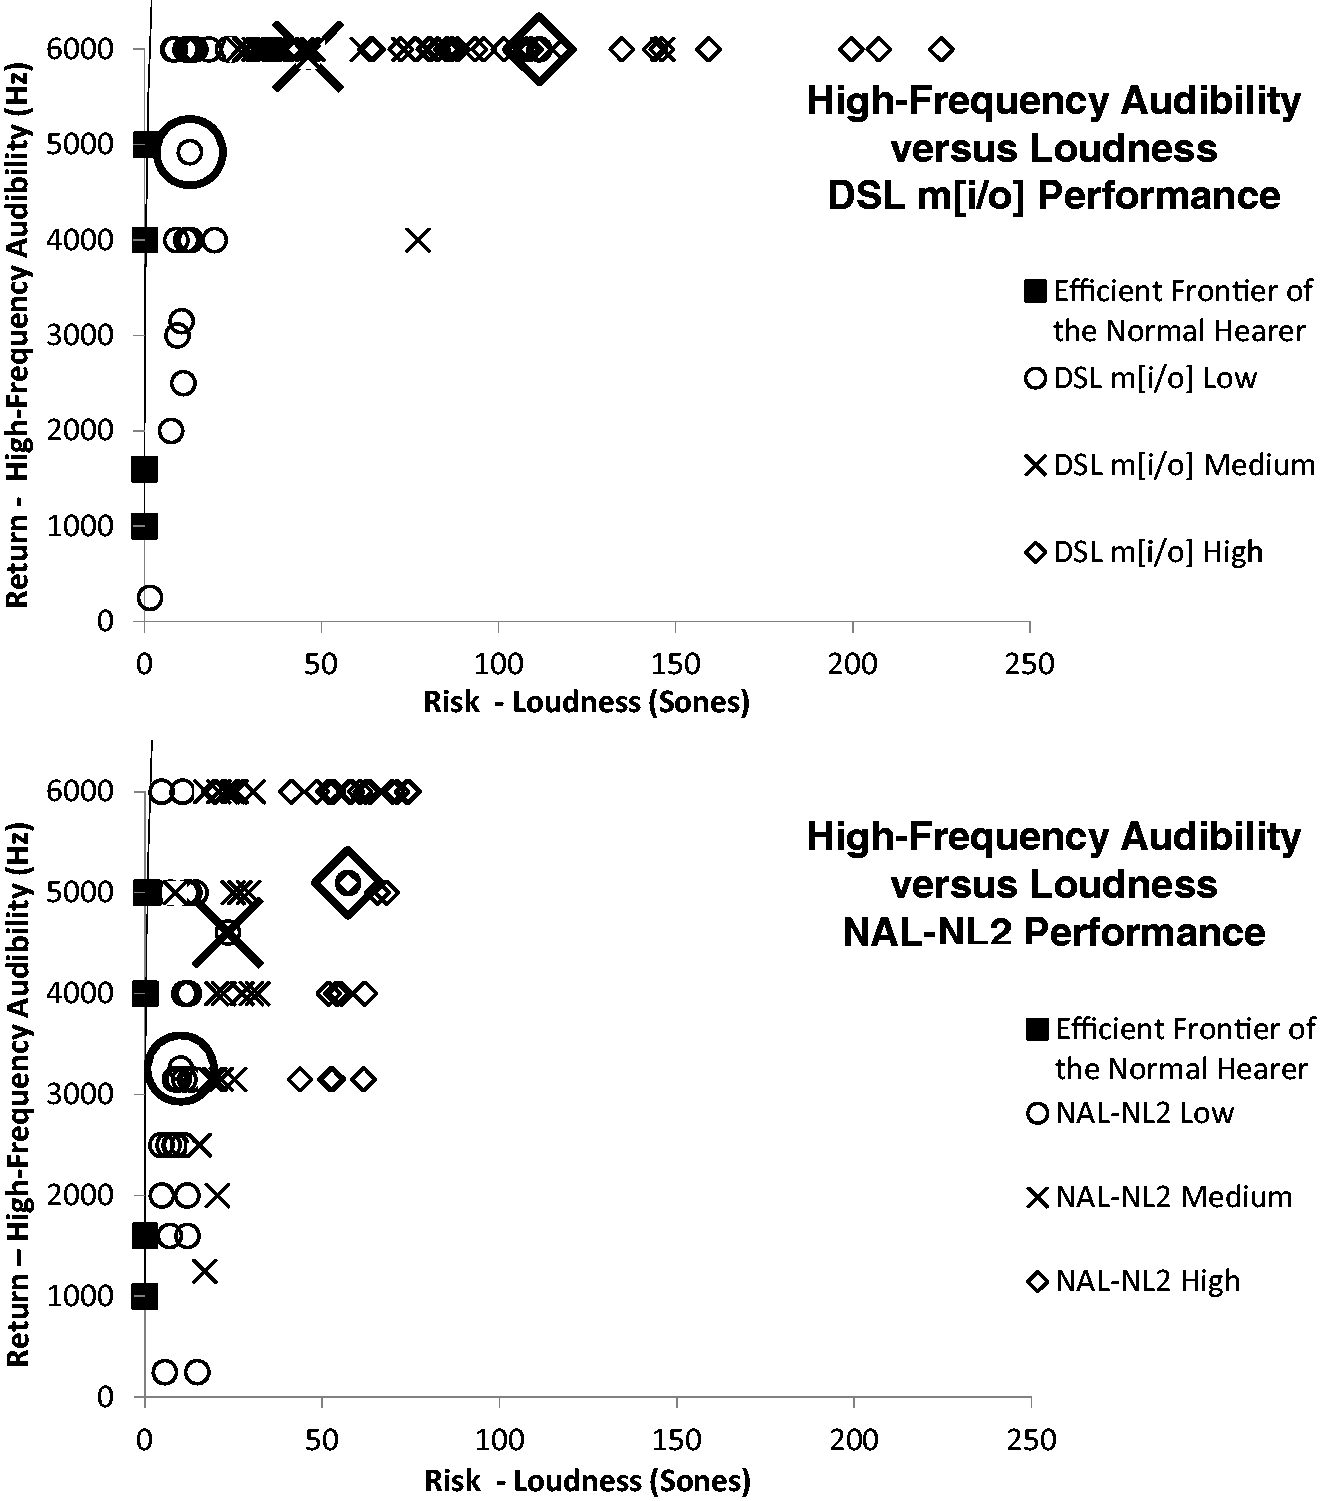
The improved efficiency analysis demonstrated with regard to return of high-frequency audibility for the risk of loudness that DSL m[i/o] has a clear advantage compared with NAL-NL2 (Figure 8). A significant difference in the improved efficiency relative to a 0% difference between the two prescriptions is marked with an asterisk in Figure 8, and the accompanying statistics are found in Table 3. DSL m[i/o] was more efficient for low-, medium-, and high-level speech and when averaged across all three input levels.
The improved efficiency for children fit with DSL m[i/o] when compared with NAL-NL2 in a return versus risk (high-frequency audibility vs. loudness) analysis. Note. The asterisk refers to a statistically significant difference between the two prescriptions in efficiency. t-Test Statistics on Whether the Improved Efficiency Calculation for Return of High-Frequency Audibility Was Better Than No Difference (0%) for the Pediatric Population. Note. All the p values represent significant differences.

Figure 9 is a plot of the high-frequency audibility as a function of the PTA from 2 to 6 kHz for DSL m[i/o] and NAL-NL2 at medium and high speech input levels. The frequency range of 2–6 kHz is used instead of 0.5, 1, and 2 kHz to demonstrate the correlation, or lack thereof, between hearing loss at the high frequencies and high-frequency audibility with DSL m[i/o]. The data are reflective of one major goal of DSL m[i/o], which is to maximize the high-frequency audibility, no matter the severity of hearing loss, whereas NAL-NL2 will intentionally not prescribe high-frequency audibility as hearing loss increases because of the desensitized predictions that audibility in these cases would not increase SII calculations.
The amount of high-frequency audibility as a function of PTA for children fit with either the DSL m[i/o] (top panels) or NAL-NL2 (bottom panels) at medium-(left column) and high-(right column) input levels.
Adult Selection
SII versus loudness
Plots of the performance for DSL m[i/o] and NAL-NL2 prescriptions for SII versus loudness are reported in Figure 10, top and bottom, respectively. The left panels plot the ANSI SII values on the ordinate axis, and the right panels plot the desensitized or reduced SII values on the ordinate axis. The larger marker points indicate where the average data for amplified low (circle), medium (X), and high (diamond) input levels are located. DSL m[i/o] is shown to have greater loudness than NAL-NL2, as the spread of data points span further along the right of the abscissa.
Scatter plot of SII versus loudness when compared with the efficient frontier of the normal hearer for adults fit with DSL m[i/o] (top panels) or NAL-NL2 (bottom panels). Note. Low, medium, and high refer to the input level of speech. The large symbols are the average of all the low-, medium-, and high-input-level data in accordance to the corresponding symbol shape.
Improved efficiency analysis demonstrated, with regard to return of SII for the risk of loudness, that NAL-NL2 has a significant advantage compared with DSL m[i/o] (Figure 11). This finding was evident for both the ANSI SII (black bars) and the desensitized SII (white bars). A significant difference in the improved efficiency relative to a 0% difference between the two prescriptions is marked with an asterisk in Figure 11, and the accompanying statistical analyses are found in Table 4.
The improved efficiency for adults fit with NAL-NL2 when compared with DSL m[i/o] in a return versus risk (SII vs. loudness) analysis. Note. The asterisk refers to a statistically significant difference between the two prescriptions in efficiency. t-Test Statistics on Whether the Improved Efficiency Calculation for Return of SII Was Better Than No Difference (0%) for the Adult Population. Note. All the p values represent significant differences.

To demonstrate the impact of SII values on percent correct scores for speech, transfer functions for the two commonly used speech materials in clinical audiology, that is, NU-6 (Studebaker et al., 1993) and CST (Humes, 2002; Sherbecoe & Studebaker, 2002, 2003), were used. The estimated percent correct score for each audiogram (unaided, aided with DSL m[i/o], and aided with NAL-NL2) is plotted as a function of the 0.5 -, 1 -, 2-kHz PTA (Figure 12). The NU-6 predictions are shown in the top panels, and the CST predictions are shown in the bottom panels. The left panels include the predictions based on the ANSI SII values, and the right panels include the predictions based on the desensitized SII. Hence, the benefit from amplification for speech in quiet can be visualized. In general, the plots indicate that percent correct predictions are better for the DSL m[i/o] prescription than the NAL-NL2 prescription when the PTA exceeds approximately 60 dB HL. When the predictions are desensitized (Figure 12, right) for increasing hearing loss, however, the expected performance with the two prescriptions is equivalent.
Scatterplot of percent correct scores with (right column) and without (left column) desensitization as a function of PTA for adults fit with DSL m[i/o] (squares) or NAL-NL2 (circles) on both the NU-6 (top row) and CST (bottom row) speech material.
Figure 13 (with second-order polynomial regression lines) is reflective of the fact that with increasing hearing loss, even when aided with well-validated generic prescriptions, individuals are expected to have decreased performance abilities to recognize speech. Again, this concept is often generalized to realistic expectations counseling for hearing aids in clinical practice, but usually without any quantified reference. Realistic expectations appear to not be affected by the prescription used (i.e., see the similar slopes for both NAL-NL2 and DSL m[i/o] for the desensitized SII data). Also, visually evident is the reduction in expected SII values as a result of assumed desensitization compared with no desensitization (ANSI S3.5 SII). Similarity of the slopes for the pediatric data is also noted in Figure 6 and the adult data in Figure 13, suggesting that the decrement to realistic expectations with increasing hearing loss would be similar with both populations. The overall reduction in performance for the pediatric data compared with the adult data here is the use of the age-related proficiency factor of Scollie (2008) in pediatric data calculations.
The reduction of SII for adults as hearing loss increases. Note. The ANSI SII values (black triangles) and desensitized SII values (white squares) are shown for DSL m[i/o] (top panel) and NAL-NL2 (bottom panel).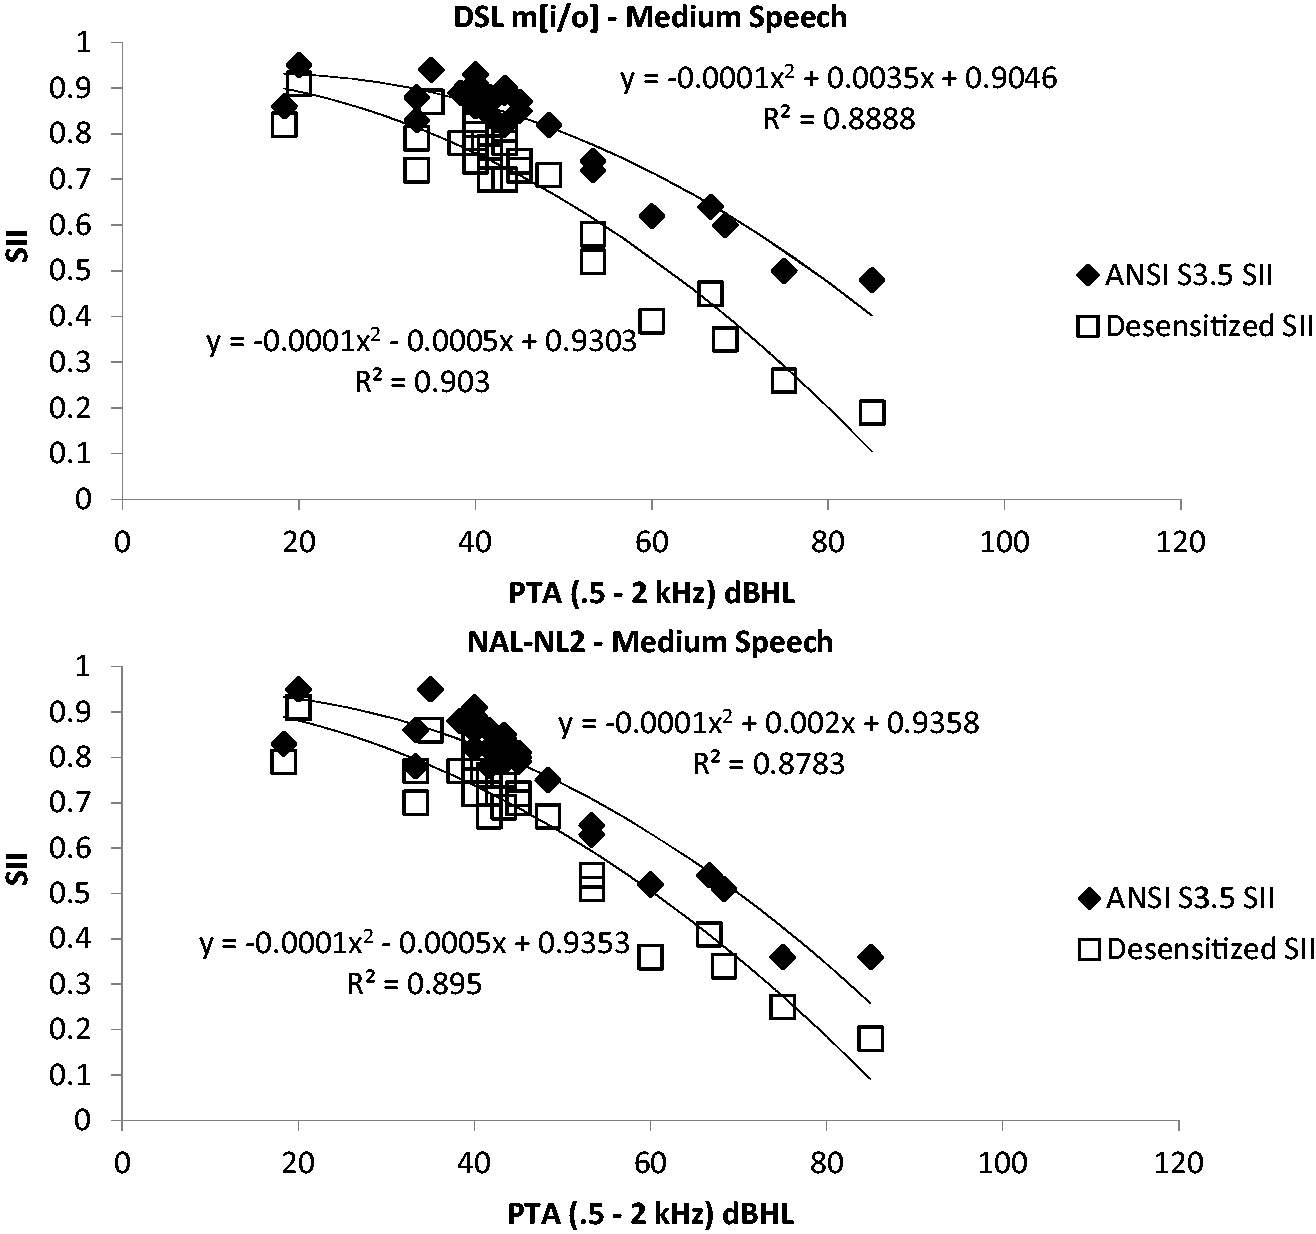
High-frequency audibility versus loudness
Plots of the performance for DSL m[i/o] and NAL-NL2 prescriptions for high-frequency audibility versus loudness are reported in the top and bottom rows of Figure 14, respectively. The larger marker points indicate where the average data for amplified low (circle), medium (X), and high (diamond) input levels are located. DSL m[i/o] is shown to have more loudness than NAL-NL2 as the spread of data points span farther along the right of the abscissa. A significant difference in the improved efficiency relative to a 0% difference between the two prescriptions is marked with an asterisk in Figure 15, and the accompanying statistics are found in Table 5.
Scatterplot of high-frequency audibility versus loudness when compared with the efficient frontier of the normal hearer for adults fit with DSL m[i/o] (top panel) or NAL-NL2 (bottom panel). Note. Low, medium, and high refer to the input level of speech. The large symbols are the average of either all the low-, medium-, and high-input-level data in accordance to the corresponding symbol shape. The improved efficiency for adults fit with DSL m[i/o] when compared with NAL-NL2 in a return versus risk (high-frequency audibility vs. loudness) analysis. Note. The asterisk refers to a statistically significant difference between the two prescriptions in efficiency. t-Test Statistics on Whether the Improved Efficiency Calculation for Return of High-Frequency Audibility Was Better Than No Difference (0%) for the Adult Population. Note. All the p values represent significant differences.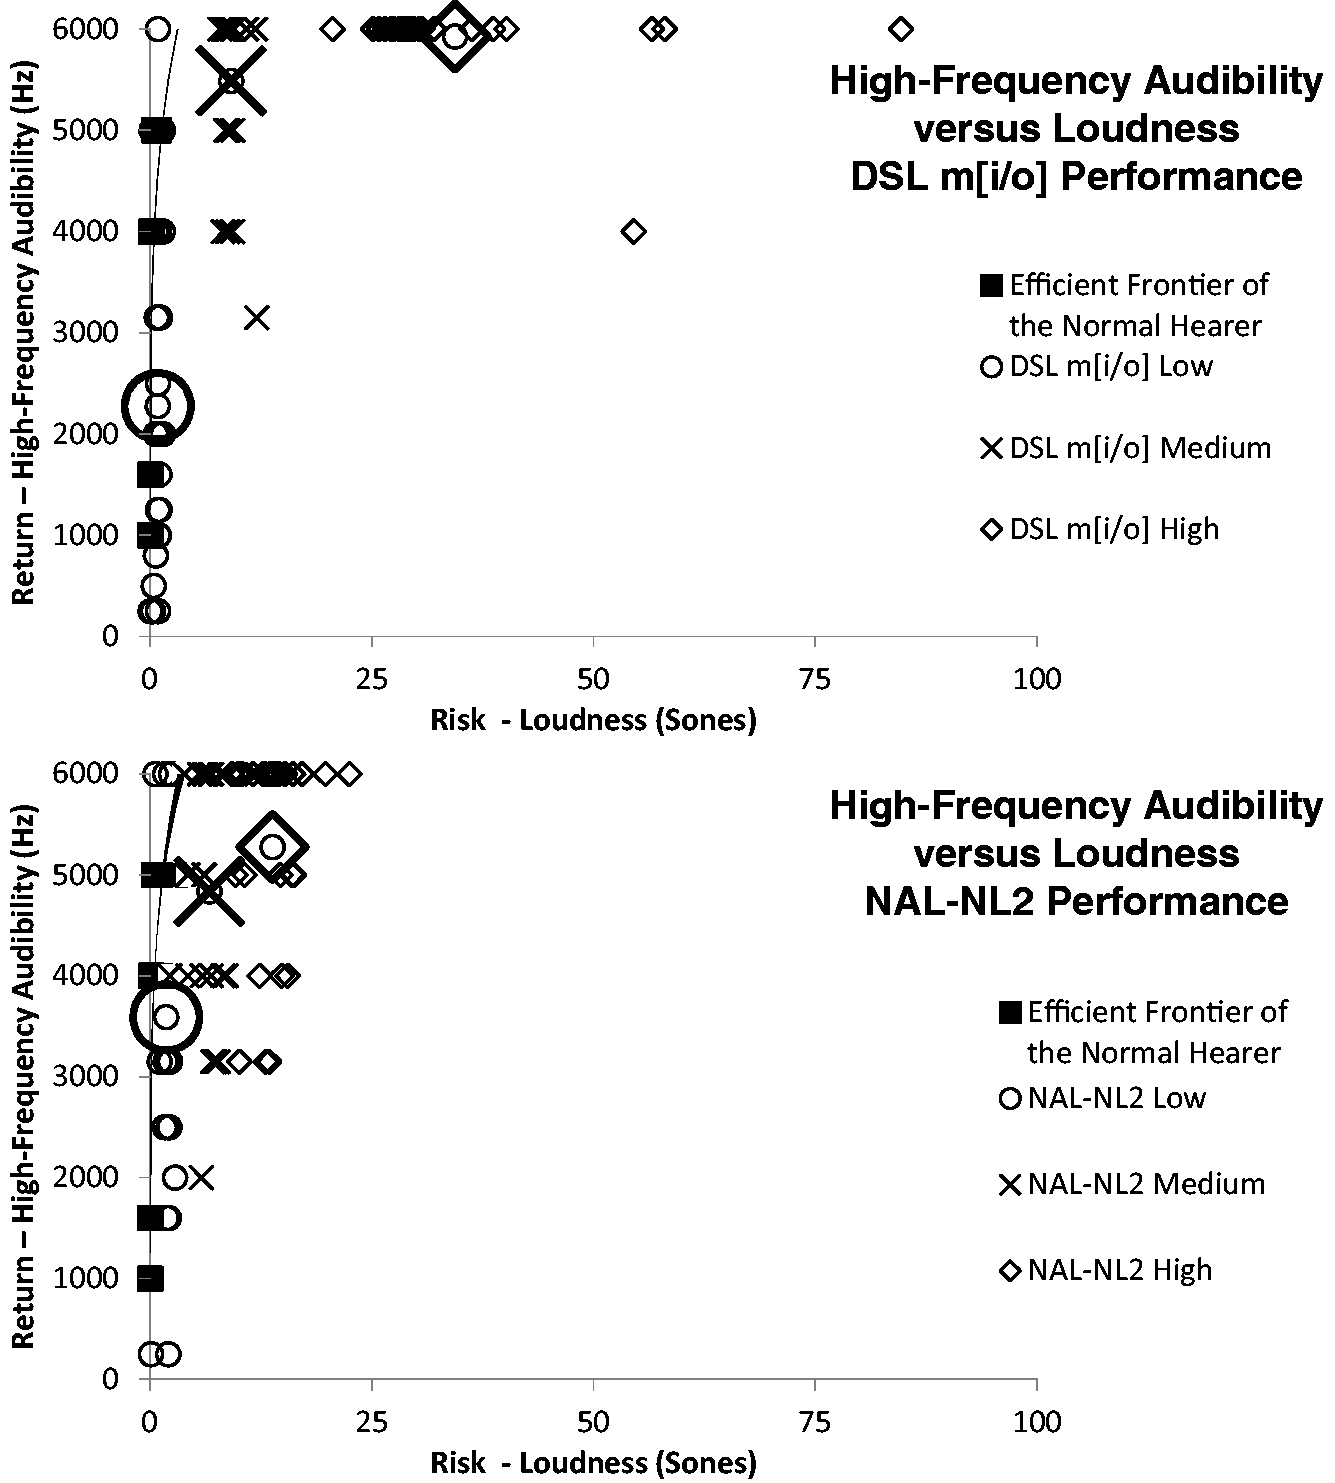


The improved efficiency analysis demonstrated, with regard to return of high-frequency audibility for the risk of loudness, that DSL m[i/o] has a significant advantage over NAL-NL2 at medium and high input levels (Figure 15). However, for the low input level, NAL-NL2 is more efficient. Interestingly, the efficiency advantage for NAL-NL2, in this case at the low input level, appears to stem from less, presumably an unintentional, return of high-frequency audibility for DSL m[i/o]. On average, DSL m[i/o] only prescribed high-frequency audibility through 2,275 Hz and for 4 of the 27 audiograms prescribed no RMS audibility at any frequency for adults at the soft input level. However, NAL-NL2 has, on average, high-frequency audibility through 3591 Hz (i.e., the only time NAL-NL2 has more high-frequency audibility than DSL m[i/o]).
Figure 16 is a plot of the high-frequency audibility as a function of the PTA from 2 to 6 kHz. The frequency range of 2 to 6 kHz is used instead of 0.5, 1, and 2 kHz to demonstrate the correlation between hearing loss at the high frequencies and high-frequency audibility. The data are reflective of one major goal of DSL m[i/o], which is to maximize the high-frequency audibility, no matter the severity of hearing loss, whereas NAL-NL2 will intentionally not prescribe high-frequency audibility as hearing loss increases because of the desensitized predictions that audibility in these cases would not be useful to speech understanding. Also noted is the similarity of the slope values between the pediatric data in Figure 9 and the adult data in Figure 16, suggesting that the recommended high-frequency audibility of both prescriptions is maintained for both patient populations.
The amount of high-frequency audibility as a function of PTA for adults fit with either the DSL m[i/o] (top panels) or NAL-NL2 (bottom panels) at medium (left column) and high (right column) input levels.
Discussion
Pediatric Selection
These results clearly demonstrate the efficiency advantage of NAL-NL2, compared with DSL m[i/o] for the SII, and of DSL m[i/o], compared with NAL-NL2, for the high-frequency audibility. The reduction in predicted SII for both prescriptions with increasing hearing loss was also apparent. With regard to increasing hearing loss and high-frequency audibility, the DSL m[i/o] prescription continued to prescribe audibility as hearing loss increased, whereas NAL-NL2 provided less high-frequency audibility with increased hearing loss because of its use of the desensitization factor.
Adult Selection
The efficiency advantage of NAL-NL2 compared with DSL m[i/o] for predicted SII is evident for the adult population. In contrast, for high-frequency audibility, DSL m[i/o] compared with NAL-NL2 reveals an efficiency advantage for medium and high input level speech input. Also, a reduction in predicted SII occurred for both prescriptions with increased hearing loss. With regard to increasing hearing loss and high-frequency audibility, the DSL m[i/o] prescription continued to prescribe audibility as hearing loss increased, whereas NAL-NL2 provided less high-frequency audibility with increased hearing loss, again because of its use of the desensitization factor.
Is the Additional Audibility Prescribed by DSL m[i/o] Useful to Speech Understanding?
Given the additional audibility prescribed by DSL m[i/o] when compared with NAL-NL2, it is reasonable to think that DSL m[i/o] might enable those with greater high-frequency hearing impairment to have additional speech intelligibility benefits. However, desensitization suggests that, at least for the average individual of a given decibels HL impairment, this expectation is not demonstrated in speech recognition scores (Carhart, 1951; Ching et al., 1998, 2011; Pavlovic et al., 1986; Studebaker et al., 1997).
At the same time, any use of a desensitization factor (based on average data) would not necessarily apply to a range of individuals, particularly those individuals with less desensitization than average who presumably might well benefit from a high-frequency extension. Thus, although NAL-NL2 prescribes high-frequency audibility that is expected to maximize SII for the average listener, DSL m[i/o] prescribes a high-frequency audibility that may be optimal for a range of listeners at the cost of additional loudness, which, if unconstrained, could presumably pose a safety risk for noise-induced hearing loss (Macrae, 1994, 1995, 1996).
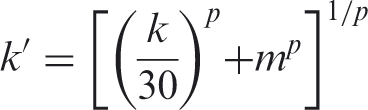
One matter requiring additional inquiry is whether the average desensitization factor assumed by NAL-NL2 is accurate or has been replicated. Ching et al. (2011) reported that the amount of desensitization, which varies as a function of threshold, did not differ and depended on the speech material (e.g., BKB sentences, CUNY words, or VCV syllables). In addition, the authors report on the amount of desensitization as a function of sensation level (dB) across a range of low to high input levels. The function that best represented the amount of desensitization observed was as follows:
Desensitized audibility (k′),


Similarity in Reduction to the Estimated SII Value Between Two Desensitization Factors Each of Which Were Based on Magnitude of Pure Tone Hearing Loss and Derived From Different Study Populations and Speech Materials.

Note. BKB = Bamford-Kowal-Bench; CUNY = City University of New York; VCV = Vowel-Consonant-Vowel.
Decrement to Expected Speech Intelligibility With and Without Desensitization
Figures 5 and 6, as well as Figures 12 and 13, indicate the realistic expectations regarding speech intelligibility across a range of individuals with increasing PTA when fit to prescriptive recommendations (using hearing aids providing no SNR improvement—an omnidirectional microphone). If desensitization did not occur (direct ANSI SII) with increasing hearing loss, then the expected percent correct scores for individuals with severe hearing loss will be better than 50% (with an advantage to the DSL m[i/o] prescription, as shown in the left panels of Figures 5 and 12). However, because desensitization does have an impact, at least to some extent, with increasing hearing loss, percent correct scores will be below 50% for the word level and sentence speech material (right panels of Figures 5 and 12). As such, in Figure 6 and 13, the desensitized SII estimates reveal similar negative slopes (decrements to SII with increasing hearing loss), regardless of the prescription. The similar negative slopes imply that the reduction in expected speech intelligibility with increasing hearing loss is not impacted by the selection of prescription. More importantly, the negative slopes convey the often vague notion that those with sensorineural hearing impairment should have realistic expectations regarding how well they will hear with hearing aids, particularly as hearing loss decreases.
Using the second-order polynomial regression equations in Figures 6 and 13, a clinician can very simply approximate the predicted SII for any given PTA and then use a transfer function to predict average realistic expectations of percent correct scores for speech recognition in quiet for hearing aids fit to either an NAL-NL2 or a DSL m[i/o] prescription. The equations can be thought of as similar to an approximation of the more complex calculation of a complete SII procedure involving some 8 steps and 15 variables in each of 18 one-third octave bands (i.e., some 2,160 separate calculations) according to ANSI S3.5-1997 (R2007) description. In essence, the SII approximation operates in a similar principle to the Born–Oppenheimer approximation commonly known in Physics (i.e., two less complicated consecutive steps to simplify Schrödinger’s partial differential eigenvalue equation of 162 variables for computation of the energy and wave function of an average-sized molecule). The approximated SII is, for most practical clinical purposes, similar to the SII had the much more precise version of 2,160 calculations been used.
To further demonstrate the accuracy of the approximation to data and calculations beyond the study sample, the following information is presented. Stiles, Bentler, and McGregor (2012) reported that children fit with hearing aids having an aided auditory-only ANSI SII value of 0.65 or higher had better receptive vocabulary outcomes than children with less audibility or lower SII. McCreery (2013) reported on the Pediatric Audiological Monitoring Protocol normative range for the DSL m[i/o] prescription and indicated that children with up to an 80-dB PTA had an SII of 0.65 when the targets are achieved. In the accompanying software application to this article, for DSL m[i/o], an 80-dB PTA, and assuming the ANSI S3.5-1997 (R2007) full contributions of audibility to speech intelligibility (e.g., Stiles et al., 2012), the SII approximation yields the exact same 0.65 SII value. It should be noted, however, that when the principles of desensitization are applied to the SII calculation, the effective SII may in actuality be only about 0.35. This means that audibility and effective audibility are not one and the same and should not to be regarded as interchangeable terms when speaking of contributions to intelligibility. In turn, the realistic expectation of speech recognition percent correct performance for an SII of 0.65 and 0.35 are also not the same.
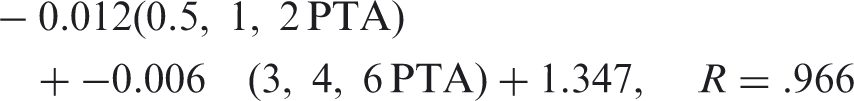
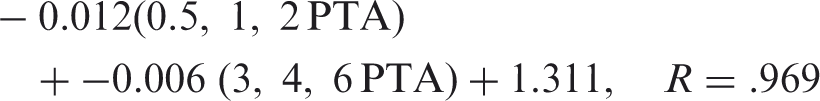
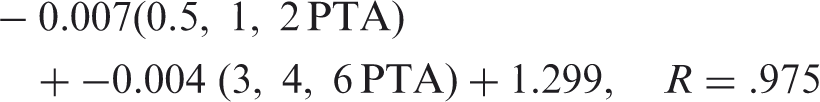
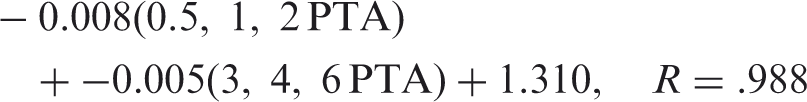
With regard to the PTA (at 0.5, 1, and 2 kHz) approximation of SII, it must be acknowledged that the configuration of the 27 losses used was of a typical sloping nature (i.e., worse sensitivity in the high frequencies than in the low frequencies). The approximations presented may not apply with the same accuracy to rising hearing loss configurations where hearing sensitivity is poor through 2 kHz and then within normal limits above 2 kHz. To address this issue, as well as to improve on SII approximations with various hearing loss configurations, high-frequency PTA (at 3, 4, and 6 kHz) was included in further equation development. Squaring the reported R values and averaging across all equations presented, the equations recover 94.6% of the variability in SII due to hearing loss, age, prescription, and speech recognition model. The improved equations relating hearing loss thresholds to SII were as follows:
Unaided
Adult, ANSI SII
Adult, Desensitized SII
Ped-3 years, ANSI SII
Ped-3 years, Desensitized SII
Aided
Adult, NAL-NL2, ANSI SII
Adult, NAL-NL2, Desensitized SII
Adult, DSL m[i/o], ANSI SII
Adult, DSL m[i/o], Desensitized SII
Ped-3 years, NAL-NL2, ANSI SII
Ped-3 years, NAL-NL2, Desensitized SII
Ped-3 years, DSL m[i/o], ANSI SII
Ped-3 years, DSL m[i/o], Desensitized SII


Clinical Access to Realistic Expectation Estimates
Speech recognition in quiet
To facilitate the use of these equations and realistic expectation calculations for speech understanding estimates in quiet, a software program has been created with a graphical user interface (see article accompanied.exe file). Floor and ceiling limits have been placed on the calculations to keep SII predictions in the range of 0 to 1.0 and percent correct scores in the range of 0% to 100%. Also, aided calculations are set to always equal or exceed unaided calculations at extreme limits of the equation predictions. SII and percent correct scores are generated from the entry of 0.5 -, 1 -, and 2-kHz PTA thresholds and the 3 -, 4 -, and 6-kHz PTA thresholds for different ages, prescriptions, and speech intelligibility models with the simple click of radio buttons. If desired, the age proficiency factor of Scollie (2008), across age range of 3 to 100, may be used to modify the SII approximation. Because clinicians and researchers may also be interested in making predictions regarding the presence of visual cues to the listener, auditory–visual (AV) SII predictions are also made available per the ANSI S3.5-1997 (R2007) equations.


The SAV values are then transformed to percent correct scores using the aforementioned NU-6 and CST transfer functions.
As an example, for a 0.5 -, 1 -, and 2-kHz PTA of 50 dB HL and 3 -, 4 -, and 6-kHz PTA of 90 dB HL based on desensitized SII values and appropriate transfer functions, unaided percent correct scores for an adult listening to NU-6 and CST speech materials without visual cues (i.e., auditory only) is 20.4% and 3.3%, respectively, for an SII of 0.17. The NAL-NL2 aided percent correct scores are 75.3% and 86.6% correct for the NU-6 and CST, respectively, for a desensitized SII of 0.44. The DSL m[i/o] aided percent correct scores are also 77.8% and 89.2% correct for the NU-6 and CST, respectively, for a desensitized SII of 0.46. Caution is warranted to prevent interpreting the approximations as the ability of one prescription to outperform the other prescription, particularly, when small SII differences of less than 0.05 are present.
The intent of the calculations is to afford both the hearing health-care professional and the patient a realistic expectation of aided performance and benefit from hearing aids and not an absolute prediction. Moreover, the predictions do not consider intrinsic factors of the patient, but instead the extrinsic variables of hearing loss, amplification, and our current understanding of modeling speech recognition. These approximations are acknowledged as based on the highly specified typical or highly specified average individual; if the patient has other characteristics (e.g., poor word recognition abilities and cognitive decline), obtained performance and benefit may be worse than expected. At the same time, some individuals may be able to outperform these expectations. Therefore, although the realistic expectations are highly specified based on hearing loss severity and configuration, age, prescription, and the speech recognition model, the expectations are, nonetheless, still approximations.
Apparent from comparisons of the SII data via alternating the traditional and revised speech recognition model in the software, the great equalizer of realistic expectations with the two prescriptions is the HLD factor in the revised SII model. In other words, under the assumptions of the traditional ANSI SII model (i.e., any audibility is useful), DSL m[i/o] appears to offer superior speech recognition compared with NAL-NL2. But, with the revised SII model including desensitization, the two prescriptions are essentially equivalent for speech recognition. Rather than focusing just on modeled speech recognition, the return of speech recognition and high-frequency audibility for the risk of loudness to create a measure of efficiency (as presented in the article) is suggested as the more viable means for differentiating the utility of each prescription.
Speech recognition in noise
From both the unaided and aided NU-6 percent score, SNR loss estimates were derived with a transfer function based on collected data published in Figure 8 of Wilson (2011). As a slight improvement to the transfer function published as a second-order polynomial with an R2 value of .61, which used only the higher NU-6 score in quiet of two presentation levels to predict the 50% correct Words-in-Noise (WIN) test SNR, the low-frequency (0.5, 1, and 2 kHz) and the high-frequency (3, 4, and 6 kHz) PTA were added as additional predictor variables. All three variables were identified as significant nonredundant predictors of the WIN thresholds, with an overall R value of .80 accounting for 64% of the variance (i.e., R2 = .64). The 50% correct WIN threshold was given by the following approximation equation:

The expected change to SNR loss based on additional hearing aid technology components is approximated based on previous works (Hawkins, 1984; Pittman, Lewis, Hoover, & Stelmachowicz, 1999; Ricketts, 2000). Specifically, from Figure 7 of Ricketts (2000), a first-order directional microphone provided a 4-dB SNR advantage compared with an omnidirectional microphone, on average, in a hearing aid with no venting. Increasing vent size from 1 mm to 2 mm to an open ear canal lead to smaller SNR advantages of 3.6, 3.2, and 2.4 dB, respectively. Or, stated differently, the increasing vent sizes lead to a reduction in the SNR advantage by 10%, 20%, and 40%, respectively.
Bilateral first-order directional hearing aid microphones, which share their SNR advantage wirelessly with one another, result in about a 7-dB SNR advantage. A classic FM system or wireless remote microphone when combined with a directional (also known as environmental) hearing aid microphone results in about a 10-dB SNR advantage, whereas a classic FM system or wireless remote microphone in isolation, without the degradation of an environmental hearing aid microphone, provides the most SNR advantage of about 15 dB. The software allows for any combination of these hearing aid technology components and venting to provide a realistic expectation of speech recognition in noise.
Concluding Remarks
Results from this study suggests, on average, that the additional audibility provided by DSL m[i/o] would not significantly increase speech understanding, because the amount of desensitization assumed by NAL-NL2 is providing accurate predictions concerning the use of high-frequency audibility. Presumably, there may be select individuals with sensorineural loss that may have significantly less desensitization than average (based on hearing loss in decibels HL). These individuals may gain additional speech intelligibility benefits from an extension of audibility to the high frequencies beyond what would be prescribed by NAL-NL2.
In 2003, based on large U.S. National Institutes of Health and Veteran Affairs funded studies, Humes reported that audibility reduces the largest portion of the variability in hearing aid outcome components, explaining almost half the total variance (i.e., of the 65% on speech recognition performance outcome component that could be accounted for approximately two thirds of that [45%] was from audibility). Audibility versus effective audibility was not parsed out as part of the study. Only subjective sound quality could explain 7% of the subjective benefit/satisfaction outcome component and hearing aid experience could explain 15% of hearing aid usage outcome component.
In general, DSL m[i/o] seeks to maximize audibility, while considering loudness comfort. NAL-NL2 seeks to maximize speech intelligibility with the most amount of effective audibility to control/limit loudness. As such, both prescriptions address audibility but in different ways. In general, DSL m[i/o] just provides more audibility than NAL-NL2. One potential limitation with the use of desensitization by NAL-NL2 is that some patients, with less desensitization than average for their pure tone hearing loss, may not receive audibility at frequencies with the most hearing loss, which perhaps could be used effectively. Such realities are a result of designing prescriptions for all patients with the risk of excessive loudness (i.e., DSL m[i/o]) or for average patients with constrained loudness (i.e., NAL-NL2).
Hearing health-care professionals in clinical practice need a better way to decide which patients should receive which prescription. The prescription received could be one analyzed within this study, or, perhaps, even other properly verified prescriptions not examined in the current study (e.g., other generic prescriptions or manufacturer-derived prescriptions). The wording of properly verified is used because Abrams et al. (2012) demonstrated that experienced hearing aid wearers using a verified generic prescription (i.e., NAL-NL1) have better self-perceived benefit as measured by the APHAB than when a manufacturer’s initial-fit software programming only approach was used.
There are likely many suitable prescriptions for any individual listener. Johnson (2012) used a calculation, known as Drake’s equation, to estimate the number of suitable hearing aid gain frequency responses (prescriptions), via examination of the product of a restrictive series of fractional values from a number of estimated possibilities. These calculations indicated that there may be least 1,430 optimal gain–frequency responses (prescription alternatives) for any individual listener. In 16-channel hearing aids capable of 70 dB gain, 417 octillion frequency responses are possible and the odds of finding any one of these optimal responses, even with good guessing based on clinical experience is less than 1 in 291 septillion (Johnson, 2012). Therefore, prescription of a single frequency response is very selective and helps hearing health-care professionals identify an appropriate, evidence-based frequency response selection. The notion of a singular frequency response recommended by a given prescription, however, may be excessively presumptive. Certainly, we know that patients express a wide range of preference for not only frequency response but also overall gain (volume). Hence, when prescriptions are used, instead of the common clinical approach which is that one prescription is somehow regarded as superior to other prescriptions and, in many cases, applied to age-specific populations (e.g., DSL m[i/o] for pediatric patients and NAL-NL2 for adult patients), clinical decisions on the use of a particular prescription or prescriptions could be based on the following two proposals which compare allow for comparison of prescription alternatives.
The first, and perhaps better of the two proposals, relies on the practicality and face validity of the comparative approach method (Carhart, 1946) for the fitting of hearing aids using paired comparisons of sound quality (Kuk, 1994; Kuk & Lau, 1995; Thurstone, 1927a, 1927b). In this proposal, alternative prescriptions would be presented to patients in a paired comparison approach, to determine whether a sound quality preference for one prescription over another is present.
The paired comparison process has generally been regarded as too lengthy for clinical feasibility. Simplification of the paired comparison process using binomial probability statistics (Kuk & Lau, 1995), however, is sufficient and timely (less than 5 min) to ensure that a patient is fit with a repeated preference between two assumed equivalent alternatives (i.e., Sound Impression Measurement Procedure of a Listening Experience; Brown & Johnson, 2013; Light & Johnson, 2013). With 10 comparisons, eight repeated choices are a significant preference at p < .05. At least 10 comparisons are recommended for good sensitivity and specificity to gold-standard paired comparison methodology (i.e., strength of preference ratings with nonparametric Wilcoxon signed-rank test; Brown & Johnson, 2013; Light & Johnson, 2013). Such a recommendation for numerous comparisons is consistent with the long ago recommendations of Zerlin (1962) and Punch and Parker (1981).
The second proposal is a direct assessment approach to determining whether additional high-frequency audibility actually results in better speech recognition. In essence, a clinician could create a high-pass filter at the last point of high-frequency audibility (i.e., the frequency where peak sensation levels are negative) with an NAL-NL2 prescription and evaluate the percent correct performance of a patient within the high-pass filter. Using a 25-word list, if performance is greater than 8%, because performance should be 0% given correctly assumed desensitization by NAL-NL2 for the magnitude of hearing loss, then a clinician could conclude that the patient benefits from the additional high-frequency audibility (i.e., a prescription like DSL m[i/o]). This is how the Thorton and Raffin (1978) article was intended for use—to compare speech recognition difference scores for statistical significance.
In a review of the comparative approach (Carhart, 1946), an 8% difference in compared alternatives was advocated as the difference when one alternative could be determined as better than another alternative. Now the comparative approach definition of an 8% difference as being significant can be merged with the binomial variable model of speech discrimination scores by Thorton and Raffin (1978). That is, a difference of 8% or more when the difference should have been 0% (i.e., no improvement to speech recognition with more audibility than NAL-NL2) allows for the comparative approach and the Thorton and Raffin article to be used in concert with one another. Their merging creates a defensible position for comparing prescriptive alternatives based on speech recognition scores again. This merging is unexpected because the Thorton and Raffin article is often known as leading to the demise of the comparative approach (e.g., see Sammeth & Levitt, 2000, for a review). Instead, the Thorton and Raffin article has just supported the potential return of the comparative approach, and its original, intended focus on speech recognition, to prominence as well.
As was demonstrated by Thorton and Raffin (1978), the use of more than 25 words (i.e., a full 50-word list) may be beneficial to detect smaller statistically significant differences. The high-frequency emphasis lists on the Quick Speech-In-Noise test were designed with the same idea in mind (i.e., to determine the usability of audible high-frequency amplification; Killon, Niquette, Gudmundsen, Revitt, & Banerjee, 2004), but experiments have never high-pass filtered the test material with specific consideration of the NAL-NL2 recommendation for individuals with hearing impairment.
Footnotes
Summary
This investigation has demonstrated the theory and expected returns (i.e., SII and high-frequency audibility) of two common generic prescriptions versus expected risk (loudness). The return versus risk trade-off was subsequently reported as a measure of efficiency compared with the efficient frontier of a modeled individual with normal hearing. The efficient frontier of the normal hearing is expected to have further applications beyond just prescriptions as engineering and technology improvements to the SNR provides a possibility that individuals with mild-to-moderate sensorineural hearing impairment (i.e., have small amounts of desensitization) may be able to outperform normal hearing listeners in adverse speech-in-noise listening environments. As such, MPT can indicate by how much these aided listeners are surpassing the efficient frontier of listeners with normal hearing sensitivity.
Authors’ Note
The high-frequency audibility data were collected as part of an East Tennessee State University Au.D. Capstone Project by Jennifer Trammell and presented at the 2013 Joint Department of Defense and Veterans Affairs Conference in Nashville, TN.
Declaration of Conflicting Interests
The authors declared no potential conflicts of interest with respect to the research, authorship, and/or publication of this article.
Funding
The author(s) disclosed receipt of the following financial support for the research, authorship, and/or publication of this article: This article was supported, in part, by a Career Development Award-1 granted to the author and additional mentors, Richard Wilson, PhD; Harvey Dillon, PhD; and Todd Ricketts, PhD, by the U.S. Department of Veterans Affairs Rehabilitation Research and Development Office.
Disclaimer
The opinions expressed in this article are those of the authors and do not necessarily represent the official position of the U.S. Department of Veterans Affairs or the United States Government.
Acknowledgments
The author thanks Ben Hornsby, PhD, for allowing the use and modification of an excel spreadsheet implementing the ANSI S3.5 (1997) standard for calculating the Speech Intelligibility Index taught in an AUD 5377—Hearing Loss and Speech Understanding course at Vanderbilt University.
References
Supplementary Material
Please find the following supplemental material available below.
For Open Access articles published under a Creative Commons License, all supplemental material carries the same license as the article it is associated with.
For non-Open Access articles published, all supplemental material carries a non-exclusive license, and permission requests for re-use of supplemental material or any part of supplemental material shall be sent directly to the copyright owner as specified in the copyright notice associated with the article.