
Abstract
This study examined verbal response times—that is, the duration from stimulus offset to voice onset—as a potential measure of cognitive load during conventional testing of speech-in-noise understanding. Response times were compared with a measure of perceived effort as assessed by listening effort scaling. Three listener groups differing in age and hearing status participated in the study. Testing was done at two target intelligibility levels (80%, 95%) and with two noise types (stationary and fluctuating). Verbal response times reflected effects of intelligibility level, noise type, and listener group. Response times were shorter for 95% compared with 80% target intelligibility, shorter for fluctuating compared with stationary noise, and shorter for young listeners compared with older listeners. Responses were also faster for the older listeners with near normal hearing compared with the older hearing-aid users. In contrast, subjective listening effort scaling predominantly revealed effects of target intelligibility level but did not show consistent noise-type or listener-group effects. These findings show that verbal response times and effort scalings tap into different domains of listening effort. Verbal response times can be easily assessed during conventional speech audiometry and have the potential to show effects beyond performance measures and subjective effort estimates.
Introduction
The traditional approach to assessing hearing abilities by means of audiometry is by measuring task accuracy, such as the amount of words recognized correctly. However, with the upcoming of the concept of listening effort, it has been realized that there are other aspects to listening-task performance, such as the activation of cognitive resources needed to perform the task. Importantly, this even applies when task performance is high, that is, speech recognition might be close to perfect. Within the FUEL-concept (Framework for Understanding Effortful Listening), Pichora-Fuller et al. (2016) defined effort as “the deliberate allocation of mental resources to overcome obstacles in goal pursuit when carrying out a task.” (p. 5S). Processing resources are limited regarding both capacity and speed (e.g., Kahneman, 1973). In line with this notion, the “ease of language understanding” model (Rönnberg et al., 2013) postulates that adverse listening conditions (such as speech understanding with background noise) require an explicit feedback loop associated with expending working memory capacity and slowing down speech processing, given that the automated implicit processing is insufficient. The result of this activation of cognitive resources is that speech understanding may be maintained at the cost of slower overall processing and less processing capacity for parallel tasks.
The degree of resource activation is influenced by many factors, such as the level of task performance, the listener’s internal motivation to perform the task, and the perceptual difficulty of the listening situation. The degree of resource activation can be assessed in different ways. Generally, there are three types of assessment methods, that is, self-report, behavioral, and physiological assessments (see McGarrigle et al., 2014). Overall, only weak associations between subjective self-reports and objective measurements, both behavioral and physiological, have been observed (e.g., Gosselin & Gagné, 2011; Larsby, Hällgren, Lyxell, & Arlinger, 2005). This points toward a difference in constructs assessed by the different measures (for a discussion see Lemke & Besser, 2016). Briefly, it can be assumed that these constructs either represent perceived effort or actual cognitive processing load in terms of resource activation, which are not necessarily identical: A situation can be perceived as effortful though cognitive load is relatively low and vice versa.
Regarding behavioral measures, there are two broader categories, that is, dual-task and single-task approaches. Both build on the assumption that processing resources are limited. In dual-task behavioral assessments of cognitive processing load during listening, listeners perform two tasks simultaneously or in an interleaved manner, such as responding as accurately and fast as possible to a visual or tactile stimulus while listening to and repeating back words presented during a speech-recognition test (for an overview see Gagné, Besser, & Lemke, 2017). One of the tasks—the primary task—is assigned the higher priority, whereas the other task—the secondary task—receives lower priority. The theoretical assumption is that listeners prioritize the primary task under any circumstances and keep resource allocation to the primary task constant across all test conditions. Accordingly, the amount of resources available for performing the lower priority secondary task changes along with the processing demands of the primary task. That is, if the test condition of the primary task is easy (e.g., speech understanding in quiet), more resources would be available for the secondary task, such that secondary-task performance is high. In a more difficult test condition (e.g., speech understanding in noise), less resources would be available for the secondary task, such that secondary-task performance is lower. Accordingly, in dual-task approaches to measuring cognitive load during listening, differences in secondary-task performance between different test conditions are interpreted to reflect differences in processing demands for the primary task.
In single-task approaches to measuring cognitive load during listening, the theoretical assumptions are similar. However, rather than assessing the performance on two tasks at the same time, two different aspects of one task are measured, that is, accuracy and speed, in agreement with the assumption that processing resources are limited both in their accuracy and in their speed. For tasks of speech understanding this means that on the one hand, the correctness of the response is recorded, for example, the percentage of correctly repeated words, and on the other hand, the speed with which the responses are given is assessed, for example, by means of response times.
There are many previous publications on dual-task studies assessing different aspects of listening effort and cognitive load during speech understanding. In a recent review, Gagné et al. (2017) found 29 publications on dual-task assessments in adults and 6 in children. In contrast, single-task assessments appear to be used less frequently (e.g., Gatehouse & Gordon, 1990; Gustafson, McCreery, Hoover, Kopun, & Stelmachowicz, 2014; Houben, van Doorn-Bierman, & Dreschler, 2013; Huckvale & Frasi, 2010; Larsby et al., 2005; Pals, Sarampalis, van Rijn, & Başkent, 2015; Steel, Papsin, & Gordon, 2015). Nonetheless, there are some advantages to single-task measurements. For example, for the listener it is more comfortable to perform only one task, there are no issues related to whether priority is actually always kept on the primary task, and performance levels need only be controlled for one task. This appears to overcome some of the shortcomings of dual-task paradigms, where task priorities and resource allocation to tasks cannot be controlled. If performance changes on both tasks, results are difficult to interpret. These issues are not present in single-task assessments.
The concept of using response times as a potential measure of cognitive load during listening has been addressed in several previous studies. Recently, Houben et al. (2013) assessed response times for various signal-to-noise ratios (SNRs) with young normal-hearing listeners by applying a digit-triplet test. Two test conditions were performed. In one condition (identification task), the participants simply entered the perceived digits on a computer keyboard. In the other condition (arithmetic task), an additional mathematical operation had to be performed (i.e., summing up the first and the last digit) before entering the result. In both conditions, response times depended on the test SNR. Importantly, this held also true when intelligibility of the digits was nearly perfect. Using the same method, van den Tillaart-Haverkate, de Ronde-Brons, Dreschler, and Houben (2017) examined the effects of two different noise reduction schemes (ideal binary mask, “IBM”) and a mean square error estimator) at near-ceiling speech intelligibility. While the identification task did not reveal any differences between the schemes, significantly faster response times were found for the IBM-processing with the arithmetic task. The authors concluded that the more complex task can provide an objective measure of the benefit of noise reduction. In another study, Pals et al. (2015) recorded verbal responses during tests of speech understanding and analyzed the duration between the stimulus offset and the voice onset of the response, that is, verbal response times (VRTs), for each stimulus. They assessed young normal-hearing listeners and found significant effects of speech-intelligibility level (i.e., 79% and near ceiling) on VRTs. Notably, they additionally found a near-significant difference in VRTs between two noise types (i.e., stationary noise and multitalker babble), even when intelligibility was controlled for. Thus, VRT might be an additional measure that can be assessed in combination with common speech-audiometric methods to measure effects of task difficulty other than recognition performance.
To gain more information about VRT as a potential measure of cognitive load, the present study revisited the described method. However, one shortcoming of the method is that manually extracting VRTs from voice recordings off-line is resource intensive. Therefore, in the current study, we used an automated on-line assessment paradigm for VRTs. Specifically, the current study examined VRT in three participant groups, that is, young normal-hearing listeners, older listeners with clinically normal hearing, and older hearing-aid users. In all groups, speech recognition was assessed at two intelligibility levels (i.e., 80% and 95%) and in two noise types (i.e., stationary and fluctuating), using conventional speech audiometry based on a matrix-sentence test. Furthermore, we assessed perceived listening effort using a common scaling procedure. We hypothesized that VRT would give information beyond accuracy scores reflecting listener-group differences as well as noise-type and intelligibility-level differences and might be used as a potential measure of cognitive load during speech audiometry.
Methods
Participants
Forty-six listeners (27 females and 19 males) participated in this study, recruited for three subgroups of younger normal-hearing listeners (YNH), older adults with near normal hearing thresholds (ONH), and older hearing-aid users (OHA). The YNH group consisted of 14 students (10 females) from the local university with a median age of 21.5 years and a pure-tone average (PTA) of 2.2 dB HL, computed across both ears for frequencies of 0.5, 1, 2, and 4 kHz. The ONH group consisted of 15 participants (9 females) with a median age of 71.0 years and a PTA of 13.8 dB HL. Pure-tone thresholds of the YNH and ONH groups did not exceed 30 dB HL at any frequency up to 4 kHz. YNH and ONH listeners did not report any hearing problems. The OHA group consisted of 17 listeners (8 females) with a median age of 74.8 years and mild to moderate sloping sensorineural hearing loss with a PTA of 50.6 dB HL. Hearing loss was predominantly symmetrical with differences between both ears not exceeding 15 dB HL at two contiguous frequencies. All OHA listeners were bilaterally fitted with current hearing aids from various manufacturers and used them on a daily basis. Self-reported hearing-aid experience was at least 3 years (median 7 years). All participants were native speakers of German. Group-averaged audiograms are shown in Figure 1, and additional descriptive statistics about age and pure-tone hearing thresholds are provided in the Appendix.
Audiometric thresholds averaged across ears, organized by listener group. Mean and standard deviations are shown. YNH = Young normal-hearing listeners; ONH = older listeners with near normal hearing thresholds; OHA = older hearing-aid users.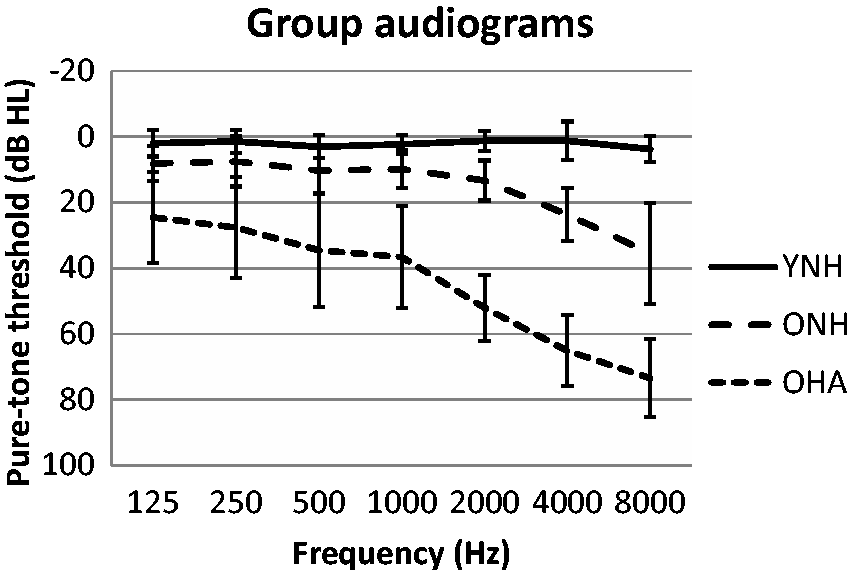
The study was approved by the ethics committee of the Medical Faculty at the University of Cologne, conforming to guidelines of the declaration of Helsinki. Participants provided their written informed consent prior to the experiments and were monetarily compensated.
Stimuli
Speech recognition was measured using the Oldenburg sentence test (Oldenburger Satztest, “OLSA,” Wagener, Kühnel, & Kollmeier, 1999), a matrix test presenting five-word sentences consisting of a name, verb, numeral, adjective, and object (such as “Peter kauft achtzehn nasse Sessel” or “Peter buys eighteen wet armchairs”). The speech material, of which each sentence is constructed, consists of 10 alternatives for each word category. OLSA sentences were presented against two different masker signals to assess speech recognition in noise. A speech-shaped stationary noise (SN, “OLNOISE”) and a speech-shaped noise with amplitude fluctuations (FN, “ICRA5_250” with maximum pause durations of 250 ms, Dreschler, Verschuure, Ludvigsen, & Westermann, 2001) representing envelope characteristics of fluent speech were used.
Target Intelligibility
Since cognitive load and listening effort were assumed to be associated with speech intelligibility, two defined (i.e., 80% and 95%) target intelligibility levels (TILs) were chosen in order to examine the effects of the noise maskers under defined conditions. First, speech reception thresholds (SRT) for 50% and 80% correct word identification (i.e., SRT50 and SRT80) were determined using an adaptive staircase procedure (Brand & Kollmeier, 2002) with adjustment of the speech level and keeping the noise level constant at 65 dB SPL. Then, individual SRT50 and SRT80 were subjected to a logistic curve fitting in order to estimate the psychometric functions. Based on these estimations, the fixed SNRs corresponding to 80% and 95% intelligibility level were determined for each participant individually and used with the subsequent measurements.
Verbal Response Times
After estimating individual SNRs for the two TILs (i.e., TIL80 and TIL95) in SN and FN, respectively, corresponding speech recognition scores were assessed using Presentation 16.4® (Neurobehavioral Systems, California, USA). For each condition, one test list with 30 sentences was presented, and the participant’s task was to listen to the sentences and to verbally repeat back as many words as possible. The outcome measure was the percentage of correctly identified words for each of the four conditions (SN: TIL80, TIL95, FN: TIL80, TIL95). As with the estimation of the psychometric functions, the background noise was set to 65 dB SPL for all listeners in all conditions. With each measurement, the noise started 2 s before the onset of the first sentence and was then presented continuously through the presentation of all 30 sentences, to account for possible adaptation of the signal processing applied by the OHA participants’ hearing aids in reaction to the respective background noise.
During the measurements, the VRT was determined for each sentence as the time from the sentence offset to the onset of the participant’s verbal response. For this purpose, a headset with a dynamic microphone was worn by the participant, and the verbal responses were recorded and time-logged automatically. Instructions for the participants were the same as with conventional speech audiometry, that is, to repeat back as many words as possible for each presented sentence and to guess if uncertain. Participants were not instructed to give their responses as quickly as possible.
The sound-response device, which is a software tool of Presentation 16.4®, was used to adjust the microphone sensitivity of the detection threshold related to the input level of the verbal response. The individual detection threshold was adjusted during the initial familiarization with the stimulus material in the quiet condition (see Procedures section). The purpose was to capture the voice onset of the response but to avoid triggering of the response-device due to artefacts such as breathing, head movements, or background noise. This allowed for an automated assessment of the VRT. After the logged offset of the sentence, the participants had a time window of 5 s to respond to the stimulus presented. If no response was given in this time window, a missed response was indicated by the software program. To ensure that VRTs were captured correctly, the recordings of the participant responses were reinspected, and the automatic VRT assessments were manually corrected if necessary.
Listening Effort Scaling
Directly after each test list of 30 sentences, a subjective scaling of perceived effort was conducted following the method described by Luts et al. (2010). Specifically, the participants were asked to indicate how effortful it was to understand the sentences of the test list. A 13-point scale consisting of seven verbally labeled categories—no effort (0), very little effort (2), little effort (4), moderate effort (6), considerable effort (8), much effort (10), and extreme effort (12)—as well as six intermediate subcategories was used to perform the listening effort scaling. Thus, 13 effort scaling categorical units (ESCU, 0–12) were given with the ratings.
Procedures
Initially, participants listened to and repeated 30 sentences presented in quiet at 65 dB SPL to get acquainted with the stimulus material. The quiet condition was also used to determine the sensitivity of the response-device for each listener. After initial habituation with the stimuli, the participants were further familiarized with both stimulus material, and the adaptive procedure used to determine the psychometric functions. For this purpose, an adaptive presentation converging to 80% correct word recognition was conducted in noise using a test list with 30 sentences. After the familiarization phase, SRT50 and SRT80 were assessed using test lists of 20 sentences, and the psychometric functions were estimated as described earlier (see Target intelligibility section) to determine individual test SNRs for TIL80 and TIL95.
Measurements were performed blockwise for each noise type. Within each listener group, the order of the noise blocks was counterbalanced across participants, and the order of the two different TILs within the noise blocks was also counterbalanced across participants. Moreover, although equivalence of test list is confirmed for the OLSA (Wagener et al., 1999), test lists were counterbalanced across conditions in order to avoid any sequence effects.
All signals were presented via a free-field loudspeaker placed in front of the participant at a distance of 1 m in a sound-treated booth. Listeners of the OHA group performed all measurements using their hearing aids.
Statistical Analysis
A generalized linear mixed model (GLMM) was used to analyze the data. Since not all data were normally distributed, this enabled considering interaction effects that are lost with traditional approaches of nonparametric testing. Pairwise comparisons with Bonferroni-correction were applied for post hoc analyses. IBM SPSS 23 was used for all analyses.
Results
In the following, the main outcome measures (i.e., speech-recognition performance, VRTs, and listening effort scaling) are described in detail for the three study groups. Please refer to the Appendix for descriptive statistics of the data obtained with the study.
Speech-Recognition Performance
Using a GLMM with TIL, noise type, as well as study group and their interactions as fixed effects, and participant as random effect, speech-recognition performance showed a significant main effect of TIL, F(1, 172) = 290.1, p < .001. Follow-up pairwise comparisons revealed significantly higher speech recognition with TIL95 compared with TIL80 (t = 17.03, p < .001, effect size r = .79). At a given target intelligibility level, speech-recognition scores did not differ significantly between the two noise types (p > .05). Moreover, a near-significant interaction Study Group×Noise Type was found, F(2, 172) = 3.03, p = .051. This was due to a marginally lower speech-recognition score for the OHA listeners (88% across both TILs) compared with the YNH listeners (91% across both TILs) with the fluctuating noise (t = 2.51, p = .039, r = .19). Apart from that, no other significant effects occurred. Overall, median speech-recognition scores were 82% ( ± 5.9%) and 96% ( ± 4.0%), reflecting the targeted intelligibility levels. Thus, as intended, the intelligibility levels differed from each other independently of study group or noise type. However, as expected the underlying SNRs yielding the corresponding TIL revealed large differences between groups and noise types.
Verbal Response Time
Figure 2 shows the median VRTs for the different TILs, noise types, and study groups. GLMM revealed significant main effects of TIL, F(1, 172) = 43.16, p < .001, noise type, F(1, 172) = 10.44, p = .001, and study group, F(1, 172) = 28.62, p < .001. Pairwise comparisons showed that VRTs were significantly longer for TIL80 compared with TIL95 (t = 6.57, p < .001, r = .45), and for SN compared with FN (t = 3.23, p = .001, r = .24). Moreover, OHA listeners showed longer VRTs than ONH (t = 3.49, p = .001, r = .26) as well as YNH (t = 7.57, p < .001, r = .50), and ONH listeners showed longer VRTs than YNH (t = 4.02, p < .001, r = .29). No significant interactions were found (all p > .05).
Verbal response times (delay) for target speech intelligibilities of 80% (TIL80) and 95% (TIL95), SN and FN and the three listener groups of OHA, ONH, and YNH. Thick lines show the median, boxes lower and upper quartile, and whiskers the minimum and maximum. TIL = target intelligibility level; SN = stationary noise; FN = fluctuating noise; YNH = young normal-hearing listeners; ONH = older listeners with near normal hearing thresholds; OHA = older hearing-aid users.
Listening Effort Scaling
Figure 3 shows the median ESCU for the different TILs, noise types, and listener groups. GLMM revealed significant main effects of TIL, F(1, 172) = 73.80, p < .001, and study group, F(1, 172) = 3.19, p = .044, as well as a significant interaction TIL × Study Group, F(1, 172) = 3.23, p = .042. Pairwise comparisons showed that listening effort was rated significantly higher for TIL80 compared with TIL95 (t = 8.59, p < .001, r = .55), and that the YNH listeners stated less effort than the ONH listeners at TIL95 (t = 3.09, p = .007, r = .23). Thus, apart from the latter small effect, listening effort scaling predominantly revealed the impact of the target intelligibility level.
ESCU for target speech intelligibilities of 80% (TIL80) and 95% (TIL95), SN and FN and the three listener groups of OHA, ONH, and YNH. Thick lines show the median, boxes lower and upper quartile, and whiskers the minimum and maximum. ESCU = Effort-scaling categorical units; TIL = target intelligibility level; SN = stationary noise; FN = fluctuating noise; YNH = young normal-hearing listeners; ONH = older listeners with near normal hearing thresholds; OHA = older hearing-aid users.
Discussion
This study examined (VRTs) as a potential single-task measure of cognitive load during standard speech audiometry with a matrix-sentence test in noise. Two different speech-intelligibility levels, two different noise types, and three different study groups were considered. In addition, perceived effort was assessed using a subjective scaling procedure.
As intended by study design, individual speech-recognition performance was close to the intended TILs (i.e., 80% and 95%) for all participants, regardless of the noise type and study group. Accordingly, effects of noise type, age, and hearing status on cognitive load and perceived listening effort could be investigated at controlled levels of performance. This study design was motivated by the fact that cognitive load and effort are known to covary with speech intelligibility (e.g., Wu, Stangl, Zhang, Perkins, & Eilers, 2016), such that differences in speech-recognition performance between noise conditions or study groups would have complicated the interpretation of the load and effort measures. Indeed, target intelligibility level had a consistent and significant effect on both cognitive load as assessed by VRT and perceived effort as assessed by subjective scaling. Thus, despite the fact that both TILs were chosen to cover high levels of recognition performance typically not considered with conventional speech audiometry, they still induced significantly different levels of cognitive load in all listener groups. VRTs were shorter for TIL95 than for TIL80. This is consistent with the assumption that near-maximum speech intelligibility (as with 95%) causes less cognitive load than high but below maximum speech intelligibility (as with 80%). Impact of intelligibility on reaction times has also been observed in dual-task designs (Wu et al., 2016). They found longest reaction times for the secondary task at intelligibility levels around 50% and decreasing reaction time with increasing intelligibility. Notably, reaction times also decreased when intelligibility was targeted at values below 50%—presumably reflecting the fact that the listeners changed task priority when the primary task (i.e., speech understanding) became too difficult.
In addition to two intelligibility levels, the present study also considered two noise types, namely stationary and fluctuating noise. Stationary noise, which is typically used with clinical speech audiometry, induces relatively constant masking over the length of a sentence. In contrast, fluctuating noise enables so-called glimpsing, that is, the ability to extract speech information from the time-frequency plane during periods with low masking energy (see Cooke, 2006). As a result, SRTs are typically lower as compared with stationary noise—an effect denoted as “fluctuating masker benefit” (FMB). However, there is evidence that this finding does not apply for all listeners. Especially, hearing-impaired persons appear to have smaller FMB or may even exhibit higher SRTs for fluctuating noise (e.g., George, Festen, & Houtgast, 2006). The Appendix shows that this is also the case in the present examination. The reasons are not entirely clear. Possible explanations take audibility issues or temporal processing deficits into account, alternative approaches relate this finding to the fact, that the SRTs for stationary noise are also increased in theses listeners (Christiansen & Dau, 2012; Smits & Festen, 2013).
In the present study, the rationale was to provide comparable intelligibility levels for both noise types. As shown in the Appendix, the different FMB is reflected by the SNR required to achieve the corresponding intelligibility level. Despite equal speech-recognition scores, response delays differed significantly between the two noise types, with shorter VRT for the fluctuating noise compared with the stationary noise. This effect was independent from TIL and apparent in all of the three study groups. In contrast, two other studies assessing VRTs in single-task paradigms did not find effects associated with different noise types: This applied when both matrix sentences (OLSA, Holube, 2011) as well as sentences of different linguistically complexity (OLACS, Uslar et al., 2013) were presented in stationary and fluctuating noise. However, Pals et al. (2015), who examined young normal-hearing listeners, also reported at least a tendency (p = .067) toward shorter VRT with their fluctuating noise (eight-talker babble in a foreign language) compared with stationary noise. This held true for their single-task paradigm, which is comparable to the method applied in the present study but not for their dual-task paradigm. Another study applying a dual-task paradigm and assessing different noise types was conducted by Desjardins and Doherty (2013). They calculated dual-task costs as a measure for listening effort for three different masker types (stationary noise and two-talker and six-talker maskers), when speech intelligibility was fixed at 76% for all conditions. Higher listening effort was found in two groups of older listeners (with and without hearing impairment) compared with young normal-hearing listeners but no effect of the different masker types emerged—at least in the older listeners. The young listeners seemed to expend significantly more listening effort with the six-talker masker but the reason for this finding remained unclear. Using another behavioral paradigm, assessing cognitive load as the ability to recall digits, Mishra, Lunner, Stenfelt, Rönnberg, and Rudner (2013) found better retrieval from memory for digits presented in fluctuating noise (international speech test signal) compared with stationary speech-shaped noise, though intelligibility was slightly above 90% in both cases. A physiological method of assessing cognitive load frequently applied in hearing research is pupillometry (Zekveld, Heslenfeld, Johnsrude, Versfeld, & Kramer, 2014), where pupil size is assumed to reflect cognitive processing load. Koelewijn, Zekveld, Festen, and Kramer (2012) compared the effect of stationary and fluctuating noise on pupil dilatation but did not find any significant differences between the two noise types.
Since speech intelligibility was carefully controlled and also did not differ significantly between the two noise types in the present study, it is unclear why VRTs were consistently shorter for the fluctuating than for the stationary noise. One possible explanation may be that masking was qualitatively different with stationary and fluctuating noise though quantitatively similar with regard to intelligibility effects. While masking is relatively constant across all of the words of a sentence presented with stationary noise, with fluctuating noise, single syllables or words are virtually presented in quiet (i.e., in the noise dips), whereas others experience a stronger masking (i.e., when noise intensity is high). The presentation of single speech segments in quiet rather than in noise might have helped better preparing the response of the listener than with stationary noise, since they could have been more easily and quickly encoded and might thus have been more readily available for retrieval from memory. Mishra et al. (2013) speculated that attentional mechanism may be different with different noise types better supporting noise suppression in speech-like fluctuating maskers. These accounts and other possible explanations should be addressed in further examinations.
Comparisons of the different groups showed that the young listeners revealed significantly faster responses than both older listener groups for most conditions. This might be explained by a general age-related slowing of cognitive processes in the two groups of older listeners, in line with dual-task experiments assessing load during listening to speech. Helfer, Chevalier, and Freyman (2010) showed that dual-task costs were significantly correlated with age in a sample of listeners (age 60–69 years) with good hearing, and Desjardins and Doherty (2013) reported significantly higher costs in two groups of older listeners with and without hearing impairment compared with young normal-hearing listeners. An alternative explanation might be that the younger listeners were more certain about their responses than the older listeners and thus responded more quickly.
There were also slightly but significantly faster responses of the ONH than of the OHA listeners, despite any significant differences in age or speech-recognition performance between both groups. Thus, it may be that (aided) hearing loss has an additional effect on response times compared with (clinically) normal hearing. Notably, Wendt, Kollmeier, and Brand (2015) reported longer eye fixations in hearing impaired listeners with and without hearing aids compared with normal-hearing listeners of similar age using an eye-tracking paradigm. Duration of eye fixation on target pictures during unaided speech comprehension was considered as a measure of sentence processing. Interestingly, this group difference was even found with high levels of speech intelligibility and was especially pronounced when the hearing impaired listeners were not accustomed to using hearing aids. Similarly, Carroll, Uslar, Brand, and Ruigendijk (2016) assessed reaction times in a word-monitoring task and showed slower reactions in hearing impaired listeners compared with age-matched normal-hearing listeners. This difference was found although hearing loss was compensated for by spectral shaping, both groups revealed very high word-recognition performance, and reaction times were analyzed only for correctly identified items. The authors interpreted their findings in the framework of the ease of language understanding model and suggested that the delayed responses of the hearing impaired listeners were a consequence of a perceptual mismatch with internal representations, calling for the activation of cognitive resources. In addition to the observed differences in reaction times, Giroud, Lemke, Reich, Matthes, and Meyer (2017) recently found electrophysiological evidence of higher processing effort in hearing impaired listeners compared with age-matched normal-hearing listeners indexed by higher global field power in EEG measurements during speech recognition. Interestingly, processing effort decreased with increasing exposure to the stimuli, suggesting acclimatization effects. Given that the OHA listeners in the present study reported hearing aid usage of 3 years and more, the group difference in VRT might have been larger, had hearing-aid listeners with less experience been enrolled.
The results of the subjective listening-effort mainly reflected the different intelligibility levels. There were no subjective differences in effort between the two noise types or the study groups. Thus, it appears that the listeners may have estimated their individual speech-recognition performance in the different conditions and performed the scaling based on this estimation. The only deviation from this performance-driven pattern was observed for the condition with fluctuating noise at TIL95, where the young listeners rated effort lower (i.e., 4 of 12 ESCU) than the older listeners with near normal hearing thresholds (6 of 12 ESCU) did.
The fact that there were no consistent group differences regarding perceived effort in the present study seems incompatible with results by Desjardins and Doherty (2013), who found that ONH listeners indicated more listening effort than YNH listeners, while OHA listeners indicated less effort than YNH listeners. In contrast, Larsby et al. (2005) and Gosselin and Gagné (2011) did not find consistent age-related effects on perceived effort. Gosselin and Gagné (2011) even reported lower values for the effort rating of older than younger participants when performance of the groups in a word identification task was equated. These conflicting results show that methodological differences in terms of the stimuli and scaling procedures used might yield variable outcome for perceived effort.
The present study thus also demonstrated that potential objective measures of cognitive load (such as VRT) do not necessarily yield outcomes similar to subjective measures of effort (such as listening effort scaling). Both measures consistently reflected the effect of different target intelligibility but VRT additionally revealed significant noise type and group differences, which were not apparent in the listening effort scaling. As discussed by Lemke and Besser (2016), cognitive load and perceived effort are frequently summed up under the umbrella term listening effort but do not reflect identical aspects: Listening to speech might be associated with cognitive load and processing effort but situational influences, the listener’s auditory and cognitive resources, and the listener’s personal state and motivation might impact whether it is perceived as effortful or not. With this conceptual differentiation in mind, it does not seem to be surprising, that Larsby et al. (2005), Gosselin and Gagné (2011), Desjardins and Doherty (2013), and the present study did not find a close association of subjectively assessed listening effort and objectively assessed cognitive load. However, an alternative interpretation is that the methods reveal different sensitivity due to differences in intersubject variability of the measurements. Nevertheless, when looking at the mutual significant effect of target intelligibility level, both methods reveal rather similar moderate-strong effect size (r = .45 and .55, respectively). Furthermore, when calculating the relative standard deviation of the measurements by relating intersubject variability to the corresponding mean (i.e., denoting variability as percentage of the mean), one also finds similar values for both measurements (e.g., relative standard deviation=28% for both, VRT and LE across all conditions and groups). Thus, though both measurements reveal relatively large intersubject variability, this does not give evidence that it is a major factor for different outcome of VRT and LE.
The proposed method has good practicability. Nonetheless, more complex paradigms may show higher sensitivity. This is evident with the study by van den Tillaart-Haverkate et al. (2017), which revealed that the arithmetic task but not the simple identification task uncovered differences between the noise reduction schemes. Dual-task paradigms tax cognitive resources by applying two duties simultaneously, which might in turn increase the sensitivity for mechanisms that otherwise do not affect each task alone. However, it is unclear whether dual-task methods are in general more sensitive than single-task methods, especially considering the large variability in secondary tasks applied. Secondary-task complexity (e.g., in terms of depth of processing) can significantly affect outcomes from dual-task paradigms (Picou & Ricketts, 2014). Furthermore, it is notoriously difficult to control listeners’ task prioritization in dual-task paradigms. Future work should thus address the question whether methods as the one proposed are also capable of showing more subtle effects, for example, associated with different signal processing schemes considering more controlled hearing-aid fittings.
Conclusions
VRTs reflected effects associated with different levels of speech intelligibility, different noise types, and different listener groups, whereas listening effort scaling mainly indicated different speech intelligibility. Thus, VRTs—which can be obtained on-line during conventional speech audiometry—have the potential to give information beyond performance measures and perceived effort. Still, possible limitations have to be considered. For instance, automatic assessment via voice detection threshold may be prone to errors. Artefacts might be due to breathing, or due to (fast) responses of listeners stating that they did not understand the sentence presented. However, the latter does not play a major role if intelligibility is high. In general, future developments considering automatic speech-recognition systems instead of simple voice detection may be helpful.
Appendix
Descriptive Statistics: Median Scores, Standard Deviations, Minimum, and Maximum Values for Age, Pure-Tone Average, Speech Recognition, Speech Reception Thresholds, Verbal Response Times, and Listening Effort Scalings Organized by Participant Group (OHA, ONH, and YNH).

Note. ESCU = effort-scaling categorical units on a subjective rating scale 0–12; FN = fluctuating noise; HL = hearing level; PTA = mean pure-tone hearing threshold for 0.5, 1, 2, 4 kHz averaged over both ears; SN = stationary noise; SNR = signal-to-noise ratio; YNH = young normal-hearing listeners; ONH = older listeners with near normal hearing thresholds; OHA = older hearing-aid users; Min = minimum; Max = maximum; PTA = pure-tone average; SR = speech recognition; SRT = speech reception thresholds; VRT = verbal response times; LE = listening effort.
Footnotes
Declaration of Conflicting Interests
The authors declared no potential conflicts of interest with respect to the research, authorship, and/or publication of this article.
Funding
The authors disclosed receipt of the following financial support for the research, authorship, and/or publication of this article: The study received financial support from Sonova AG.