
Abstract
The benefit in speech-recognition performance due to the compensation of a hearing loss can vary between listeners, even if unaided performance and hearing thresholds are similar. To accurately predict the individual performance benefit due to a specific hearing device, a prediction model is proposed which takes into account hearing thresholds and a frequency-dependent suprathreshold component of impaired hearing. To test the model, the German matrix sentence test was performed in unaided and individually aided conditions in quiet and in noise by 18 listeners with different degrees of hearing loss. The outcomes were predicted by an individualized automatic speech-recognition system where the individualization parameter for the suprathreshold component of hearing loss was inferred from tone-in-noise detection thresholds. The suprathreshold component was implemented as a frequency-dependent multiplicative noise (mimicking level uncertainty) in the feature-extraction stage of the automatic speech-recognition system. Its inclusion improved the root-mean-square prediction error of individual speech-recognition thresholds (SRTs) from 6.3 dB to 4.2 dB and of individual benefits in SRT due to common compensation strategies from 5.1 dB to 3.4 dB. The outcome predictions are highly correlated with both the corresponding observed SRTs (R2 = .94) and the benefits in SRT (R2 = .89) and hence might help to better understand—and eventually mitigate—the perceptual consequences of as yet unexplained hearing problems, also discussed in the context of hidden hearing loss.
Introduction
Humans with hearing loss generally show a decreased and more individual hearing performance when compared with listeners with normal hearing. Hearing aids offer relief to listeners with impaired hearing by improving their hearing performance. However, hearing devices cannot always live up to these expectations. For example, it is common to find that two listeners with very similar audiograms benefit differently from the same device (e.g., Stenfelt, 2008). Also, it is known that the compensation of hearing loss with hearing aids provides only limited benefit in noisy environments (Plomp, 1978). This study therefore pursues the goal of accurately predicting the benefit that can be provided by an individual hearing aid. The predictions should provide a quantitative indication of how the individual hearing performance will benefit from a specific device in a given communication situation.
Valid and reliable objective methods for the prediction of individual benefits are needed for the efficient development of hearing aid algorithms and the fitting of a hearing aid to an individual user. To perform accurate individual predictions, and to evaluate the prediction accuracy, high-precision data observations are required.
Speech-recognition performance is traditionally measured either as the percentage of correctly recognized words for a given set of speech items or as the speech level at which a given proportion of the words, for example, 50% are correctly recognized in a given acoustic environment (e.g., Hagerman, 1982). This is referred to as the speech-recognition threshold (SRT). SRT measurements have the advantage that the resulting speech level is a physically interpretable quantity which can be compared with, for example, real-world speech levels employed by people speaking in noisy environments (Olsen, 1998). They can be measured with high test–retest reliability using the matrix sentence test (Kollmeier et al., 2015), and the outcomes show pronounced differences across different listening conditions, that is, maskers (Hochmuth et al., 2015), and among listeners with impaired hearing (Wardenga et al., 2015). Hence, the matrix sentence test, which is available in more than 20 languages, was chosen as the measurement for the target quantity: SRT in dB sound pressure level (SPL) or dB signal-to-noise ratio (SNR).
To reflect daily-life speech communication situations as closely as possible, a great variety of masker types and spatial test conditions would be desirable. However, no single masker can represent all the properties of real environments and simultaneously provide a high test–retest reliability. As a compromise, a set of different maskers might represent important listening conditions. To reflect the conflicting requirements of measurement precision, time, and validity, a set of three types of maskers is suitable and therefore was employed here: (a) none, representing low-noise environments (i.e., measurement in quiet), (b) (statistically 1 ) stationary maskers, representing environments with a comparatively low residual dynamic range, and (c) fluctuating, representing environments with a large dynamic range that result in lower SRTs compared with the chosen stationary noise condition for listeners with normal hearing.
The benefit in SRT is derived as the difference of the SRTs in an aided and the corresponding unaided condition. Most of the common compensation strategies aim to selectively amplify or attenuate portions of the sound, depending on input levels; for example, with dynamic range compression. Where present, multiple microphones can be used to exploit the time difference between direction-of-arrival of signals, for purposes of noise suppression. Therefore, in addition to the unaided condition, a set of three compensation strategies was chosen to cover possible realistic configurations: (a) linear amplification, (b) compression amplification, and (c) compression amplification combined with a noise-suppressing beamformer. The additional complexity introduced into the interaction between the sound field and the (aided) listener by binaural hearing is, however, beyond the scope of the current contribution.
The technical suitability of models for the prediction of the outcome of the matrix sentence test that take into account (a) nonlinear signal processing, (b) impaired hearing, and (c) fluctuating noise maskers was discussed by Schädler et al. (2018). It was shown that many proposed models that could be used to predict the outcome were not, without further modifications, designed to consider all three conditions simultaneously. To directly predict the outcome of the matrix sentence test, that is, the individual SRT, for listeners with impaired hearing in aided listening conditions in different fluctuating noise maskers, Schädler et al. (2018) proposed simulating the experiments with the simulation framework for auditory discrimination experiments (FADE, Schädler, Warzybok, et al., 2016). In the proposed approach, an automatic speech-recognition (ASR) system was individualized by taking individual hearing thresholds in the feature-extraction stage into account and was used to simulate and predict the outcome of speech-recognition experiments. While Schädler et al. (2018) found that the effect of a variety of noise-suppression algorithms could be predicted with good accuracy in a real cafeteria and in babble noise for a group of listeners with impaired hearing, the individual predictions only slightly correlated (
Such a suprathreshold (or distortion) component of hearing loss was postulated by Plomp (1978, 1986) who described the speech-recognition performance of listeners with impaired hearing using two parameters: (a) an attenuation component of hearing loss that can be compensated by amplification and (b) the aforementioned distortion component of hearing loss that cannot be compensated by amplification and hence should play a significant role in speech-recognition performance in noise. Kollmeier et al. (2016) considered, in addition to the hearing thresholds, a multiplicative noise (which was implemented as a level-uncertainty parameter) in the feature-extraction stage of an ASR system. The level uncertainty is defined as the standard deviation of a noise that is added to logarithmic amplitude values and aims at describing the individually reduced ability to use differences in sound levels to solve recognition tasks, that is, a level-dependent distortion. They compared their model with that of Plomp (1978) and showed that the hearing threshold was responsible for the attenuation component of hearing loss, and that the level uncertainty (i.e., multiplicative noise) would account for the distortion component of that loss. The individual level uncertainty of listeners with impaired hearing was inferred from their speech-recognition performance in stationary noise and was successfully used to predict the speech-recognition performance in fluctuating noise. They thus used an individually inferable model parameter in addition to the hearing threshold, with an ASR-based model to explain the speech-recognition performance in different listening conditions. However, the level uncertainty could be a frequency-dependent parameter, which cannot be derived from SRT measurements. In this study, this shortcoming is approached by inferring the individual suprathreshold parameter—the level uncertainty—from the outcome of psychoacoustic experiments instead of speech-recognition experiments, which provides listener-specific, frequency-dependent information.
Therefore, FADE (Schädler, Warzybok, et al., 2016) was used to simulate outcomes of tone-in-noise detection experiments, to determine the individual frequency-dependent level uncertainty parameter that best fitted the observed tone-in-noise detection thresholds. For the single-interval, two-alternatives forced-choice task, we consider a directed discrimination experiment (tone vs. no tone), to be equivalent to a (tone) detection experiment. The former is actually performed by the FADE model, while the latter is actually performed by the listeners. In both cases, an input token must be assigned to one of the two classes: tone present or tone absent. Furthermore, we assume that, for each individual, the same suboptimal signal processing (i.e., the level uncertainty) affects both speech-recognition and tone-detection performance in noise. This assumption is a hypothesis. It is based on the observation that an increased level uncertainty decreases tone-in-noise detection and speech-recognition performance similarly in model simulations with FADE. If the assumption is incorrect, one would expect no increase in the prediction accuracy of the individual speech-recognition performance by using the same suboptimal signal processing for the simulation of tone-in-noise detection and speech-recognition experiments.
To assess the contribution of the level uncertainty for individual predictions of SRTs and the benefits in SRT from different hearing loss compensation strategies, the prediction accuracy of the individualized model is evaluated in relevant aided listening conditions for listeners with different degrees of hearing loss, with and without using the suprathreshold information. In this first step, only monaural listening conditions were considered in order to rule out any influence of (possibly individual) binaural listening. To address the concerns mentioned by Schädler et al. (2018), that measurement errors in the audiogram could be a source of systematic PEs, the individual audiograms were measured with high precision. For individual predictions of single measurement outcomes, measurements with high precision, that is, high test-retest reliability, are more important than for group predictions because the individual measurement errors do not average out.
The contributions of this article are two-fold: (a) An empirical data set of high-precision measurements of individualization parameters and speech-recognition performance in unaided and aided listening conditions for listeners with and without impaired hearing is presented. (b) The simulation FADE (Schädler, Warzybok, et al., 2016) is used to perform predictions of the individual speech-recognition performance, and the observed speech-recognition data are used to evaluate the prediction accuracy.
This study was designed to test the following hypotheses:
The ASR-based FADE modeling approach is suitable for accurate individual, aided-patient performance predictions, that is, a PE can be expected that is in the same range as the measurement error. An individual suprahreshold component of hearing loss measured with a tone-in-noise detection task is suitable for improving the prediction accuracy. According to Plomp (1978, 1986) and Kollmeier et al. (2016), such an accurate prediction of individual aided performance would have important implications for the individual, best-achievable aided performance.
Methods
Psychoacoustic Tasks
A variant of the single-interval, adjustment-matrix (SIAM) procedure for unbiased adaptive testing from Kaernbach (1990) was implemented and used to determine tone- and tone-in-noise detection thresholds. With this adaptive measurement paradigm, the tone level is increased/decreased based on the response to each single trial that has only a 50% chance of containing the target. In this study, the participant was asked to indicate by gesture when she/he heard a tone. No feedback, apart from the acknowledgment of the gesture, was given. Compared with the widely used two- or three-interval alternative forced-choice tasks, this adaptive procedure has the advantage that it closely resembles a single-interval experiment that can be simulated with FADE. Consequently, the tasks for the listeners and the simulation model were very similar. In addition, with SIAM, no cue lights are required to indicate the different intervals for measuring tone-detection thresholds in quiet, that is, for measuring the audiogram.
Monte-Carlo simulations were performed to assess the achievable accuracy and optimize the parameters of the SIAM method for the tone- and tone-in-noise detection experiments. The Monte-Carlo simulations revealed a flaw in the method, which occurred when the task was 75% correct tone detection: The published algorithm caused the adaptive threshold to stay below the true 75% threshold in some runs. In the original work, such runs were also observed and excluded based on their difference to the expected value. This outlier detection, however, requires repeated measurements, which counteract efficiency and are thus suboptimal in a study in which many different conditions are to be measured. With a target of 87.5% correct tone detection, such outliers were not observed in our Monte-Carlo simulations. In addition, the higher target percentage resulted in more audible tones during the measurement, which meant an increased comfort for the listeners.
For the measurement of tone-detection thresholds in quiet, the initial presentation level was 70 dB SPL, and the initial step size was 8 dB. This was then halved to 4 dB after the second reversal and finally to 2 dB after the third reversal. For the measurement of tone-in-noise detection thresholds targeting a threshold level of approximately 65 dB SPL for normal listeners (see later), the initial presentation level was 85 dB SPL, initial step size was 4 dB, then halved to 2 dB after the second reversal, and finally to 1 dB after the third reversal. The adaptive measurements were not stopped until at least 14 reversals were recorded of which the first four were discarded and until the target was presented at least 25 times after the first four reversals. The measurement result, that is, the level at threshold, was the median of the levels at the reversals. In 1000 runs of Monte-Carlo simulations for each of a range of psychometric functions with different realistic slopes (5.0, 6.25, and 7.5 percentage points per dB, i.e., transition regions of 10.0, 8.0, and 6.7 dB, respectively) and thresholds (−10, 0, and 10 dB), these settings resulted in an average standard deviation of about 1.5 dB with an average of about 80 trials per run.
Individual hearing thresholds were measured with pure tones of 500 ms duration flanked by 10 ms cosine ramps, and at 250, 500, 1000, 2000, 4000, and 8000 Hz. Individual tone-in-noise detection thresholds were measured with pure tones of 250 ms duration flanked by 10 ms cosine ramps and at 500, 1000, 2000, and 4000 Hz. These were presented in a two-octave wide, bandpass-filtered white noise with a power spectral density of 40 dB SPL per Hz, which was centered on the target frequency (on a log scale), where the total stimulus duration was 750 ms. This procedure resulted in fixed noise levels of 59.0, 61.2, 63.8, and 66.6 dB SPL per equivalent rectangular bandwidth at 500, 1000, 2000, and 4000 Hz, respectively. The use of fixed noise levels was a design decision to avoid the following problems: (a) a particular overall presentation level must not be exceeded, (b) the individual uncomfortable listening level must not be exceeded, and (c) the individual uncomfortable listening level is not known. In this context, fixed noise levels guarantee safer, more robust, and faster measurements. The comparatively high levels were required to achieve suprathreshold measurements for the majority of the listeners. The corresponding broadband levels of the noise signals were 68.8, 71.8, 74.8, and 77.8 dB SPL, respectively.
Matrix Sentence Test
The German matrix sentence test (Wagener et al., 1999) was used to measure the speech-recognition performance. Matrix sentence tests exist in more than 20 languages and aim to represent the main phonetic features of a language in a matrix of 50 common words that are used to build sentences like: “Peter got four large rings” or “Nina wants seven heavy tables.” The fixed syntax of the sentences and the small vocabulary size are especially well suited to be implemented in the ASR system used for the simulations, in that the prior knowledge when performing the task is very similar for the listeners and the simulation model.
The SRT-50, that is, the speech level that results in 50% word correct-recognition rate, was adaptively determined using lists of 20 matrix sentences (Kollmeier et al., 2015). For listeners with impaired hearing, a test–retest reliability (standard deviation) of about 0.8 dB was reported for the German matrix test in the stationary ICRA1 (Dreschler et al., 2001) noise condition with 30 sentences (“σintra, SRT” in Table 1 in Wagener et al., 2006). Discarding the first five sentences in an adaptive run as not being reliably close to the measured SRT, this would result for a measurement with 20 sentences in an estimated test–retest reliability of (
Statistical Analysis of the Predicted SRTs of the 18 Listeners in All Listening Conditions for the Three Individualization Options: (AG) Based on the Clinical Audiogram, (A) on the Tone-Detection Thresholds Alone, and (AD) on Tone and Tone-in-Noise Detection Thresholds.

Note. The 95th percentile (95P) of the absolute PE is reported along with the RMS PE, the bias, and the squared Pearson correlation coefficients (R2). The confidence intervals were determined with Monte-Carlo simulations assuming an average test–retest reliability of the observed SRTs of 2.0 dB and are reported relative to the value. PE = prediction error; RMS = root-mean-square.
Statistical Analysis of the Benefits in SRT of the Subgroup With the 11 Listeners Who Performed Suprathreshold Tone-in-Noise Experiments at All Frequencies, Analog to Table 2.

Note. PE = prediction error; RMS = root-mean-square; AG = clinical audiogram; A = tone-detection thresholds alone; AD = tone and tone-in-noise detection thresholds.
Listening Conditions: Maskers and Spatial Configuration
Three masker conditions were defined: Listening (a) in quiet, (b) in a stationary noise masker, and (c) in a fluctuating noise masker. The quiet condition represents situations with low ambient noise. For the stationary noise condition, the male ICRA1 noise (Dreschler et al., 2001), a stationary speech-spectrum-shaped noise, represented situations with stable and hence predictable, noise levels. For the fluctuating noise condition, the ICRA5-250 noise (Dreschler et al., 2001; Wagener et al., 2006), a speech-spectrum-shaped noise with speech-like modulations in three independent frequency bands, represented situations with rather unpredictable fluctuations in the noise level. While these conditions cannot account for all possible listening situations, they reflect important distinct properties that result in very different outcomes of the German matrix sentence test for listeners with normal hearing corresponding SRTs of about 20 dB SPL in quiet, of about −7 dB SNR in the stationary ICRA1 noise, and of about −19 dB SNR in the fluctuating ICRA5-250 noise can be expected (Hochmuth et al., 2015). At the common and realistic noise-presentation level of 65 dB SPL, these outcomes translate to speech levels of about 20, 58, and 46 dB SPL, respectively.
Spatial head-related impulse responses from Kayser et al. (2009) in the cafeteria scene (
Aided Conditions: Compensation Strategies
To represent different compensation strategies for hearing loss, three aided conditions were assessed: (a) frequency-dependent linear amplification by 40% of the individual hearing loss, (b) compression amplification in nine frequency bands fitted to the individual hearing loss according to the NAL-NL1 prescription rule (Dillon, 1999), and (c) in addition to the compression amplification (NAL-NL1), adaptive differential microphones (ADMs; Elko & Pong, 1995), to suppress a portion of the noise signal. Linear amplification represents a simple compensation strategy that does not reduce the dynamic range of the input signals. A 40% gain rule was chosen as a compromise between the half-gain and the one-third gain rule, which can be considered appropriate for adult listeners (Snik & Hombergen, 1993). Compression amplification according to NAL-NL1 represents a widely used compensation strategy that aims to maximize speech intelligibility, that is, speech-recognition performance, while limiting loudness perception to normal or less. ADM is a robust beam-former-based method for noise suppression, for which Völker et al. (2015) found a benefit in SRT of about 3 dB in the binaural cafeteria listening condition from Kayser et al. (2009). ADM combined with compression amplification according to NAL-NL1 represents a realistic compensation strategy for BTE class devices.
The signal processing was implemented with the master hearing aid (MHA) from Grimm et al. (2006), for which the basic configuration was taken from Völker et al. (2015). The MHA software platform allows for low-latency, real-time processing, as well as offline batch processing of signals, and is hence well suited for research purposes, as the same implementation can be used in the measurements and the simulations.
In all aided conditions, a noise with a density of approximately 24 dB SPL per decade was added to the microphone signals to simulate a limited microphone sensitivity. For the aided conditions (a) and (b), the signal of the simulated front microphone of the BTE device was used. For the aided condition (c), the signal of the simulated front and back microphones of the BTE device were used. The center frequencies of the frequency bands for compressive and linear amplification were 177, 297, 500, 841, 1414, 2378, 4000, 6727, and 11314 Hz. The attack and release time constants were 20 and 100 ms, respectively. The linear amplification prescription rule also added a noise gate that attenuated input levels below 35 dB SPL per band, while the NAL-NL1 prescription rule did not. The output amplitude was limited to 105 dB SPL via soft clipping.
Observed Data
The psychoacoustic experiments and the matrix sentence test in all listening conditions (quiet, stationary noise, and fluctuating noise) with all compensation strategies (unaided, linear, compressive, ADM, and compressive) were performed with 21 listeners with HDA200 audiometric headphones. The group consisted of listeners with normal hearing and listeners with a symmetric hearing loss close to the profiles N1, N2, N3, N4, N5, N6, S1, S2, and S3 according to Bisgaard et al. (2010). These profiles range from very mild (N1, S1), over mild (N2, S2) and moderate (N3) to moderate/severe (N4, S3) and severe (N5, N6) hearing loss. The letters N and S indicate moderately sloping and steeply sloping hearing loss, respectively. There were two listeners with normal hearing, and two individuals for each profile, apart from profile N2 for which there were three people. Three listeners, two from profile N6 and one from N5, had to be excluded because they were not able to successfully finish the SRT measurements in noise probably due to the artificial limitation of the output amplitude via soft clipping. Consequently, the data from 18 of 21 listeners were considered. The measurements were performed with the preferred ear of the listeners, for example, the one they used for phone calls. Based on the clinical audiograms of these listeners, the individual fittings with the two prescription rules (linear and compressive) were performed using the audiological user interface of the MHA, and the resulting gain tables were stored.
The measurements were performed in two sessions, each of about 90 min, according to the following protocol: The first session started with a training measurement of the tone-in-noise detection task with target frequency of 1000 Hz, followed by the measurements with the tone-in-noise detection task, in which the order of the conditions, that is, frequency, was randomized for each listener. Then, two training lists with the matrix sentence test were measured in the test-specific noise condition, one unaided and one with the prescribed compression amplification, in randomized order. Afterward, the matrix sentence tests in noise (unaided and aided) were performed, where the order of the conditions, that is, noise maskers and compensation strategies, was randomized for each listener. The listeners could decide to take breaks after each measurement, that is, about every 3 min. The second session started with another training list of the matrix sentence test in the test-specific noise condition, followed by the matrix sentence test in quiet (unaided and aided), again in randomized order. Finally, the tone-detection thresholds in quiet were measured at 250, 500, 1000, 2000, 4000, and 8000 Hz.
The audiograms of the 18 listeners (aged 18–81 years, median 72), 9 of which were hearing-aid users, are depicted in Figure 1. The hearing performance of this group can be expected to cover a wide range, from normal hearing to severely impaired hearing.

Audiograms of the 18 Listeners Included in the Study. The left panel shows the clinical audiogram, while the right panel shows the measured tone-detection threshold relative to hearing thresholds of listeners with normal hearing according to International Standard Organization (2003). The color encodes the rank of the unaided SRTs in quiet and is used consistently throughout the paper (cf. Figure 5), where blue means best/lowest and red worst/highest. SIAM = single-interval, adjustment-matrix.
Simulation of Experiments: Outcome Predictions With FADE
One of the key features of the FADE approach (Schädler, Warzybok, et al., 2016) is that the same model can be used to predict the outcome of psychoacoustic and speech-recognition tasks. This allows inferring the modelri individualization parameters from psychoacoustic experiments and using the model with individual parameters to subsequently predict the outcome of speech-recognition tests. Hence, FADE was first used to simulate the outcome of tone-in-noise detection tasks with a range of generic parameter values for the (suprathreshold) level uncertainty, to infer individual parameter values from the observed data (as explained in detail in the “Individualization: Inference of Model Parameters” section). Afterward, FADE was used with individual hearing thresholds and level uncertainties to predict the individual outcomes of speech-recognition tasks.
Therefore, for each condition considered separately, ASR systems were trained and tested with the same stimuli that were used in the empirical measurements, for example, tones or speech recordings in the presence of noise maskers over a broad range of levels/SNRs, including the potential processing of the signals with a hearing device in aided listening conditions. From the recognition performances that the ASR systems achieve, the lowest achievable SRT/level-at-threshold in the given condition, that is, the best achievable outcome, is reported as the predicted outcome. Detailed descriptions of how the ASR system in FADE is trained and tested to derive the predicted outcome were given by Schädler, Warzybok, et al. (2016).
Schädler et al. (2018) compared the FADE approach with many other speech-intelligibility prediction models in the context of aided listening performance predictions. The key point is that the performance of the ASR system in the simulations with FADE and the performance of human listeners in the corresponding listening experiment are similarly limited. The recognition performance can be limited, for example, due to the presence of a noise masker, distortions by nonlinear signal processing, or impaired hearing, while it may also be improved by compensation strategies. While the addition of maskers and the hearing aid signal processing can be performed in the same way as in the empirical measurements, the implementation of impaired hearing requires a modification of the (otherwise) standard ASR system.
Model of Impaired Hearing
Predictions with FADE were found to be close to the performance of listeners with normal hearing across languages and in important noise conditions (Schädler, Hülsmeier, et al., 2016). The performance of listeners with impaired hearing can be assumed to be decreased. To simulate the removal of information which is not available to the individual listener, hearing thresholds and level uncertainties were implemented in the feature-extraction stage, based on a standard log Mel-spectrogram, basically as proposed in Kollmeier et al. (2016). Note that the proposed implementation produced predictions that were well in line with the model of Plomp (1978), where the hearing thresholds were responsible for the attenuation component of hearing loss, and the level uncertainties were responsible for the distortion component, that is, the suprathreshold component, of hearing loss. The main difference in the present implementation was that the level uncertainty could be frequency-dependent and that, instead of the standard Mel-frequency cepstral coefficient, the more robust separable Gabor filter bank (SGBFB) features were extracted from the log Mel-spectrogram.
The effect of the implementation of the hearing threshold and the level uncertainty on the log Mel-spectrogram of clean speech presented at 65 dB SPL is depicted in Figure 2.

Illustration of the Effect of the Hearing Threshold and the Level Uncertainty on the Log Mel-Spectrogram of a Clean Speech Signal at 65 dB SPL. Color encodes the relative level above threshold where yellow/light represents the maximum level of the depicted utterance. As a reference, in the upper panel, normal-hearing thresholds were configured and no level uncertainty was applied. In the middle panel, the measured hearing thresholds of a listener with mild hearing loss was configured without the level uncertainty, while in the lower panel, the corresponding measured level uncertainty was additionally applied.
The hearing thresholds were implemented as a spectral subtraction of the absolute hearing threshold from the signal level in the log Mel-spectrogram, that is, the levels above hearing threshold are represented, followed by an element-wise maximum operation with values drawn from a normal distribution with a mean of 0 dB and a standard deviation of 1 dB. This implementation assures variance greater than zero in the feature vector in the case that the signal level does not exceed the hearing threshold and is a requirement to train the ASR system. The effect is that portions of the signal that are below the hearing threshold are no longer represented and cannot be used by the ASR system to recognize speech or detect tones. In Figure 2, this can be observed at high frequencies, comparing the upper and the middle panel, which show a configuration with normal-hearing threshold and a mild hearing loss, respectively.
The level uncertainty is then implemented by spectrally dividing the modified log-Mel spectrogram by the individual frequency-dependent level uncertainty, followed by the addition of values drawn from a normal distribution with a standard deviation of 1 dB. In other words, the levels above hearing threshold in each Mel-band are compressed by a factor equal to the level uncertainty, while the actual additive noise has a fixed standard deviation of 1 dB. The effect of adding noise to the logarithmic levels corresponds to a multiplicative noise in the linear domain and removes information about the exact values of the levels that might be useful to the ASR system to recognize speech or detect tones. Compared with multiplying the additive noise with the level uncertainty, this implementation has the advantage that the levels of the spectro-temporal representation from which the SGBFB feature are extracted do not diverge for high values of the level uncertainty but rather tend to zero. In Figure 2, this can be observed comparing the middle and the lower panel, which show a configuration with mild hearing loss without and with applied exemplary frequency-dependent level uncertainties, respectively. How the frequency-dependent level uncertainty is determined from the psychoacoustic measurements is explained in the next section. From the modified log Mel-spectrogram, SGBFB features are extracted and mean-and-variance normalization is applied to the resulting feature vector, as described in the original work of Schädler, Warzybok, et al. (2016).
The feature-extraction stage of the model was individualized by either using (A) the clinical audiogram, (B) the measured tone-detection thresholds in quiet, or (C) the measured tone-detection thresholds in quiet and in noise as described in “Individualization: Inference of Model Parameters” section. The level uncertainty was only considered with the last option (C), while the first two options differ in the accuracy of the hearing thresholds. Regarding the model individualization, the tone-detection threshold measurements used with option (B) can be assumed to be more accurate than the clinical audiogram data used with option (A) because they were measured with more precise tracking rules and with the same equipment used for the SRT measurements. All simulations were performed with each of the individualization options.
Individualization: Inference of Model Parameters
Ideally, the model parameters, that is, hearing thresholds and level uncertainties, which best explain the outcomes of all psychoacoustic experiments, including the tone and tone-in-noise detection thresholds, would be determined in an adaptive procedure. Because some listeners had hearing thresholds above the noise level, no information about the tone-detection performance in noise was available for these listeners at some frequencies, which resulted in an underdetermined optimization problem. Also, an adaptive procedure would require several simulations per listener and frequency and would not reveal the systematic relation between level uncertainty, frequency, and tone-detection performance. Hence, a direct mapping approach was used in which the individual frequency-dependent level uncertainties were determined by comparing the observed tone-in-noise detection performance to a table of (pre)simulated outcomes of the tone-in-noise detection task with different values for the level uncertainty.
Therefore, the tone-in-noise detection experiment was simulated for center frequencies of 500, 1000, 2000, and 4000 Hz, with level uncertainty parameters of 1, 2, 3, 4, 5, 6, 7, 8, 9, 10, 12, 14, 16, 18, 20, 22, 24, and 26 dB. Each simulation was repeated 4 times. The resulting tone-detection thresholds are plotted as circles as a function of the level uncertainty in the left panel of Figure 3. The relation seems monotonic, and the data were fitted with second-order polynomial functions for each frequency. The corresponding functions are plotted in the left panel of Figure 3 and their inverse functions in the right panel. The values of the inverse function, the level uncertainties, were limited to the range from 1 to 20 dB. The limited inverse curves were used to map the individual outcomes of the tone-in-noise detection experiment to the model parameter level uncertainty. However, this direct mapping is only possible if the tone-in-noise measurement was clearly suprathreshold, that is, if the noise level was above the individual absolute hearing threshold, which was not always the case. Hence, both cases need to be handled correctly, and the transition between them should be smooth.

Frequency-Dependent Relations of Simulated Tone-in-Noise Detection Thresholds and Varying Values of Level Uncertainty. The left panel shows the simulated data points plotted as circles, where the levels at threshold are reported relative to 65 dB SPL. The curves are second-order polynomials that were fitted to the corresponding simulated data. The right panel shows the same curves with inverted relations, that is, the inverse curves, but limiting the values of the level uncertainty to the range from 1 dB to 20 dB.
The following steps 2 are proposed for a conservative estimate of the level uncertainty: First, a criterion is needed to distinguish three cases: (a) The tone-in-noise experiment was clearly supra-absolute-threshold, (b) the tone-in-noise experiment was clearly sub-absolute-threshold, or (c) something in between. The detection levels for listeners with normal hearing were used to separate between the cases. Therefore, the measured tone-in-noise detection levels (depicted in Figure 4 and described later in “Results” section) were used to propose reference levels for normal-hearing listeners, which are −3.5, −2.0, 2.0, and 4.5 dB at 500, 1000, 2000, and 4000 Hz, respectively. If the individual tone-in-quiet detection threshold was found to be below the tone-in-noise detection threshold, the tone-in-noise experiment was supra-absolute-threshold. Otherwise, it might have been subabsolute-threshold. To quantify this, a criterion value was calculated, for each frequency separately, by mapping the difference to a value between 0 and 1; 1 if the tone-in-quiet detection level was measured more than 5 dB above the normal-hearing reference (cf. Figure 4 and note the inverse ordinate axis), 0 if it was measured more than 5 dB below the normal hearing reference, and linearly interpolated in between. The criterion can be interpreted as a proxy for the probability that the measurement was not supra-absolute-threshold.

Measured Tone-in-Noise Detection Thresholds of the 18 Listeners Included in the Study, Where the Levels at Threshold Are Reported Relative to 65 dB SPL. The color indicates the individual with the same coloring scheme as in Figure 1. Circles indicate proposed reference values for normal-hearing listeners.
The next step was to obtain a conservative estimate of the level uncertainty in both cases and separately for each frequency:
Criterion Equal to 1. Assuming a subthreshold measurement, the level-uncertainty values for listeners with normal hearing were used, which were determined from the tone-in-noise detection levels for listeners with normal hearing proposed in Figure 4; the values are 1.4, 2.7, 4.4, and 4.3 dB, at 500, 1000, 2000, and 4000 Hz, respectively, and will be discussed later.
Criterion Less Than 1. Assuming a (partially) supra-absolute-threshold measurement, the level uncertainty was looked up for the individual tone-in-noise detection threshold using the curves inverted from the left panel in Figure 3. However, in the transition region, the hearing threshold could increase the tone-in-noise detection threshold and hence the level-uncertainty estimate. To avoid this potential increase, the portion of the level uncertainty that can be explained by the tone (in quiet) detection threshold was removed from the level uncertainty.
Finally, for each frequency separately, the weighted average of the level uncertainty values from both extreme cases was taken as the individual level uncertainty, where the weight for the subthreshold case was the criterion value and the weight for the supra-absolute-threshold case was one minus the criterion. To take into account that the tone-detection thresholds are a product (i.e., sum of logarithms) of the attenuation and the distortion component of hearing loss, the portion of the tone-detection thresholds that can be explained by the level uncertainty was removed from the tone-detection thresholds. The resulting tone-detection levels and level uncertainty values are used to individualize the feature extraction as, for example, in Figure 2, in order to remove from the feature vector information that is not available to the individual listener. Based on the criterion, a subgroup was defined in which the values were 0, that is, clearly supra-absolute-threshold condition, for all frequencies; it consisted of 11 listeners.
Evaluation and Statistical Analysis
A special property of the observed data set is that it consists of individual SRT measurements of which none can be assumed to result in the same outcome. In other words, there are no repeated measurements and no groups of listeners whose average outcomes can be assumed to be the same.
The task for the model is to predict as accurately as possible this specific, observed SRT data set, without prior knowledge of any observed outcomes of the speech-recognition tests.
Hence, the model is evaluated first and foremost with respect to its ability to accurately predict this specific, observed data set (listeners, conditions, and compensation). The main quantity to assess the accuracy of predictions is the PE determined for each pair of predicted and the corresponding observed outcomes as the difference between both values. The measurement error of the observed outcomes can be estimated from the test–retest reliability, which is probably highest in quiet or in the fluctuating-noise condition and lowest in the stationary noise condition (Wagener et al., 2006). Here, it was assumed to be normally distributed, with a standard deviation of 2.0 dB. With this assumption, 90% confidence intervals (5th to 95th percentiles) for all derived quantities were estimated in Monte-Carlo simulations with 10,000 samples.
To obtain an estimate of the significance level (under the null hypothesis that the difference of the means is zero) when comparing the confidence intervals of two distributions, we assume standard normal distributions, that is, mean
To compare the differently-individualized models (cf. “Model of Impaired Hearing” section), the following quantities are reported:
95th percentile (95P) of absolute PEs is derived from a set of predictions and the corresponding observed data by determining the 95th percentile of the absolute values of the PEs. This value can be interpreted as a limit of the expected deviation from the true value. As a guideline, perfect predictions for the benefit in a test with a test–retest reliability of σ = 2.0 would yield a value of (
RMS PE, in dB, is derived from a set of predictions and the corresponding observed data by calculating the square root of the average over the squared PEs. If the PEs were normally distributed and the mean value were zero, the RMS PE would indicate the standard deviation.
Bias is the expected value of the PE estimated by the average over the PEs. This value indicates how much the predictions generally over- or underestimate the observed values.
Coefficient of determination (R2) was calculated as the square of the Pearson correlation coefficient, which indicates the proportion of the variance in the observed data that is explained by the predictions.
Results
First, the outcomes of the psychoacoustic tasks are presented. Then, the observed unaided SRTs, and the benefits in SRT due to the different compensation strategies, are described. Finally, the predictions of SRTs and the benefits in SRT are separately evaluated by comparing them with the corresponding observed data.
Psychoacoustic Tasks
The results of the tone-detection experiments in quiet, measured in situ with the SIAM procedure, are plotted in the right panel of Figure 1 as the level above the hearing thresholds of listeners with normal hearing at the eardrum according to International Standard Organization (2003) and Shaw and Vaillancourt (1985). These thresholds were found to be generally similar to the corresponding audiograms, as depicted in the left panel in Figure 1. However, for important speech frequencies (500, 1000, 2000, and 4000 Hz), the thresholds measured with the SIAM procedure were found to be, on average, 7.8 dB lower than the estimated levels at the eardrum from the corresponding audiograms. These differences were frequency-dependent: 5.7 dB at 500 Hz, 6.3 dB at 1000 Hz, 13.0 dB at 2000 Hz, and 6.1 dB at 4000 Hz.
The results for the tone-in-noise detection task are presented in Figure 4. The outcomes varied greatly across listeners, but listeners with low unaided SRTs in quiet (e.g., normal-hearing listeners) showed low tone-in-noise detection levels, whereas listeners with higher unaided SRTs in quiet tended to show increased detection levels. Apart from the listener close to profile N5, whose hearing thresholds were greatly elevated, the variability was found to be lower at the lower frequencies (
Observed SRTs
The measured unaided SRTs in noise (in dB SNR) are plotted as a function of the corresponding SRTs in quiet (in dB SPL) in Figure 5, where the squares and triangles indicate the performance in the stationary and fluctuating noise conditions, respectively. The color code indicates the rank of the unaided SRT in quiet. The noise level was 65 dB SPL; hence, a speech-presentation level of 0 dB SNR equals 65 dB SPL on the abscissa, which is indicated by the dash-dotted line. The continuous black line shows where the speech-presentation level in quiet and the speech level in noise are equal. The lowest unaided SRTs were measured for a listener with normal hearing, with 16.5 dB SPL in quiet, −9.8 dB SNR (=55.2 dB SPL) in stationary noise, and −18.3 dB SNR (=46.7 dB SPL) in the fluctuating noise condition. The highest unaided SRTs were measured for a listener with severely impaired hearing (Bisgaard profile N5), with 81.3 dB SPL, 18.3 dB SNR (=83.3 dB SPL), and 16.0 dB SNR (=81.0 dB SPL), respectively. Hence, as could be expected, the increase in SRT due to impaired hearing was largest in quiet (

Measured Individual Unaided SRTs of 18 Listeners in Noise (in dB SNR) Plotted as a Function of the Corresponding Measured SRTs in Quiet (in dB SPL). The noise level was 65 dB SPL. Color indicates the individual, based on the rank of the unaided SRT in quiet (consistently used throughout the paper). The squares indicate the performance in the stationary noise condition, triangles those in fluctuating noise. The dash-dotted line indicates the noise presentation level. The continuous black line indicates the same speech signal level in quiet and in noise. SRT = speech recognition threshold; SPL = sound pressure level.
The difference between the outcome in the stationary and the fluctuating noise conditions was most pronounced for the listeners with low SRTs in quiet (dark blue symbols) and reduced or even inverted for listeners with SRTs greater than 27 dB SPL in quiet. Hence, with unaided hearing, these listeners were found to benefit from the modulation of the fluctuating noise masker in the speech-recognition task. Listeners with high unaided SRTs in quiet tended to perform similarly in noise and in quiet probably because the masker levels were mostly below their hearing thresholds. The observed unaided SRTs in quiet and in noise show a differentiated group of listeners that covers a wide spectrum of listening performance, as could be expected from the audiograms in Figure 1.
Observed Benefits in SRT
In Figure 6, the benefits in SRT are plotted as a function of the corresponding average hearing levels (HL) over 500, 1000, 2000, and 4000 Hz, also referred to as pure-tone average (PTA), where the squares and triangles indicate the performance in the stationary and fluctuating noise conditions, respectively. The observed benefit data show a wide spectrum of effects, from decreases in performance by almost 15 dB to improvements of more than 30 dB, that is, spanning a range of about 45 dB. Differences in improvements between linear and compression amplification can be observed as well as a pronounced improvement due to the ADM in the noisy listening conditions. The lowest and the highest benefit in SRT were found in the quiet listening condition (indicated by circles) with about −15 dB and 30 dB, respectively. The benefit in the quiet listening condition was found to be strongly dependent on the PTA, that is, the higher the PTA, the greater the benefit from any of the compensation strategies. Listeners with PTAs below 20 dB HL did not benefit from the compensation due to the simulated microphone noise, which effectively increased their hearing threshold with aided hearing. The break-even point can be observed at a PTA of about 20 dB HL, beyond which the users start benefiting from the compensation strategies in quiet.

Measured Individual Benefits in SRT of 18 Listeners Due to the Different Compensation Strategies Plotted as a Function of the Corresponding PTAs. Positive values indicate lower aided SRTs than in the corresponding unaided condition. The left panel shows the benefits due to linear amplification, the center panel due to compression amplification, and the right panel due to ADM combined with compression amplification. Color indicates the rank of the unaided SRT in quiet (cf. Figure 5). Circles, squares, and triangles indicate quiet, stationary and, fluctuating noise conditions, respectively. SRT = speech recognition threshold; SNR = signal-to-noise ratio; ADM = adaptive differential microphone; HL = hearing level; PTA = pure-tone average.
In the noisy listening conditions (indicated by squares and triangles), the picture is very different. The benefits are scattered around 0 dB for linear and compression amplification and do not exceed 5 dB up to PTAs of about 50 dB HL, which is already close to the level of the noise signal (65 dB SPL). While the benefits in quiet tended to be higher with the compression amplification according to NAL-NL1, the benefits in noisy listening conditions were lower and tended to be negative. Only in combination with ADM noise reduction were the benefits in noisy listening conditions greater or equal to zero but were at the expense of a detrimental effect in the quiet listening condition compared with compression amplification alone. Notably, for many listeners, close to zero or negative improvements were observed due to amplification alone, whether compressive or not. Thus, ADM can only improve the SRT if the target source is spatially separated from the noise source, which was the case in the condition tested.
Evaluation of Predicted SRTs
In Figure 7, the predicted SRTs are plotted as a function of the corresponding observed SRTs for the three different individualization options, and a statistical analysis of the data is presented in Table 1. The diagonals indicate perfect predictions and the deviations from it on the ordinate indicate the PEs. Compared with the range of the observed data, the predictions were found to be relatively close to the observed data, that is, close to the diagonal, which resulted in high correlation coefficients (

Predicted SRTs Plotted as a Function of Measured SRTs of 18 Listeners for Three Individualization Options: Left Panel With Clinical Audiogram (AG), Center Panel With Tone-Detection Thresholds (A), and Right Panel With Tone and Tone-in-Noise Detection Thresholds (AD). Filled symbols indicate unaided listening, open symbols aided listening. Color indicates the individual with the same coloring scheme as in Figure 1. Circles, squares, and triangles indicate the quiet, stationary, and fluctuating noise conditions, respectively. SRT = speech recognition threshold; SPL = sound pressure level.
Regarding absolute PEs, 95% were less than 11.1 dB in the audiogram case (AG), less than 12.2 dB in the tone-detection thresholds case (A), and less than 7.9 dB when additionally considering the distortion component (AD). Similarly, the RMS PEs were 5.8, 6.3, and 4.2 dB, respectively. The tendency of the predictions to underestimate the observed performance, expressed by the bias, was −1.9, −5.0, and −2.7 dB, for the AG, A, and AD individualization, respectively, and can also be observed in Figure 7. With the individualization options A and AD, only a few outcomes were underestimated and the tendency to overestimate the human performance was more pronounced when the suprathreshold component was not considered.
Interestingly, the individualization with the supposedly more accurate psychoacoustically measured tone-detection thresholds (A) did not result in a lower bias and consequently also not in lower PEs than with standard audiograms (AG). However, the predictions based on the audiogram (AG) explained 82.6% of the variance in the observed data compared with 91.0% which could be explained when the predictions were based on the tone-detection thresholds (A). The strongest correlation (R2 = .940) was observed when the predictions were based on the tone and tone-in-noise detection thresholds, that is, considering the attenuation and distortion components (AD).
Overall, the most accurate outcome predictions in terms of the various measures were achieved when the suprathreshold distortion component of hearing loss was also considered (AD). To test whether accurate predictions of SRTs also translate to good predictions of the benefit in SRT due to using a compensation strategy, the predicted benefits (as the difference in SRT between unaided and aided listening condition) were evaluated separately.
Evaluation of Predicted Benefits in SRT
In Figure 8, the predicted benefits in SRT are plotted as a function of the corresponding observed benefits for the three different individualization options, and a statistical analysis of the data is presented in Table 2. The diagonal indicates perfect predictions, and the deviation from the diagonal on the ordinate indicates the PE. The predicted benefits are scattered around the diagonal with all three individualization options, where the predictions seem most accurate with the individualization based on tone and tone-in-noise measurements (AD), and least accurate with the individualization based on the audiogram (AG). In contrast to the PEs of the SRTs, the PEs for the benefits in SRT are, by all measures, larger when the individualization was performed with the audiogram (AG) compared with when it was performed with the tone-detection thresholds (A). The lowest PEs by all measures were achieved when, additionally, the suprathreshold component was taken into account (AD). The 95th percentiles of the absolute PEs were 13.4, 10.7, and 7.1 dB, and the RMS PEs were 7.1, 5.1, and 3.4 dB with the AG, A, and AD-individualization, respectively. On average, the predicted benefits overestimated the observed benefits by 4.4, 3.1, and 1.4 dB, with the AG, A, and AD-individualization, respectively. Also, the correlation between the predicted benefits in SRT with those observed was highest with the AD individualization (R2 = .888), lower with the A-individualization (R2 = .826), and lowest with the AG individualization (R2 = .671). Lower correlation coefficients compared with those for the SRT predictions were expected due to the 20 dB smaller range (45 vs. 65 dB), and due to increased measurement error, by a factor of approximately

Predicted Benefits in SRT Plotted as a Function of Measured Benefits in SRT of 18 Listeners for Different Individualization Options: Left Panel With Clinical Audiogram (AG), Center Panel With Tone-Detection Thresholds (A), and Right Panel With Tone and Tone-in-Noise Detection Thresholds (AD). Color indicates the individual: Coloring scheme as in Figure 1. Shapes indicate the listening condition: circle, square, and triangle represent quiet, stationary, and fluctuating noise, respectively. SRT = speech recognition threshold.
Statistical Analysis of the Predicted Benefits in SRT of the 18 Listeners in All Listening Conditions for the Three Individualization Options: Based on the Clinical Audiogram (AG), on the Tone-Detection Thresholds Alone (A), and on Tone and Tone-in-Noise Detection Thresholds (AD).
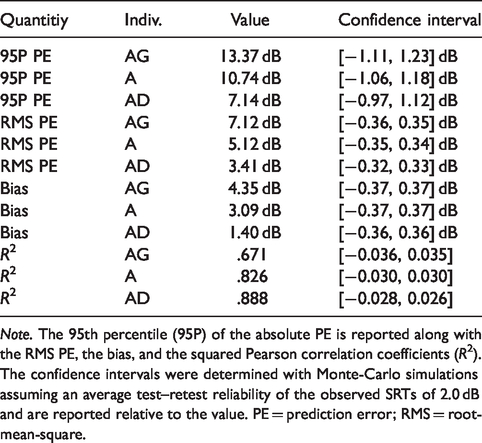
Note. The 95th percentile (95P) of the absolute PE is reported along with the RMS PE, the bias, and the squared Pearson correlation coefficients (R2). The confidence intervals were determined with Monte-Carlo simulations assuming an average test–retest reliability of the observed SRTs of 2.0 dB and are reported relative to the value. PE = prediction error; RMS = root-mean-square.
In cases in which the tone-in-noise measurement was not suprathreshold, no information about the suprathreshold component of hearing loss could be retrieved and the proposed values for listeners with normal hearing (cf. Figure 4) were applied with the AD-individualization. The statistical analysis of the predictions of benefit in SRT only for the subset of the data from the 11 listeners who performed all tone-in-noise measurements supra-absolute-threshold are reported in Table 3. The 95th percentile of the absolute PEs as well as the RMS PEs and the bias were found to be reduced for this group compared with the full group of listeners. For this subgroup, the lowest bias, the lowest PEs regarding extreme deviation (95 P), and regarding average deviation (RMS) were found with the AD-individualization and equaled 0.6 dB, 5.2 dB, and 2.7 dB, respectively. These values indicate a prediction accuracy for individual measurements that is already at the limit of that which can theoretically be achieved assuming a test–retest reliability of (
These results show that the highest prediction accuracy with respect to several important measures (95th percentile of absolute PEs, RMS PE, and correlation coefficient) was only achieved by considering the suprathreshold component of hearing loss inferred from tone-in-noise measurements. This was found to be true for the prediction of SRTs as well as for the prediction of benefits in SRT due to using different compensation strategies.
Discussion
The presented modeling approach with FADE was used to infer parameters from psychoacoustic experiments describing the individual hearing performance of listeners with impaired hearing. These parameters were then successfully exploited to improve the prediction accuracy of the individual speech-recognition performance under a broad range of listening conditions. The modeling results show that the approach established a link between individual tone-detection performance (both in quiet and in noise) and individual aided speech-recognition performance. Such a link between individual psychoacoustics and individual speech recognition is highly desirable to better understand as yet unexplained hearing problems (Plack et al., 2014; Plomp, 1978, 1986). In the following, the empirical and modeling results are discussed with respect to this important link and its potential meaning for a better understanding of the perceptual consequences of hearing loss for speech recognition.
The unexplained suprathreshold hearing problems that may be characterized closer by the approach followed in this study have been discussed recently in the context of hidden hearing loss, as interpreted as being cochlear synaptopathy. However, the relation between psycho-acoustical or speech-recognition functions and cochlear synaptopathy in humans is still unclear and hard to find (Bramhall et al., 2019). Likewise, this study does not make any claims about the pathologies underlying hidden hearing loss and the causes of the elevated tone-in-noise detection thresholds and SRTs in humans with sensorineural hearing impairment. Instead, in this contribution, the potential behavioral correlates of hidden hearing loss are related to each other and to the distortion component of hearing loss already postulated by Plomp (1978).
SRT Data for Model Evaluation
The main design goal of the empirical speech tests was to obtain individual, precise data in relevant aided listening conditions for listeners with impaired hearing, which should serve as a benchmark to evaluate the prediction accuracy of speech-intelligibility models. Hence, one goal was to achieve pronounced differences in the speech-recognition performance due to (A) the degree of hearing impairment, (B) the listening condition, and (C) the compensation provided. The observed data indicate that this goal was achieved: (A) The listeners, whose hearing spanned a broad range of impaired hearing, showed great variability in the outcome of the speech tests; (B) the recognition performance for many listeners varied strongly across the listening conditions; and (C) the benefit in recognition performance due to a provided compensation depended on the strategy and also varied strongly across individuals.
The large variability in the observed data covers many aspects of (aided) listening of impaired listeners in quiet and in noise, with three common compensation strategies. For example, it is noteworthy that listeners with only slightly increased hearing thresholds (with unaided SRTs below 35 dB SPL in quiet), also already showed increased SRTs in stationary noise (cf. Figure 5). As the noise level for these listeners was generally above their hearing thresholds for important portions of the speech spectrum, these differences are likely due to a suprathreshold component of the hearing loss. Also, the increase of SRT in noise due to impaired hearing was more pronounced in fluctuating noise than in stationary noise. While listeners with normal hearing were observed to achieve lower (i.e., better) SRTs in the fluctuating ICRA5-250 noise than in the stationary ICRA1 noise, for many listeners with impaired hearing, the difference in performance was much less pronounced or even inverse, as could be expected from previous observations (Wagener et al., 2006). One explanation for this observation could be the limited frequency range available to listeners with impaired hearing, which Oxenham and Simonson (2009) found to reduce the masking release due to temporal modulations of noise maskers. In line with the measured data, Oxenham and Simonson (2009) and Bernstein and Grant (2009) suggested that fluctuating-masker benefits generally depend on the SNR and are lower for higher SNR conditions. Hence, the observed data show interesting and plausible individual behavior regarding listening in different noise maskers.
It should be noted that a consistent explanation of the data is hard to find on a heuristic level as the observed masking thresholds result from the highly nonlinear interactions of all auditory signal processing steps involved and probably more, yet unknown properties. Hence, pinpointing effects like the fluctuating-masker benefit in relation to other auditory functions like effective auditory bandwidth or SNR is an important but not completely satisfactory achievement as the influence of all other factors cannot be quantitatively assessed (as pointed out, e.g., by Bernstein & Brungart, 2011).
The modeling approach presented here, on the contrary, does not select the appropriate processing strategy heuristically but is based on the information available in the input signals. Thus, it avoids heuristic interpretations of the different factors involved and, instead, explains the modeled data based on the assumption that the removal of information from the input signals translates to worse recognition scores, that is, masking. It still has to be shown that such an approach is advantageous in comparison to the conventional, heuristic explanation approaches.
Most importantly, the benefit due to using a compensation strategy depended on the degree of the hearing impairment, the listening condition, and the compensation strategy (cf. Figure 6). In quiet, the observed SRT benefit was mainly related to the amplification provided, where the simulated microphone noise limited the hearing performance for listeners with low hearing thresholds. In noise, the observed SRT benefit from amplification was very limited, that is, less than 5 dB, or even negative for the majority of listeners. Part of the negative benefit was probably due to the different simulated microphone positions in the unaided (in ear) and aided conditions (BTE), which are known to result in worse SNRs for normal-hearing listeners (Cubick et al., 2018). The nine-band compression amplification (according to NAL-NL1), which is generally employed with the aim of improving audibility while avoiding excessive loudness percepts for high input levels, did improve SRTs in quiet for many listeners but simultaneously tended to reduce the speech-recognition performance in noise.
In the data set, the use of the ADM shifted the observed negative SRT benefit of the compression amplification in the listening-in-noise conditions to the positive domain by improving the SNR. The spatially separated target and noise signals enabled the ADM to cancel out portions of the noise signal, exploiting the time delay due to the different incidence directions. In more realistic listening conditions, such as more remote noise sources, this cannot always be assumed.
Apart from pronounced differences, the high precision of the empirical measurements assured good discriminability in model evaluations. Predictions cannot show a higher accuracy than the precision of the data that is used for their evaluation. Hence, a good test–retest reliability (i.e., precision) of the speech test was crucial for obtaining individual, precise data, but it conflicted with reflecting the relevant variable environments that listeners generally encounter in daily life. The evaluation of the prediction results for the subgroup of 11 listeners for which the suprathreshold individualization data was available (cf. Table 3) showed how important precise speech-recognition measurements are to enable the evaluation of individual performance. The lowest 95th percentile of the absolute PEs of the benefit predictions (5.2 dB) was found to approach a theoretical lower bound given by an assumed test–retest reliability of
Hence, for the purpose of evaluating the prediction accuracy of models, it was suitable to challenge different aspects of the listeners individual hearing abilities in different simple speech-recognition tasks, rather than in one complex task. In this context, the 95th percentile of the absolute PE provides a more reasonable summary of the evaluation than the RMS PE in which a single problematic condition would be weighted less. However, as can be observed in the Tables 1 to 3, the confidence intervals are larger for the 95th percentile of the absolute PEs than for the RMS PE. Thus, these prediction results suggest that both have their advantages and should be reported.
In summary, the pronounced and individual differences in the outcomes of the speech tests, the comparatively high precision of the measurements, and the consideration of common compensation strategies in idealized extreme listening conditions (quiet, stationary, and fluctuating noise) make this empirical data set a very suitable basis for evaluations of prediction models.
Psychoacoustic Data for Model Parameter Inference
The main design goal of the empirical psychoacoustic tests was to obtain precise data about the individual hearing abilities (independent of speech tests) from which the observed outcome of the speech tests could then be accurately predicted. The outcome of the tone-detection task in quiet showed similar results to the clinical audiogram (cf. Figure 1), which indicates that both could serve this purpose. For the SRT prediction and according to the 95th percentile of the PEs, there was no advantage in using the in-situ measured hearing threshold (A) over the audiogram (AG). The observed differences in the hearing thresholds (cf. Figure 1) resulted in different prediction biases (cf. Table 1); which was comparatively low with the AG-individualization (−1.9 dB) and pronounced with the A-individualization (−5.0 dB). For the predictions of benefits in SRT, by contrast, the picture was different. Here, the 95th percentile of the PE reduced from 13.4 dB to 10.7 dB only when using the hearing thresholds that were measured in situ with the SIAM procedure (A), instead of the clinical audiogram (AG). The in-situ measurement—that is, with the same headphones and calibration—avoided systematic measurement errors due to using different equipment for determining the hearing thresholds and for performing the speech tests. In addition, the measurement of the hearing threshold at one frequency with the SIAM procedure was based on more stimulus presentations (at least 25) than is usual for clinical audiograms. The current data set does not allow separating systematic from random errors in measurements of the audiogram, but it shows clearly that precise measurements of hearing thresholds are needed for accurate predictions of benefits in SRT.
The tone-in-noise detection experiments showed a surprisingly high variability in the individual outcomes. Because the noise level was 40 dB SPL per Hz, it exceeded the individual hearing threshold in most of the measurements. For frequencies below 2000 Hz, no tone-in-noise detection levels below 60 dB SPL were found, which means that for all but one listener (cf. right panel in Figure 1), absolute pure tone thresholds were below the lowest tone-in-noise detection threshold. In that frequency range, the differences between listeners were found to be up to 9 dB, where the test–retest reliability can be assumed to lie between 1 dB and 2 dB. Hence, the results strongly indicate that the variance in the tone-in-noise detection thresholds at lower frequencies in Figure 4 could be mainly due to suprathreshold components of hearing loss for all but one listener. Interestingly, when inferring the model parameters from the tone-in-noise detection data, the level uncertainty for the proposed normal-hearing configuration was found to be frequency-dependent between 1.4 dB (at 500 Hz) and 4.4 dB (at 2000 Hz). This finding is qualitatively in line with findings on the tone detection efficiency by Moore et al. (1990).
The outcome of the tone-in-noise detection test was used as an individual measurement of the distortion component of hearing loss, as defined by Plomp (1978) and implemented by Kollmeier et al. (2016), but applied for tone detection instead of speech recognition. Its use improved the prediction accuracy according to all measures (95th percentile of absolute PEs, RMS PE, and correlation coefficient). For the group of 11 listeners for which all tone-in-noise detection threshold were clearly supra threshold, the accuracy of the predicted benefits already reached the theoretical limit, assuming an average test–retest reliability of 2.0 dB. This result clearly shows the potential of tone-in-noise detection tasks to quantify an individual suprathreshold component of hearing loss that could be exploited to increase the accuracy of individual(ly-aided) speech-recognition performance.
The observed outcomes of the in-situ tone and tone-in-noise detection tasks provided data that were suitable for increasing the prediction accuracy far beyond the baseline with the clinical audiogram. The clinical audiogram provided only information for expected maximum (95th percentile of absolute) PEs of 13.4 dB, or average (RMS) PEs of 7.1 dB, whereas the more suitable in-situ tone-detection thresholds improved the maximum PEs to 10.7 dB, or average PE of 5.1 dB. Furthermore, the use of the tone-in-noise detection thresholds reduced the maximum expected error additionally to 7.1 dB and the average PE to 3.4 dB. Hence, the observed psychoacoustic data were very suitable to characterize the individual hearing abilities needed for speech recognition, as tested with the matrix sentence test.
In summary, for a functional characterization of the individual speech-recognition performance with only a few measurements, the results strongly suggest measuring the hearing thresholds with an automatic adaptive procedure, such as, for example, SIAM, and tone-in-noise detection thresholds at high levels, that is, above the hearing threshold.
Individual Aided Performance Predictions
The possibility of obtaining reasonable predictions of the individual speech-recognition performance of individually aided listeners with impaired hearing is new. The results show that individual predictions of the measurable benefit in SRT due to a hearing device are not only feasible but can already be achieved with good accuracy. The fitting process of hearing devices for individual listeners, which is still a manual task, could possibly be aided by model predictions to reduce the required time and improve the fitting result. Such a model-assisted fitting that employs a user-adapted compromise between different model quantities, such as, for example, speech intelligibility and loudness, has been proposed by Völker et al. (2018). However, field tests will be necessary to evaluate whether the prediction accuracy of the proposed model suffices for this task.
Suprathreshold Component of Hearing Loss
The proposed parameter to describe the suprathreshold component of hearing loss was implemented as a level uncertainty (also describable as multiplicative noise or detector noise). This implementation was shown by Kollmeier et al. (2016) to induce a behavior that would be expected from the distortion component of hearing loss according to Plomp (1978). Its individual consideration in the predictions clearly reduced the overestimation of the SRTs, that is, predicted SRT below observed SRT (cf. center and right panel in Figure 7). The remaining overestimation might be due to other factors that are not reflected in the current model, such as, for example, cognitive impairments. The level uncertainty can be used to increase the SRTs almost independently from the presentation level by removing information that is encoded in small differences in amplitude, that is, portions of spectral and temporal dynamics (cf. Figure 2). The predictions by Kollmeier et al. (2016) showed that a part of the removed information is involved in the speech-recognition process, which led to deteriorated recognition performance when removed. The presented data support the hypothesis that the same suboptimal signal processing likewise affects speech-recognition and tone-detection performance of human listeners in noise.
Furthermore, Kollmeier et al. (2016) found that the importance of the information which is removed due to the level uncertainty depends on the noise masker; here, the increase of the distortion component of hearing loss due to an increased level uncertainty was less pronounced for a stationary noise masker than for a fluctuating one. The data do not contradict a translation of this finding to human listeners. In other words, if the suprathreshold component of hearing loss (regarding speech recognition and tone-in-noise detection) can be universally described with the level-uncertainty parameter, which the data suggest, then the effect of the suprathreshold parameter will probably have different consequences for speech recognition in different noise maskers. Also, it might have consequences for the perception of compressed signals, where the differences in amplitude are reduced.
Kollmeier et al. (2016) found that a part of the distortion component of hearing loss can be predicted from the audiogram by using values for the level uncertainty that are typical for a certain group of audiograms. This suggest that the attenuation and distortion component of hearing loss are correlated. Due to the limited number of listeners in this study, a satisfactory estimate of the relationship is, however, beyond the scope of this contribution.
Possible Implications and Opportunities
According to Plomp (1978), the supra-threshold, that is, distortion, component of hearing loss cannot be compensated for by linear amplification and therefore represents a limitation in the compensation of a hearing loss. With increased level uncertainty, the model shows exactly this behavior (Kollmeier et al., 2016). From a model perspective, standard multiband dynamic compression cannot improve the situation, as the dynamics, and hence the differences in the output levels, are only reduced and hence more likely to be exceeded (and masked) by the level uncertainty.
The functional, that is, executable, description of the process that removes the (speech) information that is not available to listeners with impaired hearing offers the opportunity to design signal preprocessing strategies that are specifically tailored to minimize the loss of information, that is, to maximize the speech-recognition performance under this constraint. The proposed model could objectively quantify the effect of such a compensation strategy for the suprathreshold component of hearing loss in terms of speech-recognition performance and might be useful in guiding the development process. If a (partial) compensation of the distortion component of hearing loss is possible, the individual quantification of the level uncertainty would provide relevant information for diagnostic purposes and the prescription of a suitable compensation strategy.
Comparison With Other Models
As discussed by Schädler et al. (2018) and to the best of our knowledge, no model has been successfully evaluated for the prediction of the individual aided speech-recognition performance of listeners with impaired hearing in fluctuating noise conditions. Building and evaluating another model was out of the scope of this contribution. The ASR-based modeling approach FADE has been compared with other models using less complex observed data sets for which compatible models existed in speech recognition as well as in basic psychoacoustic tasks (Kollmeier et al., 2016; Schädler, Hülsmeier, et al., 2016; Schädler, Warzybok, et al., 2016; Schädler et al., 2015, 2018). To facilitate the comparison with future models on the same or other data sets, the anonymized observed data, the MHA configurations, the source code of the measurement procedures, the source code of the modeling framework, including the modified feature extraction as well as the evaluation scripts, are available online. 3
Conclusions
The most important findings of this work can be summarized as follows:
Individual predictions of the outcome of the German matrix sentence test for listeners with aided, impaired hearing are possible with an automatic-speech-recognition-based model (FADE) across a diverse range of (A) degrees of hearing loss, (B) listening conditions, and (C) compensation strategies. This was achieved by simulating the whole speech-recognition process under conditions that closely resemble the corresponding conditions for human listeners. The achieved prediction accuracy was already satisfactory, with an RMS PE of 5.8 dB and a squared correlation coefficient of 0.826 across all predictions, when the model was individualized with the clinical audiogram. The result could be improved to 4.2 dB and 0.940, respectively, by explicitly taking a suprathreshold component (similar to the distortion component of Plomp, 1978) of hearing loss into account. For the benefits in SRT due to different compensation strategies, the improvement was even more pronounced; from 7.1 dB and 0.670 to 3.4 dB and 0.888, respectively. The implementation of a level uncertainty in the feature extraction of the recognition system provides a promising functional description of the suprathreshold component of hearing loss. It appears promising, as its value can be derived individually from a few tone-in-noise detection measurements, and it results in substantial improvements in the prediction accuracy. On the other hand, the approach appears promising because it describes an effective sensory impairment to be compensated for by future signal processing strategies that aim at ameliorating hearing loss beyond the restoration of audibility.
Footnotes
Appendix
Declaration of Conflicting Interests
The authors declared no potential conflicts of interest with respect to the research, authorship, and/or publication of this article.
Funding
The authors disclosed receipt of the following financial support for the research, authorship, and/or publication of this article: This work was funded by the Deutsche Forschungsgemeinschaft (DFG, German Research Foundation) under Germany’s Excellence Strategy—EXC 2177/1—Project ID 390895286. English language support provided by stels-ol.de.