
Abstract
This study investigated how depth variations in the tip of the probe tube affected spectral measures of speech recorded in the external ear canal. Consonant-vowel nonsense syllables were recorded with a probe tube microphone system in 10 adult participants with normal middle ear function. Recordings were made with the probe tube tip placed 1 mm, 5 mm, and 10 mm beyond the medial tip of a custom earmold. The effect of probe depth was evaluated on spectral levels (one-third octave and one-twelfth octave band). Extending the probe tube 10 mm past the medial tip of the earmold gave the most accurate results, with relatively lower sound levels for either the 1-mm or 5-mm insertion depth. In general, the effect of insertion depth was minimal at frequencies below 3 to 4 kHz, although this varied with the specific phoneme and the width of the analysis bands. The authors found no significant difference between 1- and 5-mm insertion depths, suggesting that as long as the tip of the probe tube is sufficiently close to the tympanic membrane to capture the highest frequency of interest, it makes little difference if it is less than 5 mm beyond the earmold tip.
Probe tube measurements have become useful clinical and research tools and are reported to be less variable than behavioral verification measures.1,2 One known source of variability is probe tube insertion depth.2–4 Specifically, the further the tip of the probe tube from the tympanic membrane, the lower (and less accurate) the high-frequency measurement.4,5 This happens because the higher impedance at the tympanic membrane relative to transmission of sound through the ear canal causes sound to be reflected from the tympanic membrane and create standing waves. If the end of the probe tube is located at a pressure minimum, the sound level will be lower at that point. In theory, sound level at this location can be as much as 12 dB lower than the level at the tympanic membrane. 5 For each frequency, the minima occur at a distance of one fourth the sound wavelength.6,7 For frequencies below 2 kHz, the minima occur far enough from the tympanic membrane to reduce interference. However, modern hearing aids commonly have frequency responses extending through 6 kHz. To achieve accuracy out to that frequency, Revit 8 proposes placing the tip of the probe tube within 6 mm of the tympanic membrane. Some authors have suggested that positioning the tip of the probe tube within 1 to 3 mm of the tympanic membrane further reduces error and improves test-retest reliability.9,10
How are we to ensure that the tip of the probe tube is sufficiently close to the tympanic membrane to achieve acceptable accuracy for the signal of interest? An acoustic method in which the nodes of a warble tone are measured11,12 has been shown to be accurate13–15 and was incorporated into some commercial systems but has not achieved widespread clinical use. A tactile method whereby the probe tube is inserted until it touches the tympanic membrane and then is withdrawn a few millimeters has been used in some studies,14,15 but most clinicians will avoid causing even this brief discomfort. A visual method whereby the tympanic membrane is viewed through an otoscope while adjusting the probe tube is awkward and often results in touching the tympanic membrane anyway. 14 In the clinic or in clinically based research, the probe tube is usually inserted at a constant depth relative to a reference point. Two variations have been proposed for clinical use. The first is a probe tube insertion depth of 5 mm beyond the medial tip of the earmold. 3 This is recommended to avoid the acoustic transition zone where the sound transmission pathway changes from a small diameter (earmold tubing) to large diameter (ear canal). The second assumes an adult ear canal length of 35 mm from tragus to tympanic membrane 16 and recommends that the probe tube be extended 30 mm past the tragal notch, which will presumably place the medial tip within 5 mm of the tympanic membrane.7,17 A 28-mm insertion depth is sometimes used as a more conservative estimate to avoid touching the tympanic membrane, and a 25-mm insertion depth has been recommended in children. 18 Several researchers have measured the variability in measured sound level as an effect of probe-tube insertion depth. A summary of these studies is provided in Table 1.
Summary of Studies That Measured Sound Levels as a Function of Probe Tube Insertion Depth

Note: In some cases the subject number represents only those who participated in the relevant portion of a larger study. KEMAR, Knowles Electronic Manikin for Acoustic Research; dB SPL, decibel sound pressure level; CIC, completely in the canal.
Recently, speech signals have been incorporated into some clinical probe tube systems. This trend is driven by improvements in test equipment and by the need for more comprehensive assessment of complex signal-processing amplification. For example, Henning and Bentler 20 noted that wide-dynamic range compression amplification reacts differently with speech than with nonspeech inputs. Thus, using a speech signal to fit a hearing aid to prescriptive targets is the most realistic fitting method and avoids under- or overestimation of hearing aid effects. Probe tube systems allow the fitter to verify whether the dynamic range of aided speech falls within the listener's dynamic range. Probe tube measurements of amplified speech are also used as a counseling tool. 21
More recently, probe tubes have been used in the fitting of amplification and in research by recording speech in the external ear canal.22–24 In contrast to the averaged speech spectra usually displayed in commercial systems, recording allows for closer examination of individual phonemes. For example, we might be interested in assessing whether a particular consonant is audible when both the consonant spectra and the listener's thresholds are expressed as decibel sound pressure level (dB SPL) at the tympanic membrane. The intent is to obtain as accurate a measure as possible within the capabilities of clinical probe tube measurement devices.
The procedural recommendations for probe tube insertion depth2–4,13,25 are based on work using nonspeech signals. With the increasing use of real speech to verify match-to-target, it is important that our measurements are accurate. If the measurement technique introduces error, the final hearing aid fit will be off. Can we automatically extend these findings to speech? It is possible that speech, which contains aperiodic as well as periodic components, might be less susceptible to standing waves and thus more resistant to variations in probe tube depth than pure-tone signals. Also, analysis of recorded speech often uses wider band levels. For example, the Speech Intelligibility Index offers an octave band and one-third octave band configuration. 26 In theory, level reduction due to standing waves has the maximum effect on a frequency whose wavelength is 4 times the distance from the tympanic membrane and progressively less effect the more frequency diverges above or below the maximally affected frequency. The wider the analysis bandwidth, the more frequencies that are less affected will be included, effectively “averaging out” the magnitude of the reduction at a single frequency. Finally, previous work showed the largest effects of insertion depth at high frequencies. To the extent that identification of some phonemes depends on lower-frequency energy, those levels might be relatively less important. Accordingly, the goal of the present study was to quantify acoustic effects of varying the depth of the probe tube on recording of speech in the external ear canal.
Methods
Participants
Ten adults aged 20 to 26 years (9 women and 1 man) with no history of middle ear problems participated in this study. An otoscopic examination confirmed that external ear canals were free of obstruction in all subjects, and normal middle ear function was established on tympanometry (middle ear pressure, +50 to −50 daPa; middle ear compliance, +0.3 to +1.5 mL, with a probe tone frequency of 226 Hz) and 1 kHz ipsilateral acoustic reflex thresholds (<100 dB hearing level).
Stimuli
Two stimuli sets were used in this study: a speech-weighted noise and nonsense syllable tokens. A speech-weighted noise from the compact disk recording of the Speech Intelligibility Rating (SIR) Test 27 was used as a control condition. This is a broadband signal as used in some previous studies of insertion depth13,19 but more closely approximates the long-term spectrum of speech with a high-frequency roll-off of approximately 6 dB per octave above 0.5 kHz.
The speech tokens consisted of consonant-vowel /Ci/ tokens from the University of California, Los Angeles (UCLA) version of the Nonsense Syllable Test (NST) 28 spoken by a female talker. Four consonants, 1 voiced and 1 voiceless fricative (/z/ and /s/); and 1 voiced and 1 voiceless stop (/d/ and /t/) were included. The voiceless tokens were chosen to include higher frequency consonants in response to previous findings indicating that the largest effects of probe tube insertion depth occur in the high frequencies.2–4 Voiced consonants were chosen to mirror the place feature of their unvoiced counterpart.
Procedures
A custom, Lucite, skeleton earmold with a 1.5-mm probe vent drilled parallel to the sound bore was ordered for the right ear for each of the 10 participants. An ER-3A earphone was coupled to the earmold. All recordings took place in a double-walled audiometric sound booth. The Etymotic Research ER-7C probe tube system was used to make in-the-ear recordings of the speech tokens. The probe tubes for this system are precalibrated. Before testing each subject, the probe tube (recording) system was calibrated using a voltmeter and the manufacturer's calibration tone.
Recordings were made of each stimulus with the probe microphone placed 1 mm, 5 mm, and 10 mm beyond the medial tip of the earmold. We chose to reference the insertion depth to the earmold because this is a common clinical technique, as opposed to the more accurate but less used tactile, acoustic, or otoscopic visualization methods. Most of the test subjects were women. The single male had a small-to-average ear size. With an average earmold insertion depth of approximately 10 mm beyond the canal entrance, the deepest (10 mm) insertion depth should place the tip of the probe tube within 5 mm of the tympanic membrane.
Before placing the earmold in the ear, the probe tube was inserted through the earmold vent. The insertion depth was measured and marked on the probe tube so that the mark would be visible at the outer edge of the probe vent. The probe tube was inserted through the vent and secured with putty to ensure that the insertion depth was maintained and to prevent sound leakage through the vent. The earmold was then placed in the participant's ear canal and recordings were made. Participants were instructed to remain still during the recording process. Between successive probe depths, the earmold was removed, and the measurement procedure was repeated.
Nonsense syllables and speech-weighted noise stored on compact disc were routed to the participant's ear through a diagnostic audiometer at a root-mean square (RMS) level of 78 dB SPL, expressed in a 2-cc coupler. Because the consonant levels in the NST vary over an approximately 25-dB range as they would in conversational speech, we expected that the consonants, especially the voiceless consonants, could be as much as 25 dB lower than the level of the entire syllable. Accordingly, the presentation level was chosen to maintain a consonant intensity that was above the noise floor of the ER-7C probe tube system for all recordings. The following measures were recorded for each subject: (1) Three repetitions of each of the 4 nonsense syllables at 1-mm, 5-mm, and 10-mm insertion depth. The 3 repetitions ensured that extra exemplars would be available for analysis in the event that an unexpected subject movement or cough distorted 1 recording. (2) Three to five seconds of speech-weighted noise at 1-mm, 5-mm, and 10-mm insertion depth. (3) Three to five seconds of speech-weighted noise at 5-mm insertion depth (repeatability measure). For the repeatability measure, an additional recording of the speech-weighted noise was made as follows: After the initial recording, the earmold was removed and the probe tube taken out of the vent. The probe tube was then remeasured at 5 mm and reinserted into the probe vent, and the earmold was replaced. A recording of the speech-weighted noise was repeated. (4) A calibration tone (1 kHz) was also recorded for each participant and used to determine speech levels in dB SPL. In each case, the output of the ER-7C probe recorder was low-pass filtered at 10 kHz and digitally recorded at a sampling rate of 44.1 kHz (TDT AP2) to a computer hard drive for later analysis.
Acoustic Analysis
Consonant Spectra
One nonsense syllable recording was selected from the 3 exemplars for analysis. Typically, the 3 exemplars for each consonant were visually and audibly identical, but occasionally a brief subject movement resulted in recording of a click in 1 exemplar; in those cases, 1 of the 2 undistorted samples was selected. Spectral analysis was limited to the consonant. The criteria for choosing consonant segments for analysis were adapted from Jenstad and Souza 29 and are briefly summarized here. For the voiceless fricatives, the boundary between the consonant and vowel was identified using 3 criteria: onset of voicing, amplitude change viewed on the energy contour, and offset of frication noise. The selected segment was an 80-millisecond segment prior to the consonant-vowel boundary. For voiced fricatives, the analysis segment was 80 milliseconds long, starting from the point at which the formant structure began. For the voiced and voiceless stops, the analysis segment was 10 milliseconds starting at the release burst. For each consonant segment, one-third octave band levels (16 bands with center frequencies from 0.25 kHz to 8 kHz) and one-twelfth octave band levels (60 bands with center frequencies from 0.25 to 7.77 Hz) were calculated. The one-third octave band levels were initially calculated using speech analysis software and verified using the one-third octave band analysis mode of a spectrum analyzer (Hewlett-Packard 35661; Palo Alto, Calif). The one-twelfth octave band levels were measured using the one-twelfth octave band analysis mode of the spectrum analyzer.
Speech-Weighted Noise
A 500-millisecond portion of the speech-weighted noise was randomly selected for spectral analysis. One-third octave band levels were calculated using speech analysis software.
Results
One-Third Octave Band Levels for Consonant Spectra
Figures 1 and 2 display the mean one-third octave band levels for each of the 4 phonemes. A 3-way analysis of variance (ANOVA) was performed to evaluate the effects of insertion depth on the levels recorded for each phoneme. Significant effects ∗ were discovered for the phoneme by insertion depth by frequency interaction (F90,810 = 2.92, P < .001). Post hoc analysis revealed a significant interaction of insertion depth and frequency only for the phonemes /s/ (F30,270 = 6.21, P < .001) and /z/ (F30,270 = 2.27, P < .001).

Mean one-third octave band levels in decibel sound pressure level (dB SPL) for in-the-ear recordings of the stops, /t/ and /d/. Error bars show ±1 standard error of the mean. In each panel, results for the 1-mm insertion depth are shown by the open circles; 5-mm insertion depth, by filled squares; and 10-mm insertion depth, by open triangles.

Mean one-third octave band levels in decibel sound pressure level (dB SPL) for in-the-ear recordings of the fricatives, /s/ and /z/. Error bars show ±1 standard error of the mean. In each panel, results for the 1-mm insertion depth are shown by the open circles; 5-mm insertion depth, by filled squares; and 10-mm insertion depth, by open triangles.
A 1-way ANOVA was completed for each one-third octave band for all insertion depths of /s/ at the Bonferroni-adjusted α level of .003. Significant effects of insertion depth were found at 5 kHz (F2,18 = 9.66, P = .001), 6.3 kHz (F2,18 = 22.55, P < .001), and 8 kHz (F2,18 = 8.68, P = .002). Paired sample t tests for all combinations of the 1-mm, 5-mm, and 10-mm insertion depths were completed for each frequency at the α = .017 (Bonferroni-adjusted) significance level. In each case, the band level measured at the 10-mm insertion depth was significantly higher than that at either the 1-mm or the 5-mm insertion depths. Inserting the probe tube to 10 mm resulted in about a 6 dB higher level than the shallower insertion depths. The band levels for the 1-mm versus 5-mm insertion depths were statistically different at 5 and 6.3 kHz and statistically similar at 8 kHz. However, those level differences were generally small, with band levels at the 5-mm insertion depth greater by 2 dB or fewer.
Similarly, a 1-way ANOVA was completed for each one-third octave band for all insertion depths of /z/ at the Bonferroni-adjusted α level of .003. Significant effects of insertion depth were found at 5 kHz (F2,18 = 8.96, P = .002) and 6.3 kHz (F2,18 = 20.44, P < .001). Paired sample t tests for all combinations of the 1-mm, 5-mm, and 10-mm insertion depths were completed for each frequency at the A = .017 (Bonferroni-adjusted) significance level. As was the case with /s/, the band level measured at the 1-mm insertion depth was significantly higher than that at either the 1-mm or the 5-mm insertion depths. Inserting the probe tube to 10 mm resulted in about a 3 dB higher level than the shallower insertion depths.
For the 2 stop consonants, there was no difference in sound level as insertion depth was varied (/t/: F2,18 = 1.49, P = .254; /d/: F2,18 = 0.68, P = .458). As expected, the main effect of frequency was significant for all consonants (P < .001).
One-Twelfth Octave Band Levels for Consonant Spectra
Figures 3 and 4 display the mean one-twelfth octave band levels for each of the 4 phonemes. A 3-way ANOVA was performed to evaluate the effects of insertion depth on the levels recorded for each phoneme. Because the phoneme by insertion depth by frequency interaction was significant (F354,3186 = 1.27, P = .001), each phoneme was analyzed separately. Within each phoneme, the insertion depth by frequency interaction was significant, although at slightly different levels (/t/: F118,1062 = 2.37, P < .001; /d/: F118,1062 = 1.60, P < .001; /s/: F118,1062 = 3.59, P < .001; /z/: F118,1062 = 1.28, P = .029). Because of the large number of bands, comprehensive post hoc testing was not attempted. Instead, the mean values shown in Figures 3 and 4 were used to identify the frequency above which band levels varied as a function of insertion depth. Selected post hoc tests were then used to support those conclusions. For example, a visual inspection of the data for /t/ (Figure 3, top panel) suggested that insertion depth began to affect measurements at approximately 4 kHz. This finding was supported by similar values at 2.9 kHz (F2,18 = 2.59, P = .103) and dissimilar values at 3.8 kHz (F2,18 = 4.68, P = .023) and 4.9 kHz (F2,18 = 23.44, P < .001). Paired sample t tests confirmed that the sound level was higher with the 10-mm insertion compared to either the 1- or 5-mm insertion depth (P < .001). The pattern for /d/ was similar (Figure 3, lower panel). Specifically, band level did not vary with insertion depth at 2.9 kHz (F2,18 = 2.70, P = .094) but did vary at 3.8 kHz (F2,18 = 7.58, P = .004).
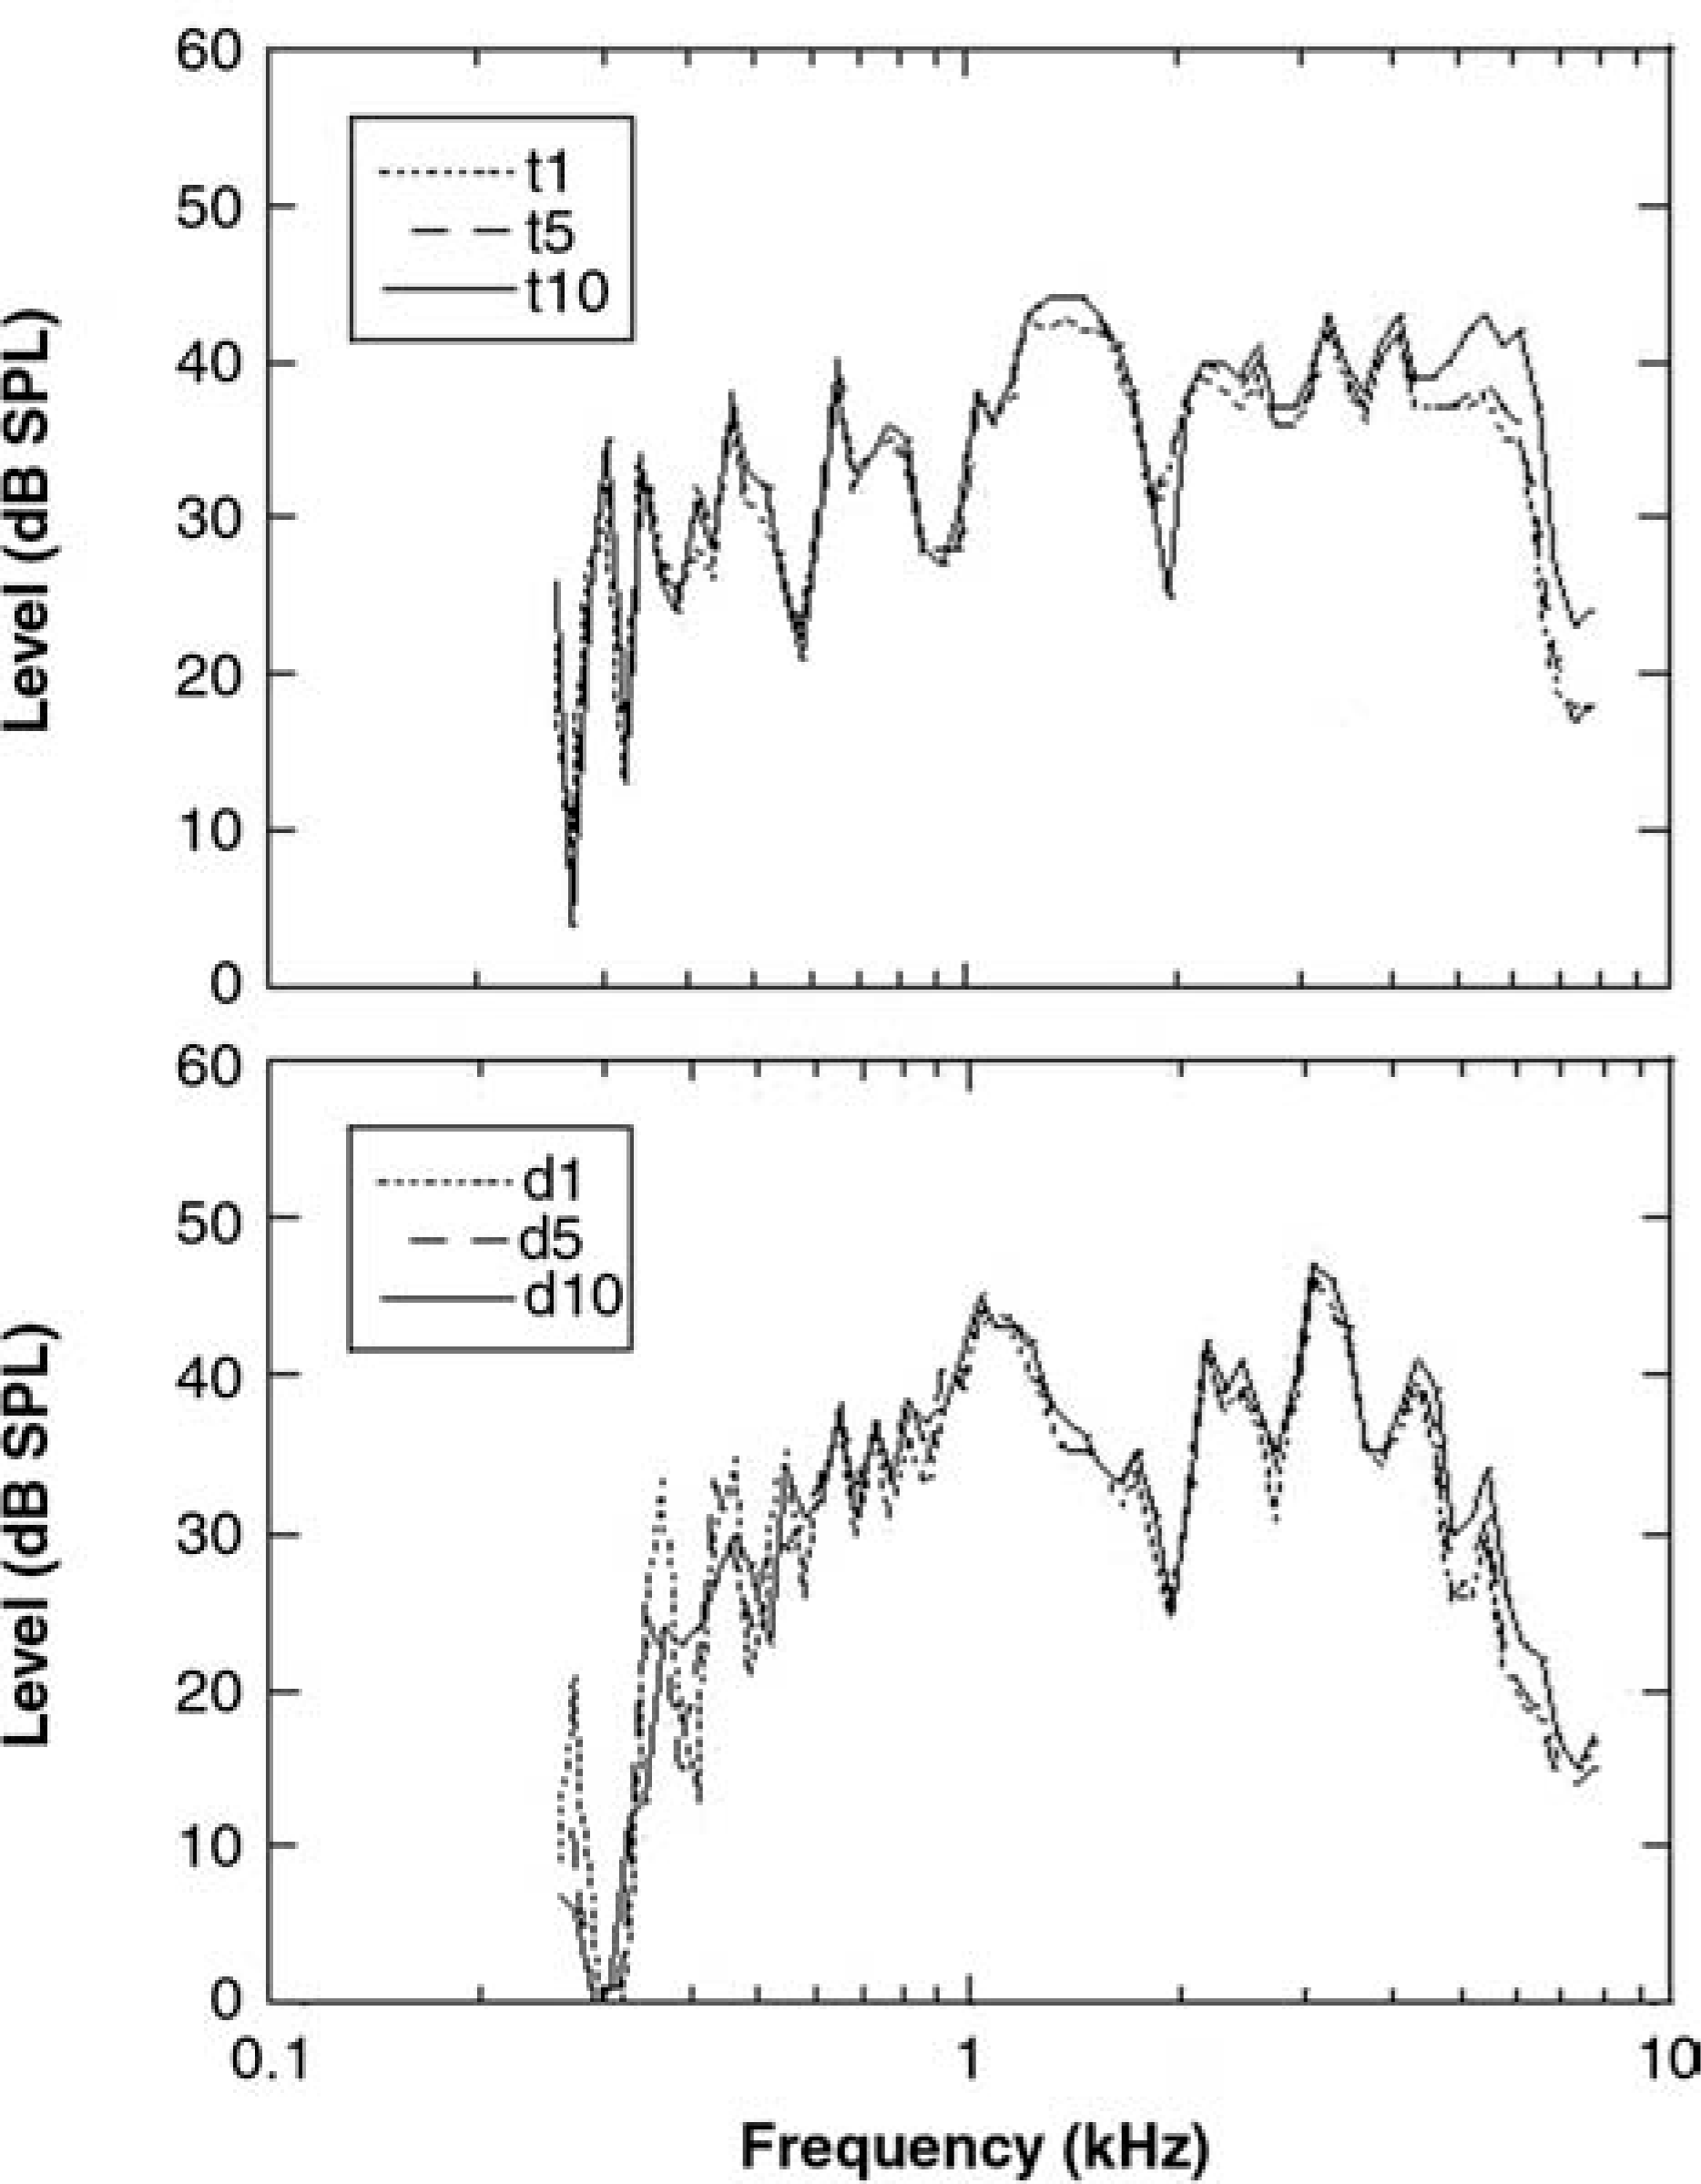
Mean one-twelfth octave band levels in decibel sound pressure level (dB SPL) for in-the-ear recordings of the stops, /t/ (top panel) and /d/ (lower panel). Each panel shows 3 probe tube insertion depths relative to the medial tip of the earmold: 1 mm (dotted), 5 mm (dashed), and 10 mm (solid) as a function of frequency.
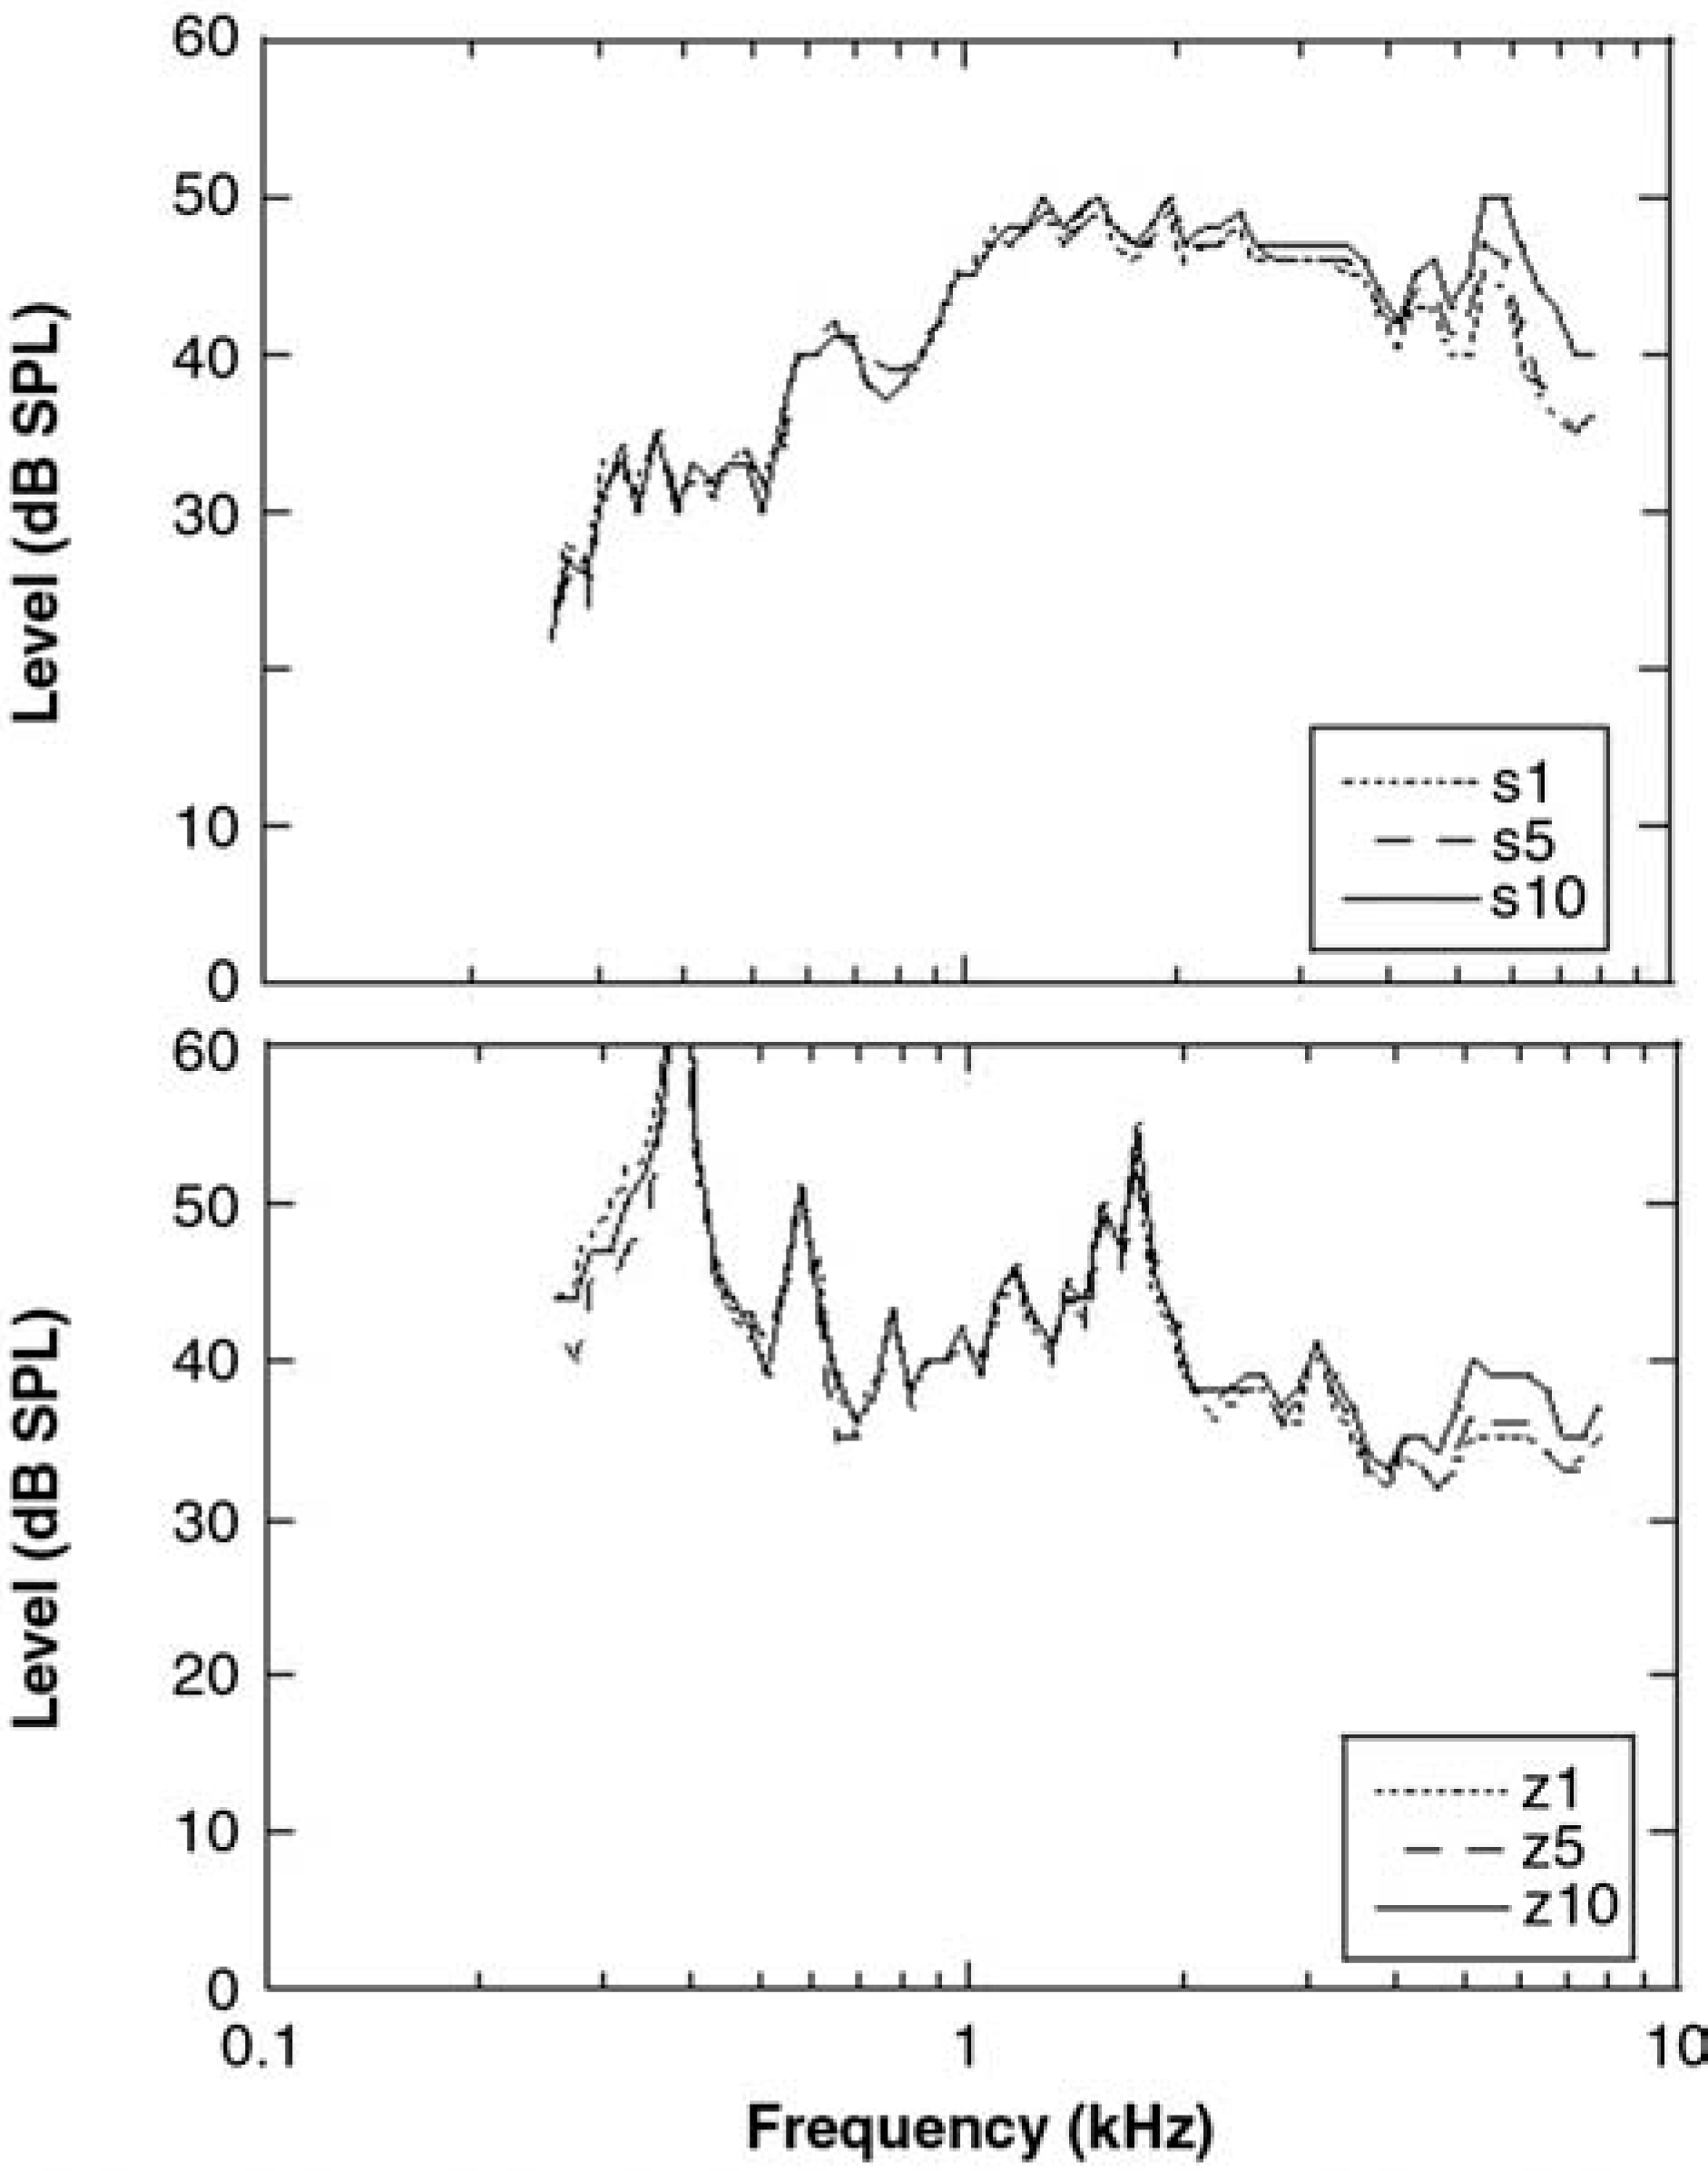
Mean one-twelfth octave band levels in decibel sound pressure level (dB SPL) for in-the-ear recordings of the fricatives, /s/ (top panel) and /z/ (lower panel). Each panel shows 3 probe tube insertion depths relative to the medial tip of the earmold: 1 mm (dotted), 5 mm (dashed), and 10 mm (solid) as a function of frequency.
For /s/ (Figure 4, top panel) insertion depth affected lower frequencies than for /t/ and /d/. The levels began to diverge at approximately 2.7 kHz. This was supported by similar values at 1.9 kHz (F2,18 = 0.35, P = .707) and dissimilar values at 2.9 kHz (F2,18 = 8.32, P = .003). Band level measured with a 10-mm insertion depth was greater than either the 1-mm (P = .005) or 5-mm (P = .008) conditions, whereas the 1- and 5-mm conditions were similar (P = .509). In contrast, results for /z/ (Figure 4, lower panel) showed no effect of insertion depth until 4 kHz or higher. Band levels were similar at 2.9 kHz (F2,18 = 0.99, P = .390) and 3.9 kHz (F2,18 = 0.39, P = .684) and dissimilar at 4.9 kHz (F2,18 = 3.96, P = .038).
Speech-Weighted Noise
Figure 5 displays the mean levels recorded for repeated speech-weighted noise measurements at 5 mm. A 2-way repeated-measures ANOVA was undertaken (test number × frequency) to look for significant differences when the probe was removed and replaced at the same depth in the ear canal. No significant interactions of test number and frequency were observed (F15,135 = .45, P = .960). The main effect of test number was not significant (F1,9 = .52, P = .488), indicating good consistency of measurements with probe tube removal and replacement. As expected, a significant main effect for frequency was observed (F15,135 = 265.89, P < .001).

Mean one-third octave band levels in decibel sound pressure level (dB SPL) for repeatability measures using speech-weighted noise at 5 mm. Error bars show ±1 standard error of the mean.
A 2-way repeated measures ANOVA (insertion depth × frequency) was performed to assess the effects of insertion depth. A significant effect was found for the interaction of insertion depth by frequency (F30,270 = 5.12, P < .001). A series of 1-way ANOVA was undertaken to evaluate the specific frequencies for which the interaction was occurring, and revealed significant effects of insertion depth only for 6.3 kHz (F2,18 = 16.39, P < .001) and 8 kHz (F2,18 = 20.52, P < .001).
Paired sample t tests for all combinations of the 1-mm, 5-mm, and 10-mm insertion depths were completed for 6.3 kHz and 8 kHz at the α = .017 (Bonferroni-adjusted) level. For 6.3 kHz, the level at the 10-mm insertion depth was significantly greater than either 5 mm (P = .009) or 1 mm (P = .001). The difference between 1 and 5 mm was not significant at the Bonferroni-adjusted level (P = .020). For 8 kHz, the level at the 10-mm insertion depth was significantly greater than either 5 mm (P = .001) or 1 mm (P = .001). The difference between 1 and 5 mm was not significant at the Bonferroni-adjusted level (P = .637).
Discussion
What insertion depth should be used when recording speech in the ear canal? For all of the stimuli, extending the probe tube 10 mm past the medial tip of the earmold gave the most accurate results, with relatively lower sound levels for either the 1-mm or 5-mm insertion depth. This trend was consistent with previous recommendations.7,8 The reduction in level at shallow insertion depths was approximately 2 to 6 dB, consistent with previous data for pure tones2,7 and aperiodic noise.9,25 However, our pattern of probe depth variation as a function of frequency was smaller than shown in some previous studies. For example, Hawkins and Mueller 7 found extending the probe tube only 2 mm beyond the medial tip of the earmold reduced sound levels for frequencies as low as 1.5 kHz. Our data, in contrast, showed little effect of insertion depth for frequencies below 3 to 4 kHz.
The current data were analyzed using one-third or one-twelfth octave bandwidths, in contrast to some clinical probe tube systems that apply narrower analysis bands. At higher frequencies, the one-third octave bandwidth would have been fairly wide. Recall that level reduction due to standing waves is calculated to have the maximum effect on a frequency whose wavelength is 4 times the distance from the tympanic membrane and progressively less effect on adjacent frequencies. With a wider analysis bandwidth, more frequencies will be included, effectively averaging out the magnitude of the reduction at a single frequency. Thus, we might expect larger effects of insertion depth when output signals are analyzed using narrower frequency bands. This was supported by the one-twelfth octave band analysis, which showed high-frequency effects of varying insertion depth for more phonemes and at a wider range of frequencies than for the one-third octave band analysis.
The consequences of a shallower insertion depth depended on the input signal and the intended analysis. For example, there was no change in speech level, as insertion depth was varied for the one-third octave band analysis of /t/ or /d/. However, there was much larger effect for the one-twelfth octave band analysis of /s/, with mean change in band level as large as 6 dB and at frequencies as low as 2.7 kHz. How high a frequency should we be concerned about? Some recent studies have emphasized the importance of audible high-frequency speech information. For some speakers, including adult females and children, speech sounds extend well above 3 kHz.31,32 Stelmachowicz et al 33 suggest that hearing aid responses may need to extend as high as 9 kHz to preserve /s/ and /z/ audibility across a range of talkers. Inaudibility of this information can result in delayed phonological development in hearing-impaired children. 34
In this study, signals were presented through an insert earphone and thus had an extended high-frequency response. For analog hearing aids, a frequency-gain response was considered adequate if it amplified through 3 kHz. 31 Digital aids have frequency responses that extend to 6 kHz or higher. To evaluate such amplification effects, accurate measurement of high-frequency levels is necessary.
Clearly, there is a penalty to being too far from the tympanic membrane, in that high-frequency sounds will be attenuated compared to the level received by the listener. Is there any negative consequence to being too close to the medial tip of the earmold? For clinical use, previous recommendations were to insert the probe tube at least 5 mm beyond the medial tip of the earmold or hearing aid shell. This was based on calculations by Burkhard and Sachs. 3 The intent was to avoid unexpected effects in the sound transition zone immediately medial to the sound bore. However, a close reading of the article by Burkhard and Sachs leaves the impression that this was a general caution instead of a hard rule. Indeed, Burkhard and Sachs acknowledged that the pressure variations within the ear canal were likely to be smaller than in the hard-walled cavity on which they based their calculations. We found no significant difference between 1- and 5-mm insertion depths for the speech stimuli. Our data suggested that as long as the tip of the probe tube is sufficiently close to the tympanic membrane to capture the highest frequency of interest, it makes little difference if the probe tube tip ends fewer than 5 mm beyond the earmold tip. This finding was supported by Scollie and colleagues 19 who found little effect of varying probe tube extension between 0 and 6 mm beyond the tip of the completely-in-the-canal shell. Clinically, this is likely to be of greatest relevance in cases of deeply seated earmolds or completely-in-the-canal shells, where the tip of the aid is close enough to the tympanic membrane so as to make a 5-mm further extension difficult.
Finally, the speech-weighted noise portion of the study confirmed that probe microphone measures can be done in a clinical situation with good test-retest reliability. Although our data were collected in a research laboratory, we used equipment and measurement techniques similar to those that might be used by a clinical audiologist. Our subjects were mostly women with small-to-average adult ear canal size, but none complained about discomfort from the tip of the probe tube relative to their tympanic membrane. Taken together, these results encourage the use of speech measurements and recordings in clinical and research assessment of hearing aids.
Acknowledgments
This work was supported by the National Institutes of Health (1 R01 DC006014). The authors thank Tom Rees for his input on study design and Gus Mueller and 2 anonymous reviewers for helpful comments on a previous version of this article. The authors extend a special thanks to Caitlin Rawn for her help with data analysis.
Footnotes
∗
For each reported analysis, Mauchly's test 30 was evaluated, and the Greenhouse-Geiser adjusted values were used if the assumption of sphericity was violated.