
Abstract
This systematic review, the first on this topic, aimed to investigate if probe-tube verification of real-ear hearing aid amplification characteristics improves outcomes in adults. The review was preregistered in the Prospective Register of Systematic Reviews and performed in accordance with the guidelines of the Preferred Reporting Items for Systematic Reviews and Meta-Analyses. After assessing more than 1,420 records from seven databases, six experimental studies (published between 2012 and 2019) met the inclusion criteria; five were included in the meta-analyses. The primary outcome of interest (hearing-specific, health-related quality of life) was not reported in any study. There were moderate and statistically significant positive effects of probe-tube real-ear measurement (REM), compared with the manufacturer’s initial fit, on speech intelligibility in quiet settings (standardized mean difference [SMD]: 0.59) and user’s final preference (proportion difference: 52.2%). There were small but statistically significant positive effects of REM on self-reported listening abilities (SMD: 0.22) and speech intelligibility in noise (SMD: 0.15). The quality of evidence for these outcomes ranged from high to very low. The findings show that REMs improve outcomes statistically, but this is based on a small number of studies and a limited number of participants. It is currently unclear if the benefits are of material importance because minimum clinically important differences have not been established for most of the outcomes. Ultimately, there needs to be a cost-effectiveness analysis to show that statistically significant benefits, which exceed the minimum clinically important difference, are worth the cost involved.
Hearing loss is the most prevalent sensory deficit, affecting more than 5% of the world’s population (Mathers et al., 2000; World Health Organization, 2020). Untreated hearing loss reduces peoples’ ability to communicate, which leads to social isolation, depression and decreased quality of life (Davis et al., 2007). Hearing loss is associated with an increased risk of cognitive decline and dementia but causality is unknown (Loughrey et al., 2018). The rate of unemployment among individuals with hearing loss is higher than that of the general population, costing the UK economy about £25 billion annually (International Longevity Centre UK, 2014).
Sensorineural loss accounts for more than 90% of all adults with hearing loss in the UK (Action on Hearing Loss, 2015). The primary intervention for permanent hearing loss is acoustic hearing aids (Kochkin, 2009). These devices are designed to restore audibility of low-level sounds, maximize intelligibility of conversational level speech, and maintain comfort for loud sounds (Dillon, 2012; Mueller, 2005; Ricketts et al., 2019). Hearing aids are effective at improving hearing-related quality of life in adults with mild and moderate hearing loss (Ferguson et al., 2017).
The amplification characteristics for each hearing aid user are specified according to prescription formulae (e.g., National Acoustic Laboratories Non-Linear 2 [NAL-NL2] and Desired Sensation Level Version 5; Keidser et al., 2011; Scollie et al., 2005). Hearing aid fitting software can approximate the prescription characteristics, sometimes known as initial fit settings. Alternatively, real-ear measurement (REM) involves placing a probe-tube microphone into the ear canal and is used to verify that the real-ear output of the hearing aid matches the prescription target.
Numerous studies have shown that the initial-fit settings can significantly deviate from prescription targets (Aarts & Caffee, 2005; Aazh & Moore, 2007; Munro et al., 2016). These studies have also shown that REMs improve the match to the prescription targets. REMs have been endorsed by hearing professional societies (e.g., the American Academy of Audiology Task Force Committee, 2006; the British Society of Audiology, 2018). Nevertheless, it remains unclear if the improved match to prescription targets result in better patient outcomes.
Determining the effectiveness of REMs is important to decision-makers and stakeholders. Using REMs requires additional equipment, space, and consumables. Also, the typical UK National Health Service prescription and fitting appointment takes 60 min (British Academy of Audiology, 2016), seven of which is required for REMs (Folkeard et al., 2018), and this could otherwise be used for counselling. The findings have implications for the emerging category of over-the-counter (sometimes called direct-to-consumer) hearing aids for which the use of REM is not easily possible. If REMs do not result in a better patient outcome, a potential obstacle to over-the-counters and self-fitting hearing aids is overcome. The objective of this review was to systematically evaluate the evidence on whether the use of REMs to match the hearing aid’s amplification characteristics to a validated prescription target improves outcomes in adult hearing aid users.
Methods
The protocol for this systematic review was preregistered with the International Prospective Register of Systematic Reviews (PROSPERO; CRD42020166074) and published in BMJ Open (Almufarrij et al., 2020). The systematic review’s method was reported in accordance with Preferred Reporting Items for Systematic review and Meta-Analyses (PRISMA) guidelines (Shamseer et al., 2015).
Eligibility Criteria
The inclusion and exclusion criteria for studies were structured in accordance with participants, interventions, comparators, outcomes, and study designs (PICOS) elements.
Participants
Adults (≥18 years old) with any specified degree of sensorineural or mixed hearing loss. Studies that report only a qualitative description of age and threshold of hearing were also included. No studies were identified, and excluded, because of conductive or fluctuating hearing loss.
Interventions
Conventional acoustic hearing aids, intended to be fitted by a qualified hearing professional, were programmed to a prescription target using a REM system. Assistive listening devices, hearables, personal sound amplification products, and direct-to-consumer hearing devices were excluded. Implantable devices (e.g., cochlear implants), bone conduction hearing aids, or contralateral routing of sounds hearing aids were also excluded.
Comparators
Hearing aids were programmed to the manufacturers’ approximation of a response appropriate to the wearers hearing loss without verification with REMs (i.e., initial-fit approach). Just as occurs in practice, the prescription that was being approximated could be a validated, published prescription (as typically used for REM fittings), a manufacturer’s intentional variation of a published prescription, or a manufacturer’s proprietary prescription. In this review, the term initial fit will be used to refer to the comparator.
Outcomes
The primary outcome of interest was hearing-specific, health-related quality of life (e.g., Hearing Handicap Inventory for the Elderly; Ventry & Weinstein, 1982). Secondary outcomes of interest were self-reported listening ability (e.g., abbreviated profile of hearing aid benefit [APHAB]; Cox & Alexander, 1995), composite self-report measures (e.g., International Outcomes Inventory for Hearing Aids; Cox & Alexander, 2002), speech recognition in quiet or noisy settings, generic health-related quality of life, hours of hearing aid use per day, sound quality, preference, number of required follow-up care sessions (i.e., for further fine-tuning), and adverse events (e.g., noise-induced hearing loss).
Study Designs
Randomized and non-randomized controlled trials were included. Case reports, conference abstracts, book chapters, dissertations, theses, reviews, and clinical guidelines were excluded. However, two gray literature papers (Amlani et al., 2017; Leavitt & Flexer, 2012) were known about and are briefly considered in the discussion section.
Information Sources
Studies were identified using a systematic search strategy of the following databases: Cochrane Library, Embase (via OVID), Emcare (via OVID), MEDLINE (via OVID), PsycINFO (via EBSCOhost), PubMed, and Web of Science. No search restrictions were applied in terms of the publication’s language, status, and year. The reference lists of the included publications were manually scanned to identify further studies. Using Google Scholar “cited by” feature, publications that have cited any of the included studies were screened to identify additional relevant articles. All searches were performed on January 20, 2020.
Search Strategy
The search protocol and methods were developed by a medical information specialist from Systematic Review Solutions Limited. The search terms were based on experts’ opinion, free text, and controlled terms from Medical Subject Headings (MeSH), Excerpta Medica Tree (EMTREE), and Cumulative Index of Nursing and Allied Health Literature (CINAHL) headings. The search strategies for all databases are reported in the Supplementary Material 1.
Data Management
Search result, including title, authors’ detail, publication year, publication journal, and abstract, were extracted to EndNote X9 Reference Management software. The same software was used to remove any duplicates prior to the initial screening. Next, one author (I. A.) exported the title and abstracts of all identified articles into an Excel spreadsheet so that they could be easily screened against the eligibility criteria. The reason for any article’s exclusion was documented. Each article was assigned a unique number that was linked to the full details of the article.
Selection Process
The title and abstract of all identified studies were screened independently by two authors (I. A. and K. J. M.) to determine eligibility for inclusion. A more detailed inspection was used when there was a discrepancy between the two investigators; this included assessing the full article. In this screening stage, there were discrepancies, which occurred in 1.4% of cases (resolved by discussion). The full text was retained and inspected by I. A. and K. J. M. for all articles that matched the inclusion criteria. There was complete agreement between the two full-text inspectors. Following PRISMA recommendations (Moher et al., 2009), a flow diagram was used to present the study selection process.
Data Collection Process and Data Items
Data from the eligible studies were extracted by I. A. and verified by K. J. M. to check for consistency. There was complete agreement between the two data extractors. The data were extracted into a predesigned data extraction form adapted from the Cochrane handbook (Higgins & Green, 2008). The extracted data comprised of authors (year), methods, participants, intervention, and outcomes. Data presented on graphical forms were extracted using an online extraction tool (WebPlotDigitizer; https://automeris.io/WebPlotDigitizer) when necessary.
Risk of Bias in Individual Studies
The assessment of the risk of bias was conducted independently by all three authors. Disagreements, which occurred in 12% of cases, were resolved using a majority decision. Given the limited number of randomized controlled trials in the field of audiology, it was anticipated that most of the extracted studies would be non-randomized controlled trials; therefore, the Downs and Black (1998) checklist was used because it is easy to administer, has well-established validity and reliability, and can be used to assess the methodological quality of both randomized and non-randomized studies. Because knowledge of the minimum clinically important differences in hearing aid outcomes is lacking, scoring for the final item (number 27) was modified based on whether or not a power calculation was performed. That is, one point was awarded if a power calculation was conducted and zero points if it was not. Consequently, the maximum score was 28 (instead of the original scoring of 32). Articles scoring 26–28, 20–25, 15–19, and <14 were regarded as having excellent, good, fair, and poor quality, respectively (Hooper et al., 2008).
Data Analysis
A meta-analysis was conducted for each outcome using Review Manager 5.3. As some of the studies used different continuous outcomes, the standardized mean difference (SMD; mean difference between conditions divided by the pooled standard deviation [SD]) was computed along with its 95% confidence interval (CI). The formulae used are reported in Supplementary Material 2. For studies that used more than one measure to assess the same outcome (e.g., speech intelligibility tests at different input levels), the findings were averaged and pooled in the meta-analyses. If the statistical heterogeneity across studies was identified as low, fixed-effect meta-analyses were computed; otherwise, a random-effect meta-analysis was calculated. For each meta-analysis, the estimated effect size was calculated using generic inverse of variance weighting. The effect estimate was reported along with its 95% CI. Forest plots were used to present these results. Asymmetrical distribution of continuous outcomes (i.e., skewed data) was assessed by subtracting the lowest possible value from the mean and then dividing the result by the SD. A ratio below 2 or 1 either suggests or indicates a skewed distribution, respectively (Deeks et al., 2019). Skewed data were non-linearly transformed (using an arcsine transformation) to better approximate a normal distribution. All statistical tests were performed at .05 alpha level.
Subgroup Analysis
Plausible sources of heterogeneity were explored using unplanned subgroup analyses of studies that used the same or different prescription formulae for the intervention and control conditions.
Assessment of Reporting Bias
Publication bias is well known in science in general, and in medicine and health care in particular (Kyzas et al., 2007; Turner et al., 2008; Tzoulaki et al., 2013). Although the authors intended to check for publication bias using a funnel plot of the precision (standard error) as a function of intervention effect estimates, this was not possible because fewer than ten studies reported each outcome (Sterne et al., 2011).
Assessment of Heterogeneity
The percentage of variability between studies’ outcomes, which is due to heterogeneity rather than random error, was computed in Review Manager 5.3 using an I2 statistic. Given that the absolute threshold of I2 can be misleading, the results were interpreted as low (0–40%), medium (41–60%), or high (61–100%) heterogeneity.
Dealing With Missing Data
The authors were contacted if any of the data were missing. If SDs were missing and could not be obtained from the authors, they were inferred from the available data (e.g., 95% CI or standard errors). Missing correlation coefficients between interventions, which is required to precisely calculate CIs around the effect sizes for within-subject design studies (the design used in all included studies), was estimated from the other included studies (i.e., the average correlation coefficients).
Confidence in Cumulative Estimate
The quality of evidence for each outcome measure was rated as high, moderate, low, or very low using the Grading of Recommendations, Assessment, Development and Evaluations (GRADE) tool (Atkins et al., 2004). The GRADE tool takes into account five principal domains: study limitations (e.g., blinding and allocation concealment), inconsistency (e.g., no overlap of CIs between studies), indirectness (e.g., difference between the study sample and the population of interest), imprecision (e.g., broad CI), and publication bias (e.g., selective reporting of positive outcomes). Randomized controlled trials without serious shortcomings were, in principle, rated as high-quality evidence (i.e., our confidence level is high enough to conclude that the true effect is close to the estimated effect). Crossover designs, where each participant acted as their own control and the order of trialing intervention and comparator was counterbalanced, were regarded as equal in quality to randomized controlled trials in which each participant was assigned to only one arm. However, the assigned rating was subject to downgrading by either one or two points on the basis of the seriousness of the aforementioned assessment domains. If the review team were in a borderline situation (referred to a “close-call situation” in GRADE) regarding two quality issues, the quality of evidence was downgraded by one point (Schünemann et al., 2013). A thorough discussion of these factors can be found in Schünemann et al. (2013). The three authors carried out the assessment independently and disagreements were resolved by discussion. The GRADEpro online platform (https://gradepro.org/) was used to develop the summary of findings table (see later).
Results
Search and Selection of Studies
The selection process is shown in the PRISMA flow diagram (Figure 1). The database search identified 2,243 records, of which 1,420 duplicate records were removed. The titles and abstracts of the remaining 823 articles were screened, and 811 articles were discarded because they did not meet the eligibility criteria. The full texts of the remaining 12 articles were retrieved for further assessment. Of these, eight were removed because the intervention and comparator used were irrelevant to the review question (e.g., Humes et al.’s, 2017, article was excluded because the hearing aids for the consumer decides group were preprogrammed to match the NAL-NL2 targets in a 2-cc coupler). An additional 269 articles were identified by reference and citation checking. The titles and abstracts of these articles were screened against the inclusion and exclusion criteria, and the full texts of two non-English language studies (Persian and Korean) were retrieved. These two studies were translated and included in this review. Therefore, six studies were included in the review for data extraction. The details of the search resources and the number of the identified studies are reported in Supplementary Material 3.

Flow Diagram of the Selection Process Based on Preferred Reporting Items for Systematic Reviews and Meta-Analyses (PRISMA).
Study Characteristics
Table 1 summarizes the participant characteristics, study design, and outcomes reported in the six studies. All studies were interventional crossover designs and were published between 2012 and 2019. The timing of outcome data varied from the day of fitting (Chang et al., 2018) to 6 weeks postfitting (e.g., Abrams et al., 2012). Three studies (Denys et al., 2019; Karimi et al., 2016; Valente et al., 2018) were conducted in university clinics, in Belgium, Iran, and the United States, respectively. Of the remaining studies, one was based in a veterans’ clinic in the United States (Abrams et al., 2012), one in audiology clinics in the Netherlands (Boymans & Dreschler, 2012), and one in an audiology clinic at a tertiary hospital in Korea (Chang et al., 2018).
Characteristics of the Studies and the Outcome Measures Used.

Note. N = number of participants; M = male; F = female; SD = standard deviation; 4FA = four frequency average; PTA = pure-tone average; HL = hearing level; SNHL = sensorineural hearing loss; NAL-NL = National Acoustic Laboratories nonlinear; APHAB = abbreviated profile of hearing aid benefit; SSQ = Speech, Spatial and Qualities of Hearing Scale; SSQ12 = a short form of the Speech, Spatial and Qualities of Hearing Scale; REM = real-ear measurement; HINT = hearing in noise test; KHINT = Korean version of the hearing in noise test; HA = hearing aid; NR = not reported.
aThe average deviation from the prescribed target at 0.5, 1, 2, and 4 kHz for an input level of 65 dB SPL.
bThe average deviation from the prescribed target at 0.5, 1, 2, and 4 kHz for three different input levels.
Participant Characteristics
Age
The mean participant age in each of the studies was 50 years or older, with two exceptions: Denys et al. (2019) and Karimi et al. (2016) recruited participants with mean age, 43 and 42 years, respectively.
Sex
The sex distribution was reported in all but one of the studies (Denys et al., 2019). Four studies recruited male and female participants, and the remaining study (Abrams et al., 2012) recruited only male participants. In general, the number of male participants in the studies was twice as high as female participants.
Severity and Types of Hearing Loss
The type of hearing loss was reported in all but one study (Abrams et al., 2012). Of those reporting this, four mainly had participants with sensorineural hearing loss, and one (Boymans & Dreschler, 2012) involved participants with mixed and sensorineural hearing loss.
The degree of hearing loss varied considerably across participants. Generally, the mean hearing thresholds were within the mild and moderate range (i.e., 21–70 dB HL). The SDs and ranges of mean hearing thresholds revealed that some studies included participants with mild to severe hearing loss (i.e., 21–95 dB HL), but none included participants with profound loss (i.e., >95 dB HL).
Hearing Aid Experience
The level of experience with hearing aids was reported in all studies as either a binary variable (experienced vs. first time) or the length of hearing aid experience in months. Four studies mainly involved experienced users (Abrams et al., 2012; Chang et al., 2018; Denys et al., 2019; Karimi et al., 2016), one study used first-time users (Valente et al., 2018), and one involved a mix of experienced and first-time users (Boymans & Dreschler, 2012). Of the studies who used experienced users, two reported the length of participants’ experience in months (Chang et al., 2018; Denys et al., 2019), which ranged from 2 to 222 months.
Prescription Formulae
Four of the studies used the same prescription formula (either NAL-NL1 or 2) for both fitting approaches. The remaining two (Boymans & Dreschler, 2012; Valente et al., 2018) used the hearing aid manufacturer’s prescription formula for the initial fit and a generic prescription formula (NAL-NL1 or 2) for REM. Of the two studies that used the manufacturer’s prescription formula for the initial fit, only one (Boymans & Dreschler, 2012) allowed all participants to adjust the hearing aid gain based on their subjective feedback, which they did using Amplifit II software.
Outcomes
The primary outcome (hearing-specific, health-related quality of life) was not reported in any study. Self-reported listening ability and speech intelligibility in quiet and noise were the only reported secondary outcomes. Two additional outcomes (i.e., preference and sound quality) were reported in some of the studies; hence, these two outcomes were added to this review.
Self-Reported Listening Ability
Self-reported listening ability was reported in four studies but using different outcome instruments. The APHAB (Cox & Alexander, 1995) was used in two studies (Abrams et al., 2012; Valente et al., 2018). Valente et al. (2018) and Boymans and Dreschler (2012) both used the full Speech, Spatial and Qualities (SSQ) Hearing Scale (Gatehouse & Noble, 2004), and Denys et al. (2019) used an abbreviated version of the SSQ Hearing Scale (SSQ12; Noble et al., 2013). Boymans and Dreschler (2012) also used the Amsterdam Questionnaires for Unilateral or Bilateral Hearing Aid Fittings; however, this instrument was not included here because its psychometric properties have not been validated.
Figure 2 shows the forest plot for self-reported listening ability. Two studies used the same prescription formula in the two conditions, and the improvement was statistically significant in favor of REM fitting (SMD = 0.22, 95% CI [0.05, 0.39]; Abrams et al., 2012; Denys et al., 2019). Two studies used different prescription formulae, and, again, the improvement was statistically significant in favor of the REM fitting (SMD = 0.22, 95% CI [0.04, 0.40]; Boymans & Dreschler 2012; Valente et al., 2018). Collectively, the four studies (129 participants) show a statistically significant difference in favor of the REM fitting (SMD = 0.22, p = .0005, 95% CI [0.10, 0.34]; I2 = 0%, p = .86; Figure 2). The results were analyzed using the fixed-effect model because the observed heterogeneity was very low. A subgroup analysis (same prescription formula with mainly experienced hearing aid users vs. different prescriptions with mainly first-time users) showed no statistically significant subgroup effect (p = .98).

Forest Plot Comparing Self-Reported Listening Ability With REM Fitting Versus Initial Fit Using Fixed-Effects Meta-Analysis. The size of the square denotes the weight of each study, and the whiskers represent the 95% confidence interval around the effect size. Diamonds represent the pooled effect size and its 95% confidence interval.
Speech Intelligibility in Quiet
The studies were considerably varied in terms of the stimulus used (i.e., words or sentences), the presentation level of the stimulus (i.e., at threshold or suprathreshold levels), the assessment methods (i.e., single or multiple loudspeakers), and the scoring procedure (i.e., phoneme, keywords, or sentences). The parameters used for speech intelligibility testing are reported in Supplementary Material 4.
Figure 3 shows the forest plot for speech intelligibility in quiet settings. Two studies used the same prescription formula in the two conditions, and the improvement with REM fitting was not statistically significant (SMD = 0.47, 95% CI [1.18, –0.23]; Chang et al., 2018; Denys et al., 2019). Two studies used different prescription formulae, and the improvement was statistically significant in favor of the REM fitting (SMD = 0.72, 95% CI [1.20, 0.23]; Boymans & Dreschler 2012; Valente et al., 2018). Collectively, the four studies (118 participants) show a statistically significant difference in favor of the REM fitting (SMD = 0.59, p = .0004, 95% CI [0.92, 0.26]; I2 = 81%, p = .001; Figure 3). The results were synthesized using random-effect meta-analysis because the observed heterogeneity was high. A subgroup analysis of studies using the same or different prescription formulae in the intervention and control conditions showed no statistically significant subgroup effect (p = .58).

Forest Plot Comparing Speech Intelligibility in Quiet Settings With REM Fitting Versus Initial Fit Using Random-Effects Meta-Analysis. The size of the square denotes the weight of each study, and the whiskers represent the 95% confidence interval around the effect size. Diamonds represent the pooled effect size and its 95% confidence interval.
Speech Intelligibility in Noise
Figure 4 shows the forest plot for speech intelligibility in noise. Two studies used the same prescription formula in the two conditions, and the improvement with REM fitting was not statistically significant (SMD = 0.14, 95% CI [0.30, –0.02]; Chang et al., 2018; Denys et al., 2019). A quite similar pattern was found in the other two studies, which used different prescription formulae for both conditions (SMD = 0.16, 95% CI [0.33, 0.00]; Boymans & Dreschler 2012; Valente et al., 2018). Collectively, the four studies (122 participants) show a statistically significant difference in favor of the REM fitting (SMD = 0.15, p = .01, 95% CI [0.27, 0.04]; I2 = 0%, p = .83; Figure 4). The results were synthesized using fixed-effect meta-analysis because the observed heterogeneity was low. A subgroup analysis of studies using the same or different prescription formulae in the intervention and control conditions showed no statistically significant subgroup effect (p = .84).
Forest Plot Comparing Speech Intelligibility in noise With REM Fitting Versus Initial Fit Using Fixed-Effects Meta-Analysis. The size of the square denotes the weight of each study, and the whiskers represent the 95% confidence interval around the effect size. Diamonds represent the pooled effect size and its 95% confidence interval.
Sound Quality
Figure 5 shows the forest plot for sound quality. One study used the same prescription formula for both conditions, and the improvement was statistically significant in favor of REM fitting (SMD = 0.88, 95% CI [0.43, 1.33]; Chang et al., 2018). A quite similar pattern was found for the other study that used different prescription formulae for both conditions (SMD = 0.21, 95% CI [0.03, 0.39]; Boymans & Dreschler, 2012). Despite the mean differences for each study being significantly different from zero, the pooled effect size was not significantly different from zero (SMD = 0.51, p = .12, 95% CI [–0.14, 1.16]; I2 = 86%, p = .007; Figure 5). This is due to the large difference in effect size between the two studies. The results were synthesized using random-effect meta-analysis because the observed heterogeneity was high. A subgroup analysis of studies using the same or different prescription formulae in the intervention and control conditions showed a statistically significant subgroup effect (p = .007).

Forest Plot Comparing Sound Quality With REM Fitting Versus Initial Fit Using Random-Effects Meta-Analysis. The size of the square denotes the weight of each study, and the whiskers represent the 95% confidence interval around the effect size. Diamonds represent the pooled effect size and its 95% confidence interval.
Preference
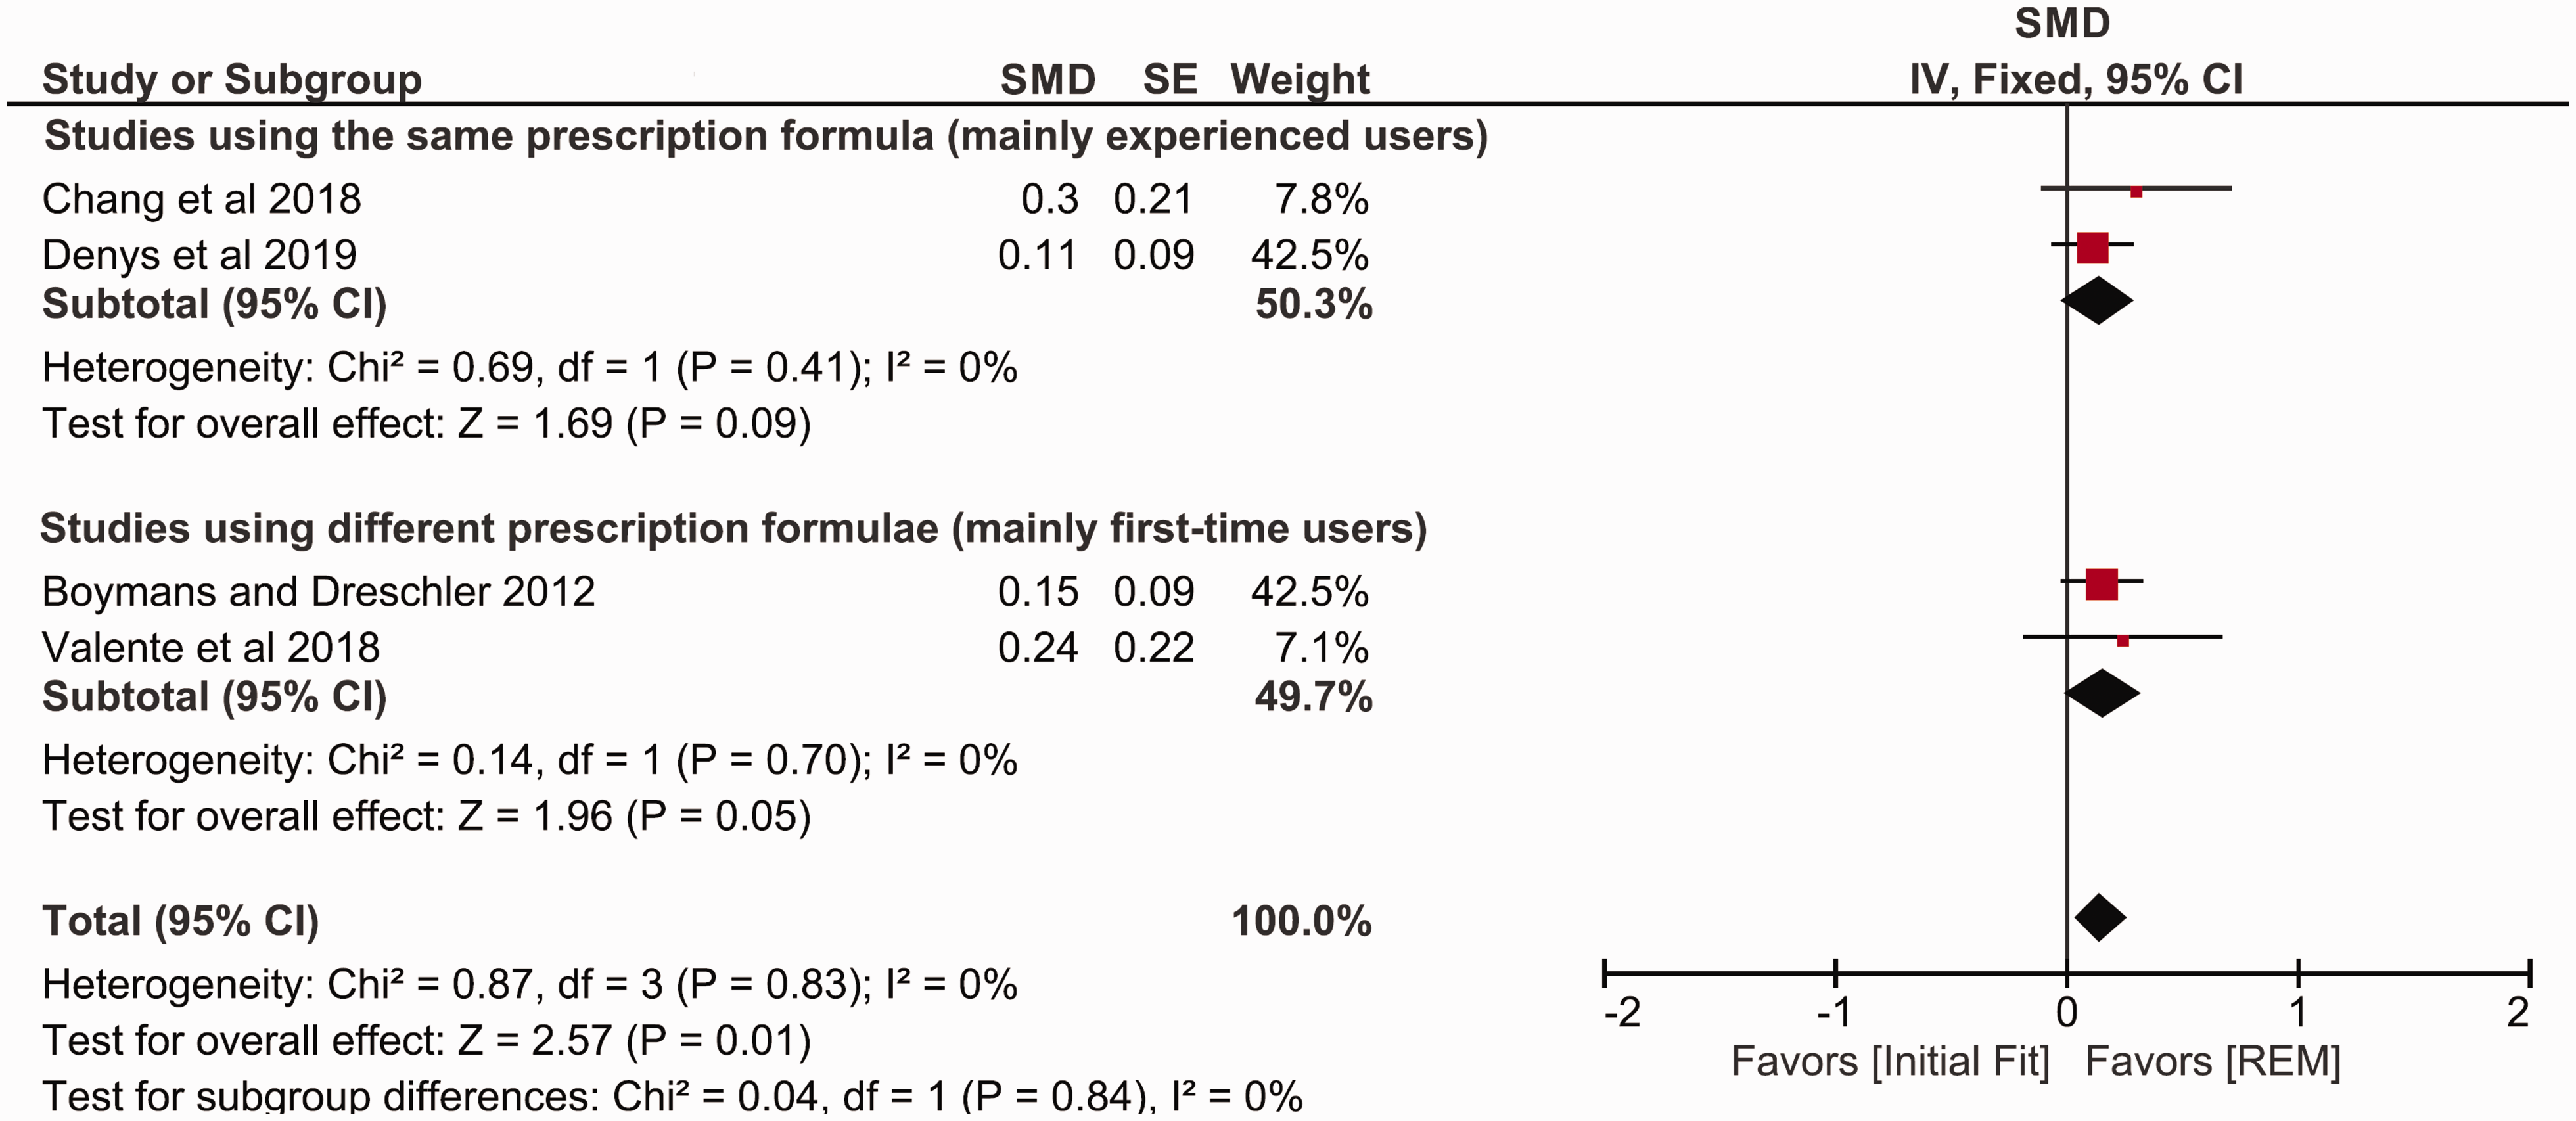
Figure 6 shows the forest plot for users’ final preferences. One study used the same prescription formula for both conditions, and the proportion of those who preferred REM fitting was not significantly higher than those who preferred initial fit (proportion difference = 36%, 95% CI [–2.6%, 75%]; Abrams et al., 2012). The effect for the two studies that used different prescription formulae was statistically significant (proportion difference = 54%, 95% CI [38%, 71%]; Boymans & Dreschler, 2012; Valente et al., 2018). Collectively, the three studies (119 participants) show that the proportion of those who preferred REM fitting was significantly higher than those who preferred initial fit (proportion difference = 52.2%, p <.00001, 95% CI [37%, 67%]; I2 = 0%, p = .41; Figure 6). The results were synthesized using fixed-effect meta-analysis because the observed heterogeneity was low. A subgroup analysis of studies using the same or different prescription formulae in the intervention and control conditions showed no statistically significant subgroup effect (p = .39). The robustness of the pooled preference estimates was cross-checked using arcsine-transformed scores, resulting in essentially the same outcome.

Forest Plot of Comparison: Users’ Final Preference for REM Fitting or Initial Fit Using Fixed-Effects Meta-Analysis. The size of the square denotes the weight of each study, and the whiskers represent the 95% confidence interval around the effect size. Diamonds represent the pooled effect size and its 95% confidence interval.
Quality of Evidence
Table 2 shows the scores on the Downs and Black checklist for each study. The maximum possible quality score was 28. The scores range from 16 (Karimi et al., 2016) to 23 (Abrams et al., 2012), indicating that the quality of the studies is within the range of fair to good. In general, studies had high scores for quality of reporting and internal validity. The high internal validity scores can be partially attributed to the fact that all of the studies used a within-subject crossover design. Furthermore, four studies (Abrams et al., 2012; Boymans & Dreschler, 2012; Denys et al., 2019; Valente et al., 2018) blinded participants to the intervention they received, and, with the exception of Karimi et al. (2016), the order in which the two conditions were trialed was counterbalanced across participants. However, only one study (Valente et al., 2018) attempted to blind the assessors, and none reported the prior amplification characteristics used by the experienced users. External validity was relatively low due to uncertainty of whether the participants were representative of the target population; for example, the participants of Abrams et al. (2012) were limited to male veterans. Similarly, the majority of studies exhibited a low score in the power domain, because only two (Abrams et al., 2012; Valente et al., 2018) used power calculation to determine the sample size.
Methodological Quality of Individual Studies Assessed According to the Checklist of Downs and Black (1998).

The GRADE tool was independently used by each member of the review team to assess the quality of each individual outcome. The quality of evidence for each outcome is shown in Table 3. No rating was possible for the primary outcome of hearing-specific, health-related quality of life, as none of the studies reported outcomes in this category.
Summary of Findings and Overall Quality Ratings.
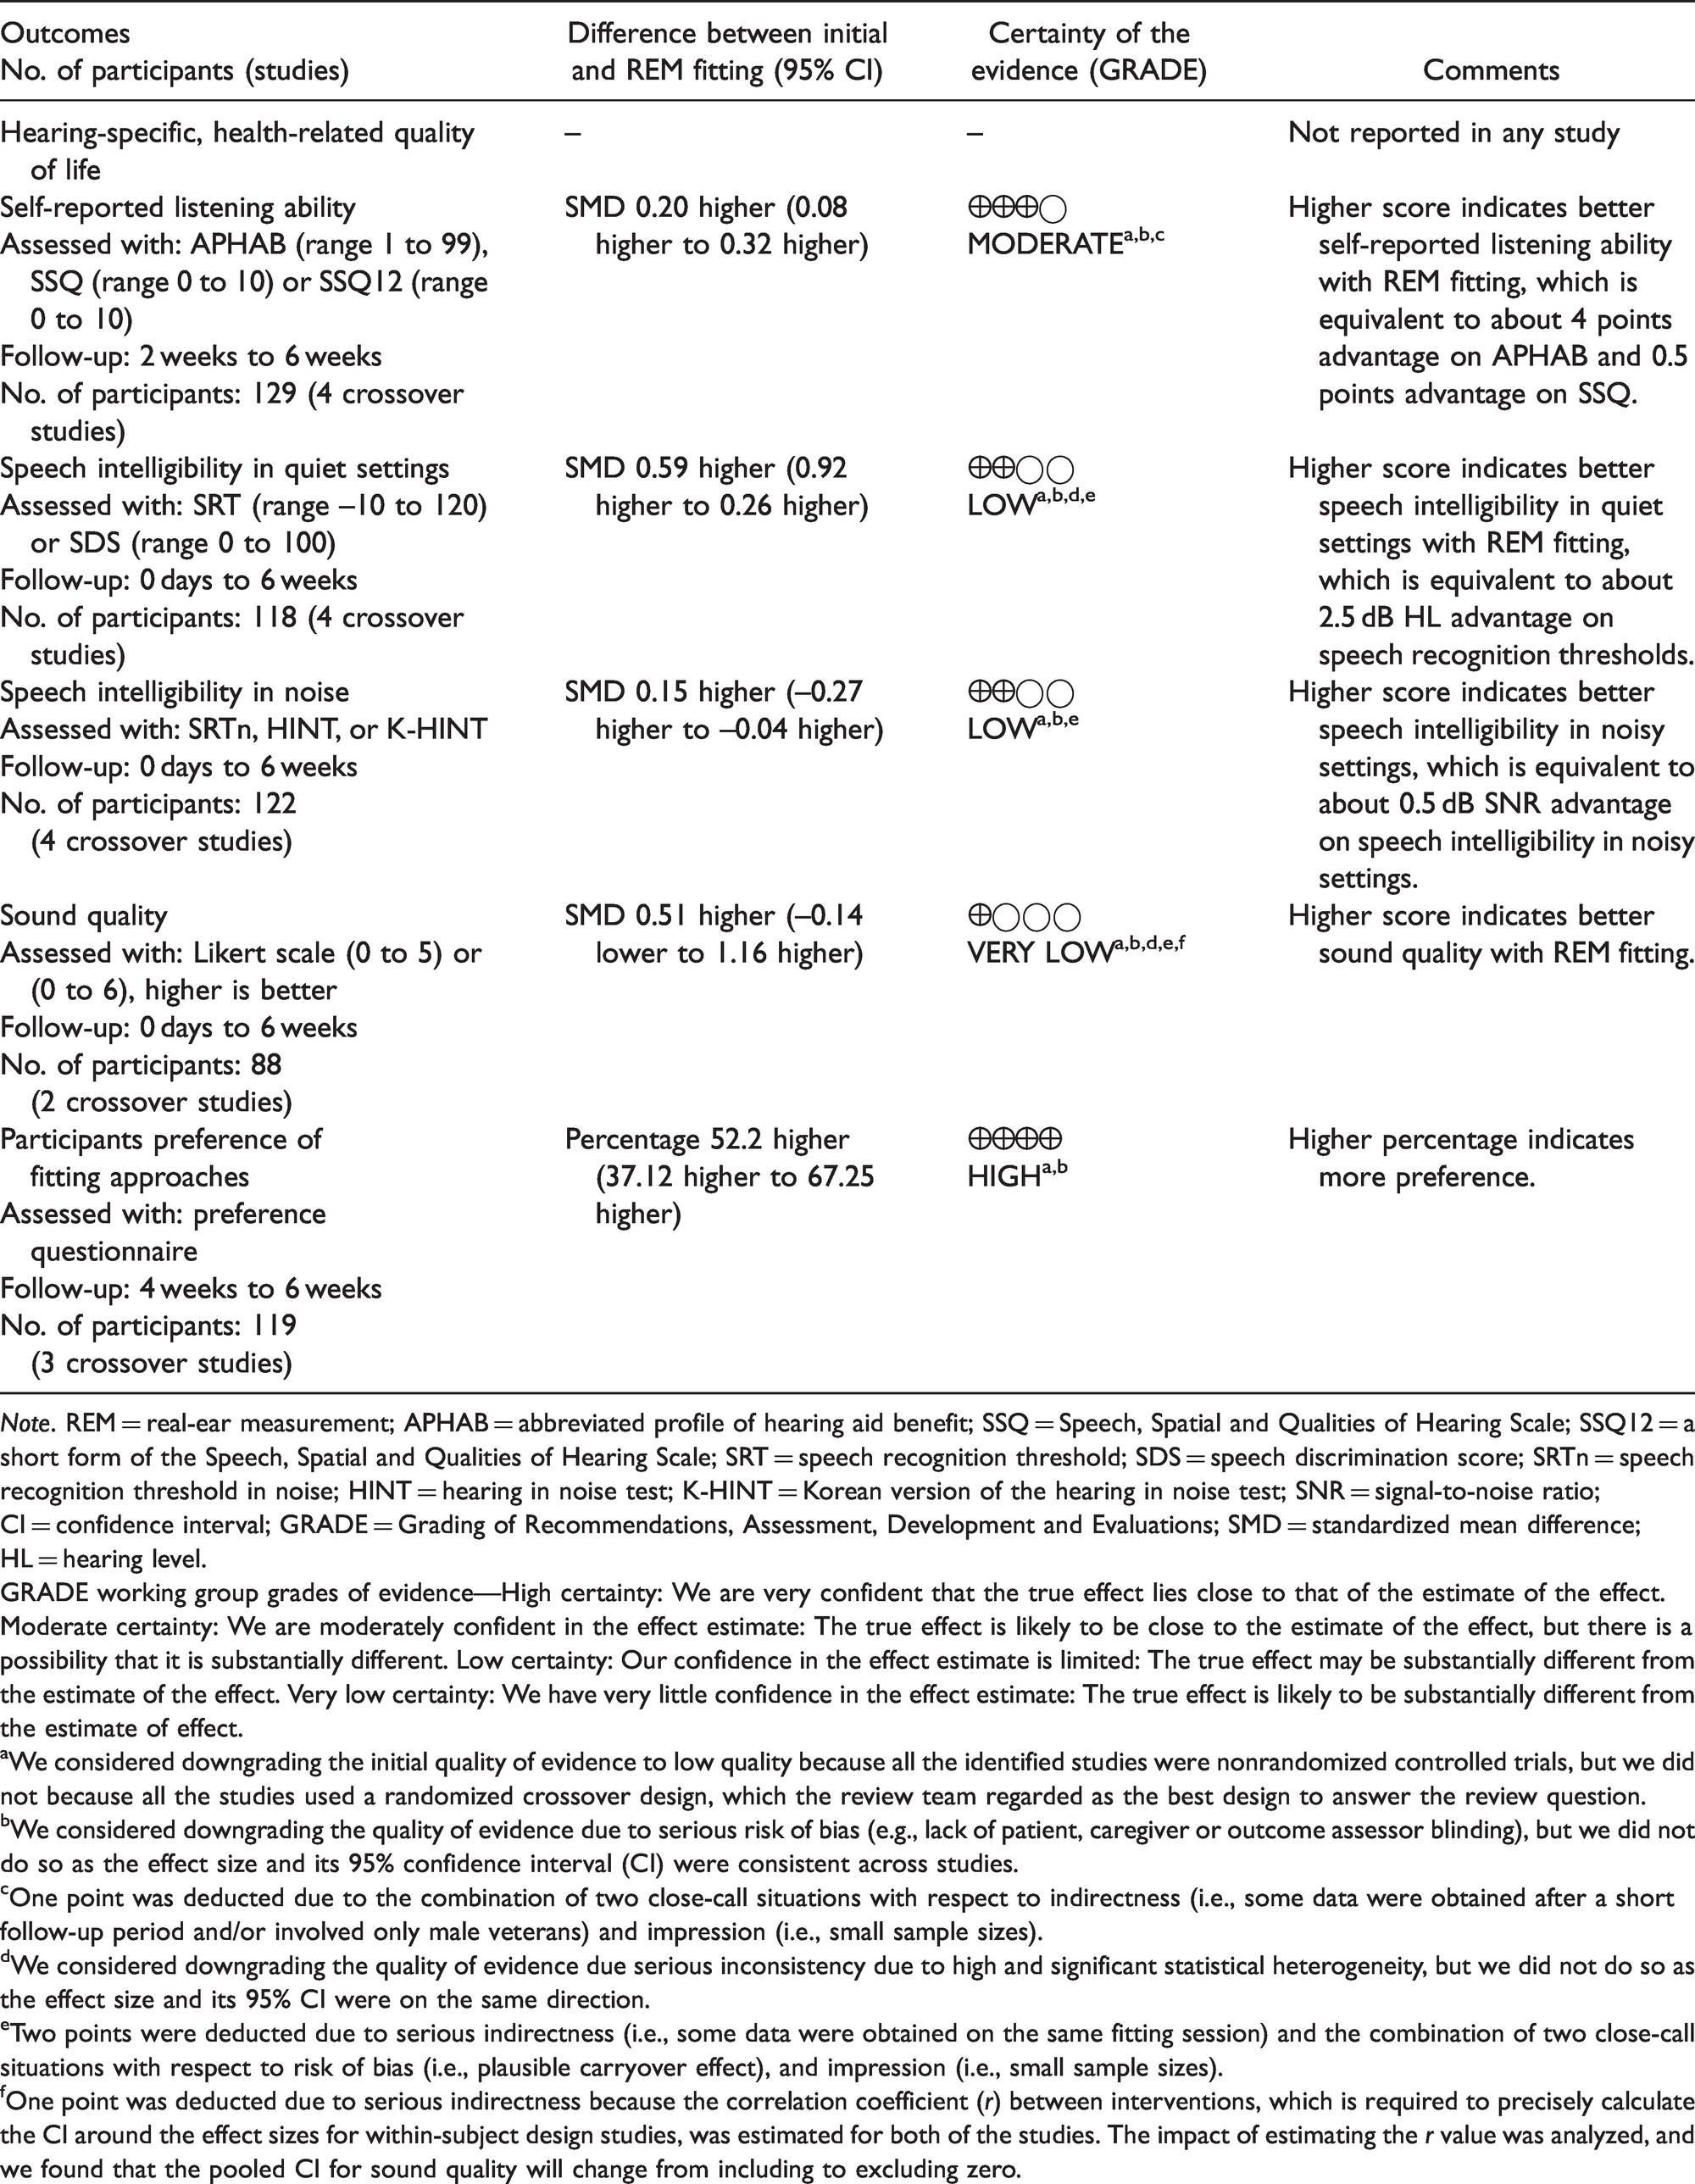
Note. REM = real-ear measurement; APHAB = abbreviated profile of hearing aid benefit; SSQ = Speech, Spatial and Qualities of Hearing Scale; SSQ12 = a short form of the Speech, Spatial and Qualities of Hearing Scale; SRT = speech recognition threshold; SDS = speech discrimination score; SRTn = speech recognition threshold in noise; HINT = hearing in noise test; K-HINT = Korean version of the hearing in noise test; SNR = signal-to-noise ratio; CI = confidence interval; GRADE = Grading of Recommendations, Assessment, Development and Evaluations; SMD = standardized mean difference; HL = hearing level.
GRADE working group grades of evidence—High certainty: We are very confident that the true effect lies close to that of the estimate of the effect. Moderate certainty: We are moderately confident in the effect estimate: The true effect is likely to be close to the estimate of the effect, but there is a possibility that it is substantially different. Low certainty: Our confidence in the effect estimate is limited: The true effect may be substantially different from the estimate of the effect. Very low certainty: We have very little confidence in the effect estimate: The true effect is likely to be substantially different from the estimate of effect.
aWe considered downgrading the initial quality of evidence to low quality because all the identified studies were nonrandomized controlled trials, but we did not because all the studies used a randomized crossover design, which the review team regarded as the best design to answer the review question.
bWe considered downgrading the quality of evidence due to serious risk of bias (e.g., lack of patient, caregiver or outcome assessor blinding), but we did not do so as the effect size and its 95% confidence interval (CI) were consistent across studies.
cOne point was deducted due to the combination of two close-call situations with respect to indirectness (i.e., some data were obtained after a short follow-up period and/or involved only male veterans) and impression (i.e., small sample sizes).
dWe considered downgrading the quality of evidence due serious inconsistency due to high and significant statistical heterogeneity, but we did not do so as the effect size and its 95% CI were on the same direction.
eTwo points were deducted due to serious indirectness (i.e., some data were obtained on the same fitting session) and the combination of two close-call situations with respect to risk of bias (i.e., plausible carryover effect), and impression (i.e., small sample sizes).
fOne point was deducted due to serious indirectness because the correlation coefficient (r) between interventions, which is required to precisely calculate the CI around the effect sizes for within-subject design studies, was estimated for both of the studies. The impact of estimating the r value was analyzed, and we found that the pooled CI for sound quality will change from including to excluding zero.
The GRADE working group recommended that the review authors should downgrade the quality of evidence for all non-randomized controlled trials by two points (i.e., from high to low quality). However, this rule was not applied because all the studies used a crossover design, which the review team regarded as the best design to answer the review question. However, we did downgrade the quality of evidence in some other cases. For example, the GRADE score for self-reported listening ability was downgraded by one point, to moderate quality evidence, due to the combination of two close-call situations with respect to indirectness (i.e., some data were obtained after a short follow-up period and involved only male veterans) and imprecision (i.e., small sample sizes).
Discussion
This systematic review aimed to identify and assess the current evidence on whether or not the use of REM fitting improves the outcomes for adults. Six studies met the eligibility criteria and compared REM fitting with the initial fit. None of the studies reported hearing-specific health-related quality of life, which the review team regarded as the primary outcome. Most of the studies examined self-reported listening ability, speech intelligibility in quiet and noise, and preference. Other outcomes of interest (i.e., adverse events and generic quality of life) were not assessed in any of the studies. In two studies, outcomes were measured at the fitting session, indicating that the researchers did not allow participants to acclimatize to the hearing aid settings. The maximum follow-up duration was 6 weeks (e.g., Abrams et al., 2012), and there were no long-term outcomes. Most of the studies assessed the outcomes with experienced hearing aid users, and none of them detailed the amplification characteristics with which the participant was already familiar. Changing the amplification characteristics from what was familiar could impact short-term outcomes (Scollie et al., 2010; Walravens et al., 2020).
Self-Reported Listening Ability
Four studies included self-reported listening ability, and all showed an advantage for REM fitting, but this was not always statistically significant. The results of the meta-analysis revealed that the overall effect of REM fitting on self-reported listening ability was small (circa 4% benefit on APHAB) but statistically significant compared with the initial fit. Changing the model of the meta-analysis from fixed- to random-effect would not alter the pooled effect size or the 95% CI for this outcome and the subsequent outcomes because I2 was either zero or negative (truncated to 0) in all of these outcomes.
The reported advantage of REM fitting in studies that used different prescription formulae for the intervention and control conditions may not be solely attributed to the approach itself because of the difference in the prescription used for the two conditions. However, the pooled effect size for the two studies that kept the prescription constant was the same as that for the two studies that used different prescriptions for the two conditions. The lack of difference alternatively could be attributed to a combination of two factors: one that could increase the effect size (e.g., two different prescriptions instead of one) and one that could decrease it (e.g. first-time instead of experienced hearing aid users). The quality of evidence, as measured with GRADE, was moderate due to the combination of two close-call situations with respect to indirectness and imprecision.
Speech Intelligibility in Quiet
Speech intelligibility in quiet settings was assessed in four studies. All but one of the studies found a statistically significant advantage of REM fitting over initial fit. The only exception was Denys et al. (2019), who found a non-significant advantage. The results of the meta-analysis showed that REM fitting significantly improve speech intelligibility in quiet settings (with moderate effect size), at least for a presentation level close to the users’ hearing threshold levels (the level used in the majority of the included studies). These findings are somewhat expected, given that the initial fit approach typically underestimates the prescription target for soft and conversational level speech (Munro et al., 2016). The absolute benefit was about 2.5 dB HL advantage on speech recognition thresholds, which may just be noticeable to patients (Caswell-Midwinter & Whitmer, 2019a). The quality of evidence was low due to serious indirectness and the combination of two close-call situations with respect to risk of bias and imprecision.
Speech Intelligibility in Noise
Four studies measured speech intelligibility in noise, and all showed a trend of a better outcome with REM fitting. Although none of the studies individually showed an effect size significantly different from zero, the pooled effect indicated that listening in noise was significantly better with the REM fit than with the first fit. This occurred because of the consistency of the direction and magnitude of the effect size across all four studies. The absolute benefit was typically about 0.5 dB change in signal-to-noise ratio (SNR), which may not be a noticeable nor meaningful advantage to patients (Caswell-Midwinter & Whitmer, 2019b; McShefferty et al., 2015, 2016). The evidence was judged to be of low quality due to serious indirectness and the combination of two close-call situations with respect to risks of bias and imprecision.
Sound Quality
Two studies compared the sound quality between the two fitting approaches. In both studies, there was a significant advantage for REM fitting over initial fit (circa 0.17 points on a 5-point Likert scale). However, the overall effect was not significant due to the considerable statistical heterogeneity between the two effect sizes. The overall quality of evidence was downgraded by three points to very low due to very serious indirectness and the combination of two close-call situations with respect to risk of bias and imprecision.
Preference
Three studies collected the participant’s preference at the end of their experiments. The REM fitting to initial fit preference ratios indicates that at least twice as many hearing aid users prefer their hearing aids to be fitted using REM fitting compared with the initial fit. Although participants in these studies were asked which response they preferred, none were asked why they had this preference. The evidence was judged to be of high quality due to the lack of serious limitations.
Sensitivity Analysis
Although the formula used to calculate the SDMs is considered to be the most appropriate for crossover design studies (J. P. Higgins et al., 2019), Hedge’s g correction may provide better estimates (Lakens, 2013). The extent to which this correction would affect the pooled effect sizes was examined using unplanned sensitivity analyses. That is, the effect size for all outcomes was calculated with and without Hedge’s correction. Both methods produced similar results; therefore, we reported only the uncorrected values.
Quality of Evidence
The rating assigned to each outcome was based on the answer to an important practical questions confronting clinicians: “does the use of REM to match the hearing aid’s amplification characteristic to a validated prescription target improve outcomes in adult hearing aid users relative to initial fit (irrespective of the prescription used for initial fit)?” For this question, the quality of evidence ranged from high to low quality.
However, if the question had been “does the use of REM to match the hearing aid’s amplification characteristic to a validated prescription target improve outcomes in adult hearing aid users relative to initial fit (using the same prescription method for both conditions)?” the quality would have been lower (from moderate to very low quality), as many of the studies did not use the same prescription for the initial fit and REM conditions. The review team considered the former question to be more relevant because in practice, a variety of prescriptions are used for the initial fit condition, which was reflected in the studies.
Future studies should aim to (a) improve the overall quality of the studies, (b) analyze first-time users separately from experienced users so that, if needed, a separate conclusion can be obtained for each subgroup, (c) allow for further adjustment to the amplification characteristics, (d) estimate the importance to participants of any benefit found, and (e) determine the reasons that participants report for any benefit they experience.
Clinical Implication
Although the assessment of quality of the evidence varied across outcomes, the direction of benefit consistently favored REMs. A moderate statistically significant effect was found for speech intelligibility in quiet settings and user’s final preference. A small but statistically significant positive effect was reported for self-reported listening ability and speech perception in noise. These findings support many hearing professional guidelines, which recommend the routine use of REMs to match the hearing aid’s amplification characteristics to a validated prescription target.
However, though a statistically significant difference indicates that the null hypothesis is very unlikely, it does not speak to the value of the benefit, relative to the cost of providing it, or to the clinical significance of the findings. The minimum clinically important difference has not been established for most of the outcomes reported in these studies (Barker et al., 2016). Therefore, not only should we be cautious in terms of the estimated effect sizes, which are generally small (e.g., 0.5 dB SNR), the magnitude of meaningful benefit of using REMs, as perceived by hearing aid wearers, has yet to be determined.
In addition, publication bias may exist because, in general, studies showing small, or null, effects are less likely to be submitted (or accepted) for publication (Kyzas et al., 2007; Turner et al., 2008; Tzoulaki et al., 2013). As a result, relying on published studies may result in an overestimate of the true effect size. We do not know if this is the case for REM studies, but caution is advised in case the importance of REM has been inflated.
Limitations of the Systematic Review
A potential limitation of this review is that it was restricted to studies that compared the fitting approaches using conventional hearing aids. This restriction eliminates all studies that used other types of amplification products (e.g., direct-to-consumer hearing devices). However, the majority of these devices are incapable of matching the generic prescription targets even after the use of REMs (Almufarrij et al., 2019; Chan & McPherson, 2015).
Another potential limitation is that gray literature studies were not included in this review because there is no agreed method to systematically identify such studies. Including these studies might reduce the effect of publication bias because null findings are less likely to be published in peer-reviewed journals. At the time of publication, the review team were aware of two studies (published in a trade magazine) that measured the speech intelligibility in noisy settings for the two fitting approaches (Amlani et al., 2017; Leavitt & Flexer, 2012). The characteristics, main findings, and quality appraisals are reported in Supplementary Material 5. In both of these studies, there was a statistically significant advantage for REM fitting over initial fit, which is consistent with the findings of this review.
The review findings may be limited to adults with mild to severe hearing loss, as none of the review studies included children or adults with profound hearing loss.
Deviation From the Published Protocol
Relevant outcome measures (i.e., sound quality and preference) that were not listed in our protocol were reported in some studies; therefore, they were included as additional secondary outcomes to this review. All prespecified subgroup, publication bias, and sensitivity analyses were not performed due to missing and/or limited data. Unplanned subgroup analyses were performed for all outcomes mainly due to differences in methods (i.e., either using the same or different prescription formulae for the intervention and control conditions) and population (i.e., first-time and experienced hearing aid users) across studies. Unplanned sensitivity analyses (with and without Hedge’s g correction) were also performed for all outcomes due to the small sample sizes.
Conclusions
The review, the first on this topic, identified a small number of studies with limited numbers of participants. The quality of evidence for the different outcomes range from high to very low but favored REM fittings for all outcomes. The findings are consistent with recommendations in hearing professional guidelines that REMs should be used to match the hearing aid’s amplification characteristics to a validated prescription target. However, further studies are needed to investigate if the benefits of REMs are clinically relevant, because minimum clinically important differences have yet to be established for most outcome measures. Ultimately, there needs to be a cost-effectiveness analysis to show that statistically significant benefits, which exceed the minimum clinically important difference, are worth the cost involved.
Supplemental Material
sj-pdf-1-tia-10.1177_2331216521999563 - Supplemental material for Does Probe-Tube Verification of Real-Ear Hearing Aid Amplification Characteristics Improve Outcomes in Adults? A Systematic Review and Meta-Analysis
Supplemental material, sj-pdf-1-tia-10.1177_2331216521999563 for Does Probe-Tube Verification of Real-Ear Hearing Aid Amplification Characteristics Improve Outcomes in Adults? A Systematic Review and Meta-Analysis by Ibrahim Almufarrij, Harvey Dillon and Kevin J. Munro in Trends in Hearing
Supplemental Material
sj-pdf-2-tia-10.1177_2331216521999563 - Supplemental material for Does Probe-Tube Verification of Real-Ear Hearing Aid Amplification Characteristics Improve Outcomes in Adults? A Systematic Review and Meta-Analysis
Supplemental material, sj-pdf-2-tia-10.1177_2331216521999563 for Does Probe-Tube Verification of Real-Ear Hearing Aid Amplification Characteristics Improve Outcomes in Adults? A Systematic Review and Meta-Analysis by Ibrahim Almufarrij, Harvey Dillon and Kevin J. Munro in Trends in Hearing
Supplemental Material
sj-pdf-3-tia-10.1177_2331216521999563 - Supplemental material for Does Probe-Tube Verification of Real-Ear Hearing Aid Amplification Characteristics Improve Outcomes in Adults? A Systematic Review and Meta-Analysis
Supplemental material, sj-pdf-3-tia-10.1177_2331216521999563 for Does Probe-Tube Verification of Real-Ear Hearing Aid Amplification Characteristics Improve Outcomes in Adults? A Systematic Review and Meta-Analysis by Ibrahim Almufarrij, Harvey Dillon and Kevin J. Munro in Trends in Hearing
Supplemental Material
sj-pdf-4-tia-10.1177_2331216521999563 - Supplemental material for Does Probe-Tube Verification of Real-Ear Hearing Aid Amplification Characteristics Improve Outcomes in Adults? A Systematic Review and Meta-Analysis
Supplemental material, sj-pdf-4-tia-10.1177_2331216521999563 for Does Probe-Tube Verification of Real-Ear Hearing Aid Amplification Characteristics Improve Outcomes in Adults? A Systematic Review and Meta-Analysis by Ibrahim Almufarrij, Harvey Dillon and Kevin J. Munro in Trends in Hearing
Supplemental Material
sj-pdf-5-tia-10.1177_2331216521999563 - Supplemental material for Does Probe-Tube Verification of Real-Ear Hearing Aid Amplification Characteristics Improve Outcomes in Adults? A Systematic Review and Meta-Analysis
Supplemental material, sj-pdf-5-tia-10.1177_2331216521999563 for Does Probe-Tube Verification of Real-Ear Hearing Aid Amplification Characteristics Improve Outcomes in Adults? A Systematic Review and Meta-Analysis by Ibrahim Almufarrij, Harvey Dillon and Kevin J. Munro in Trends in Hearing
Footnotes
Acknowledgments
The authors thank the corresponding authors of the studies for sharing data not reported in the publications and for responding to our queries. The authors also thank Systematic Review Solutions Ltd for their support on developing the search strategies.
Declaration of Conflicting Interests
The authors declared no potential conflicts of interest with respect to the research, authorship, and/or publication of this article.
Funding
The authors disclosed receipt of the following financial support for the research, authorship, and/or publication of this article: I. A. is partially funded, and K. J. M. and H. D. are supported, by the NIHR Manchester Biomedical Research Centre (under grant number IS-BRC-1215-20007). I. A. is also supported by the Deanship of Scientific Research at the College of Applied Medical Sciences Research Center at King Saud University.
Supplementary material
Supplemental material for this article is available online.
References
Supplementary Material
Please find the following supplemental material available below.
For Open Access articles published under a Creative Commons License, all supplemental material carries the same license as the article it is associated with.
For non-Open Access articles published, all supplemental material carries a non-exclusive license, and permission requests for re-use of supplemental material or any part of supplemental material shall be sent directly to the copyright owner as specified in the copyright notice associated with the article.