
Abstract
Hearing aid verification with real-ear measurement (REM) is recommended in clinical practice. Improvements, over time, in accuracy of manufacturers’ initial fit mean the benefit of routine REM for new adult users is unclear. This registered, double-blinded, randomized, mixed-methods clinical trial aimed to (i) determine whether new adult hearing aid users prefer initial or real-ear fit and (ii) investigate the reasons for preferences. New adult hearing aid users (n = 45) were each fitted with two programs: the initial fit and real-ear fit, both with adjustments based on immediate feedback from the patient. Participants were asked to complete daily paired-comparisons of the two programs with a magnitude estimation of the preference, one for each of clarity/comfort in quiet/noise as well as overall preference. The results revealed gain adjustment requests were low in number and small in magnitude. Deviation from NAL-NL2 targets (after adjustment for a 65 dB SPL input) was close to zero, except at high frequencies where real-ear fits were around 3 dB closer to target. There was no difference in clarity ratings between programs, but comfort ratings favored initial fit. Overall, 10 participants (22%) expressed a preference for real-ear fit. Reasons for preference were primarily based on comfort with the initial fit and clarity with real-ear fit. It may be acceptable to fit new adult users with mild-to-moderate hearing loss without the need for REMs, if the primary outcome of interest is user preference. It remains to be seen if the findings generalize to other fitting software, other outcome measures and more severe hearing loss.
Keywords
Introduction
Hearing aids are prescribed using validated prescription methods (e.g., National Acoustic Laboratories Non-Linear 2 [NAL-NL2]; Keidser et al., 2012). Modern standalone hearing aid software can approximate the prescribed gain (called the initial fit) based on the user's hearing thresholds and other variables, including earmold characteristics.
In earlier reports, manufacturer's initial fit was found to provide inadequate amplification compared to Real Ear Measurement (REM) fitting, with deviations between the two approaches most prominent at high frequencies and low input levels (Aazh & Moore, 2007; Aazh et al., 2012; Munro et al., 2016; Sanders et al., 2015; Valente et al., 2018). However, accuracy of the manufacturer's initial fits has improved over time (Folkeard et al., 2019; Narayanan et al., 2022), presumably because (a) hearing aids have become more adjustable and (b) manufacturers have more information about how to allow for low-frequency venting and high-frequency tubing effects (Dillon, 2012). For example, Aazh and Moore (2007) found that only 36% of initial fittings were within 10 dB tolerance of NAL-NL1 target from 0.5 to 4 kHz. A decade later, the proportion had increased to 63% (Munro et al., 2016). More recent studies have reported further improvement in the manufacturer's initial fits. For example, Narayanan et al. (2022) reported data from 1251 participants fitted with seven different hearing aid brands. They found that the median initial fit deviation from the NAL-NL2 targets was around zero at all frequencies except 4 kHz.
The use of REM is considered best practice and recommended in clinical guidelines including the British Society of Audiology (BSA, 2018a), the American Academy of Audiology (2006), and the national protocol for pediatric amplification in Australia (King, 2010). For example, the BSA guidelines (2018a) recommend using REM to match the hearing aid's gain and slope to the targets as closely as possible, with discrepancies not exceeding 5 dB at frequencies between 0.25 and 6 kHz. Hearing aid verification is not only recommended in the UK but also stipulated by the National Health Service (NHS): audiologists must use an objective verification method (i.e., REM) for at least 95% of their cases (NHS England, 2016).
Although REMs have been shown to improve the match to prescription target, few studies have investigated patient outcomes (Abrams et al., 2012; Boymans & Dreschler, 2012; Chang et al., 2018; Denys et al., 2019; Valente et al., 2018). Our recent systematic review and meta-analysis of the effectiveness of REMs (Almufarrij et al., 2021) revealed limited high-quality studies on this topic. Six experimental peer-reviewed studies compared REM with initial fittings for five outcomes: listening preference, sound quality, self-reported listening ability, and speech intelligibility in quiet and noisy backgrounds. All outcomes except sound quality were significantly better with REM fitting, with small to medium effect sizes. However, the quality of evidence was mostly low due to, in different studies, lack of blinding, short follow-up period, recruitment of experienced users who were familiar with one fitting approach, and different prescriptions for the intervention and comparator (manufacturer proprietary vs. NAL-NL1 or 2). In addition, only a few studies allowed for further fine-tuning based on user feedback and preference, despite this being usual clinical practice and recommended by professional organizations (BSA, 2018a; Kollmeier & Kiessling, 2018; Kuk, 1998; Schweitzer et al., 1999).
Based on the findings of our review, it is evident that there is a need for high-quality evidence on clinical and cost-effectiveness of REM, given that it requires resources and time (perhaps up to ten minutes of a typical NHS fitting appointment), which could be otherwise directed to non-technical procedures such as addressing the specific listening needs of the patient. In addition, the accuracy of the manufacturers’ initial fit, as mentioned above, has improved over time (Folkeard et al., 2019; Narayanan et al., 2022). However, a lack of statistically significant gain difference between the REM and initial fittings would not mean patients will not have a preference for either of the fitting approaches. Hearing aid users are best equipped to determine the clarity and comfort of the sound of REM and initial fittings and weight these qualities of each, optimized by a different fitting method (Keidser et al., 2005). Comparing listening preferences for REM and initial fittings based on listening preferences is in line with patient-centered care, as it ensures that clinical decisions are based on the views and priorities of the user.
Thus, this registered, double-blinded, randomized, mixed-methods clinical trial, aimed to (i) determine, using a daily diary, whether new adult hearing aid users prefer REM or initial fit and (ii) investigate the reasons for their preference.
Methods
Design
This 6-week study used a double-blinded, randomized, mixed-methods design. All participants were fitted with REM and initial fitting approaches with further adjustments based on the user's immediate feedback (obtained through a conversation with the NHS audiologist who explicitly inquired about any desired changes to the sounds, representing common clinical practice). Each fitting approach was saved to a separate hearing aid program. The order of these programs was blinded to both the participant and their NHS audiologist.
The study protocol was registered with the open science framework (OSF; osf.io/d2bjm). No remuneration was provided to study participants. This project was reviewed and approved by the North-West Liverpool Central Research Ethics Committee (Ref: 20/NW/0283). All participants provided written informed consent.
Participants
Adults with sensorineural hearing loss were recruited from Withington Community Hospital, an NHS hospital in Greater Manchester, UK. All hearing assessments, hearing aid fittings and outcome measurements took place at the clinical site. Adults who met the following inclusion criteria were invited to participate in this study: (a) mild-to-moderate (mean pure-tone threshold between 20 and 70 dB HL at 0.25 to 4 kHz) sensorineural hearing loss in at least one ear; (b) no previous experience with hearing aids, or no regular use of hearing aids in the last 12 months; (c) able to complete the outcome measure; (d) eligible for NHS hearing aids. Patients with treatable, fluctuating or rapidly progressing hearing loss and those who were currently taking ototoxic medication, including aminoglycosides, were excluded.
Previous studies suggest around 75% of adults prefer REM over initial fit (Almufarrij et al., 2021). A minimum of 30 participants is required to detect this proportion (80% power, alpha = 0.05). We recruited a sample of 58 to allow for a smaller preference due to: (i) a closer match to target with initial fit than previously reported with more recent versions of fitting software and newer models of hearing aids, and (ii) allowing for adjustments to the frequency response based on participant feedback. Even allowing for 15% attrition, this sample size will detect a 70% preference to either of the programs, relative to a chance preference of 50% (80% power, alpha = 0.05).
All participants received hearing aids fitted using both approaches (initial fit and REM) with the order randomized within the hearing aid programs and counterbalanced across participants. Merged block randomization (van der Pas, 2019) was used as follows: two block random allocation lists were created using an online randomization tool (sealedenvelope.com) with the following parameters: block sizes were 4, 6, and 8; list lengths were 50 and 52; allocations were initial fit-REM and REM-initial fit. The order of fitting programs for each participant was determined by a two-digit (1 and 2) ‘randbetween’ function in Excel; the first unused order from lists 1 or 2 was selected when the results of the Excel ‘randbetween’ function was 1 or 2, respectively. Both the participants and the NHS audiologist were blinded to the program order; that is, the first author retained or swapped order of hearing aid programs at the end of each hearing aid fitting session. Figure 1 shows the modified Consolidated Standards of Reporting Trials CONSORT flow diagram for within-subject trials.

CONSORT flow diagram for study participants.
Hearing Aids and REM Systems
Participants were fitted with one or two standard NHS behind-the-ear hearing aids. These hearing aids were fitted with either earmolds or thin-tube-delivery with open ear domes. Two common NHS hearing aids were used in this clinical trial: Oticon Engage BTE 85 (for mild-to-moderate hearing loss) and 105 (for moderate-to-severe hearing loss [specifically prescribed for those at the higher end of moderate hearing loss ranges]) with 14 channels. Hearing aids’ push buttons were programmed to switch between two different programs.
Clinically calibrated Interacoustic Affinity 2 REM systems were used for all measurements. The system was configured to generate NAL-NL2 targets in accordance with BSA (2018a) guidelines using the following parameters: prescription: NAL-NL2; client type: adult; gender: male or female (individually selected); transducer: headphone; orientation for real-ear unaided response: 0 degree azimuth; hearing instrument style: behind the ear; hearing aid type: nonlinear; number of hearing aids: bilateral or unilateral; hearing aid program type: quiet; vent size: individually selected; limiting: multi-band; compression threshold: 50; compression ratio: fast; language: non-tonal; channels: 14. Usual practice in the UK is to select gain targets for an experienced user, and thus that was what was done here.
The hearing aid software, Oticon Genie 2, was configured to approximate the manufacturer's interpretation of the NAL-NL2 prescription (Oticon, 2017) using the following parameters: audiogram: the participants’ hearing thresholds; demographic information: individually selected; experience level: experienced; vent size, individually selected; and prescription method: NAL-NL2.
Four Paired Comparisons of the Two Programs
Preference dairies were designed for the study. These enabled participants to easily complete a set of preference ratings, on a daily basis, to compare the initial fit and REM programs in terms of (a) clarity of sounds in quiet environments, (b) clarity of sounds in noisy environments, (c) comfort of sounds in quiet environments, (d) comfort of sounds in noisy environments, and (e) overall preference. The clarity and comfort dimensions of sound quality were chosen because these two elements are the factors that most commonly affect patients’ preferences (Keidser et al., 2005). For each listening environment, participants were asked to indicate their preference and its magnitude using a seven-point Likert scale (−3 = program A is much better than program B, −2 = program A is better than program B, −1 = program A is slightly better than program B, 0 = no difference, +1 = program B is slightly better than program A, +2 = program B is better than program A and +3 = program B is much better than program A). For overall preference, participants were instructed to select either no difference, program A or B.
Session One: Hearing Assessment
A complete hearing assessment, including case history, otoscopy (of both ears) and pure-tone audiometry, was administered to all patients who were referred by their GP direct to the NHS audiology clinic at Withington Community Hospital. Procedures were performed in accordance with British Society of Audiology (2018b, 2022) guidelines and conducted in sound-treated booths (with ambient conditions recommended by the British Standard, BS 60118-0: 2015). Air and bone conduction hearing thresholds at octave and semi-octave frequencies were obtained using calibrated Interacoustics Affinity 2.0 audiometers. Patients eligible for inclusion in the study were introduced to the first author, who provided written information sheets and answered questions about the study.
Session Two: Hearing aid Fitting - Three to Four Weeks After the First Session
Written consent was obtained at the hearing aid fitting session. Hearing aids were then programmed using initial fit and REM.
To record the real-ear responses for both initial fit and REM, a 1.1 mm probe tube was inserted into the participant's open ear canal and positioned within 5 mm of the tympanic membrane. The real ear unaided response (REUR) was then measured with a pink noise presented at 65 dB SPL from the loudspeaker, which was placed 80 cm and 0° azimuth from the participant's nose. The NHS hearing aids were then placed in the participant's ears and the real ear aided response (REARs) of the initial fit program were recorded using the International Speech Test Signal (ISTS; Holube et al., 2010) at 50 and 65 dB SPL. Next, the amplification characteristics of the initial fit program were fine-tuned based on the participant's immediate feedback. The adjusted values were then saved to the hearing aids as program A, and the new REAR were recorded.
A similar method to initial fit was used to fit the hearing aids to NAL-NL2 targets using REM. In this approach, the NHS audiologist used the probe-tube microphone system to match, as closely as possible, the manufacturer NAL-NL2 approximated values to the NAL-NL2 targets for inputs of 50 and 65 dB SPL. The REAR of the matched values were measured before and after fine-tuning with the adjusted values saved as program B.
Next, the first author randomized the order of the hearing aid programs as described in the previous section. The participants and the NHS audiologist were blinded to the program order; that is, the first author retained or changed the order of hearing aid programs without informing the participant or the NHS audiologist.
At the end of the fitting session, the participants were taught how to switch between the two programs via the hearing aid push button and the ‘Oticon On’ smartphone application. Participants were also taught to carefully listen to the hearing aid's alerting beeps while switching between programs (e.g., “you will hear one beep when program A is activated and two beeps in the case of program B”). Participants were then encouraged (and given paper-based instructions) to use both programs every day in various real-world listening environments by switching between programs and recording their preferences in a daily diary.
Session 3: Hearing Aid Follow-Up (Approximately Six Weeks After the Second Session)
At the 6-week follow-up appointment, participants’ preference diaries were collected. Participants were then asked to complete a one-page preference questionnaire to measure the reliability of the obtained ratings and to obtain the reasons for their preference ratings. At the end of this final session, the participants were given the option of keeping the preferred program(s).
Patient and Public Involvement
Patients and members of the public from Washington Community Hospital and the Manchester BRC hearing health volunteer database were asked for their comments and suggestions on the design, content, and suitability of the preference diary and information sheet. Most responses were positive and reassuring. Some volunteers provided useful suggestions for improvements, including word choice and further clarification of items in the information sheet, which were taken into consideration while finalizing the study materials.
Data Analysis
Confirmatory Analysis
Descriptive statistics, histograms, and the Shapiro–Wilk test were used to explore the data distribution. As the data were not normally distributed, appropriate non-parametric tests were used to compare the two fitting approaches (e.g., the sign test and one-sample Wilcoxon signed-rank test). Preference data from the last four weeks only were included in the analysis as participants may take some time to get used to and appropriately compare the two programs. For overall preference (collected at the end of the trial), the proportional difference at the end of the study between those who preferred the REM fittings and those who preferred the initial fittings was calculated. The 95% confidence intervals (CIs) around the difference were then calculated after transforming all proportions into arcsine units; the back-transformed values are presented in this paper. The overall preference of each participant was taken as their final decision. We assumed this preference would reflect their cumulative experiences during the course of the 6-weeks with aiding.
The median and interquartile ranges (IQRs) of the preferences for all listening environments were also presented. The median deviations and IQRs between the measured and prescribed REARs at frequencies from 0.25 to 8 kHz were calculated and reported for both fitting approaches before and after adjustments based on the patients’ feedback. For each fitting approach, the root mean square (RMS) errors of deviations from 0.25 to 4 kHz were computed and compared. The RMS was used because it quantifies the magnitude of deviation averaged across frequency, but deviations in one direction at one frequency add to, rather than offset, deviations in the opposite direction at other frequencies. A cumulative odds ordinal logistic regression with proportional odds was performed to determine whether the participants’ age, pure-tone average and RMS error difference between initial fit and REM settings (for and 65 dB SPL input level) can predict the users’ overall preferences. The reliability of clarity and comfort ratings was assessed using the intraclass correlation coefficient (ICC) between the mean of week 6 preferences and the final follow-up questionnaire at the 6-week appointment. We selected the ratings from the final week and final follow-up questionnaire instead of the average of the 6-week ratings, as the earlier weeks’ ratings might have changed owing to auditory acclimatization.
The participants’ reasons for their ratings were explored and analyzed to identify themes in the participants’ preferences. Braun and Clarke's (2006) six-stage inductive theme analysis paradigm was employed. This was achieved by reading the participants’ responses multiple times by two authors, producing initial codes, looking for themes, evaluating the themes, defining the themes, and compiling a report. Per the protocol, participants who completed less than 30% of the preference diary were excluded from the final preference analyses.
Exploratory Analysis
Changes over time in clarity and comfort ratings (in quiet and noisy environments), which were not part of the planned analysis in the pre-registered protocol, were explored using the Friedman test.
Results
Participants
Figure 1 shows the CONSORT flow diagram for the study participants. Of the 711 adult patients who attended the audiology clinic at Withington Community Hospital from November 2021 to May 2022 and were assessed for eligibility, 58 were deemed eligible for inclusion and agreed to participate in the study. The remaining patients were deemed ineligible for inclusion primarily because post-COVID-19 direct referral clinics were filled with experienced hearing aid users who attend for hearing reassessment. Almost half of the participants’ hearing aids (N = 30) were programmed with initial fit as program A and REM as program B. The remaining participants (N = 28) received the reverse order. Of those recruited, 45 (78%) completed the clinical trial.
Table 1 summarizes the demographics, pure-tone averages, and hearing aid characteristics for those who completed the study. The mean pure-tone hearing thresholds and standard deviations for each audiometric frequency are shown in Figure 2.
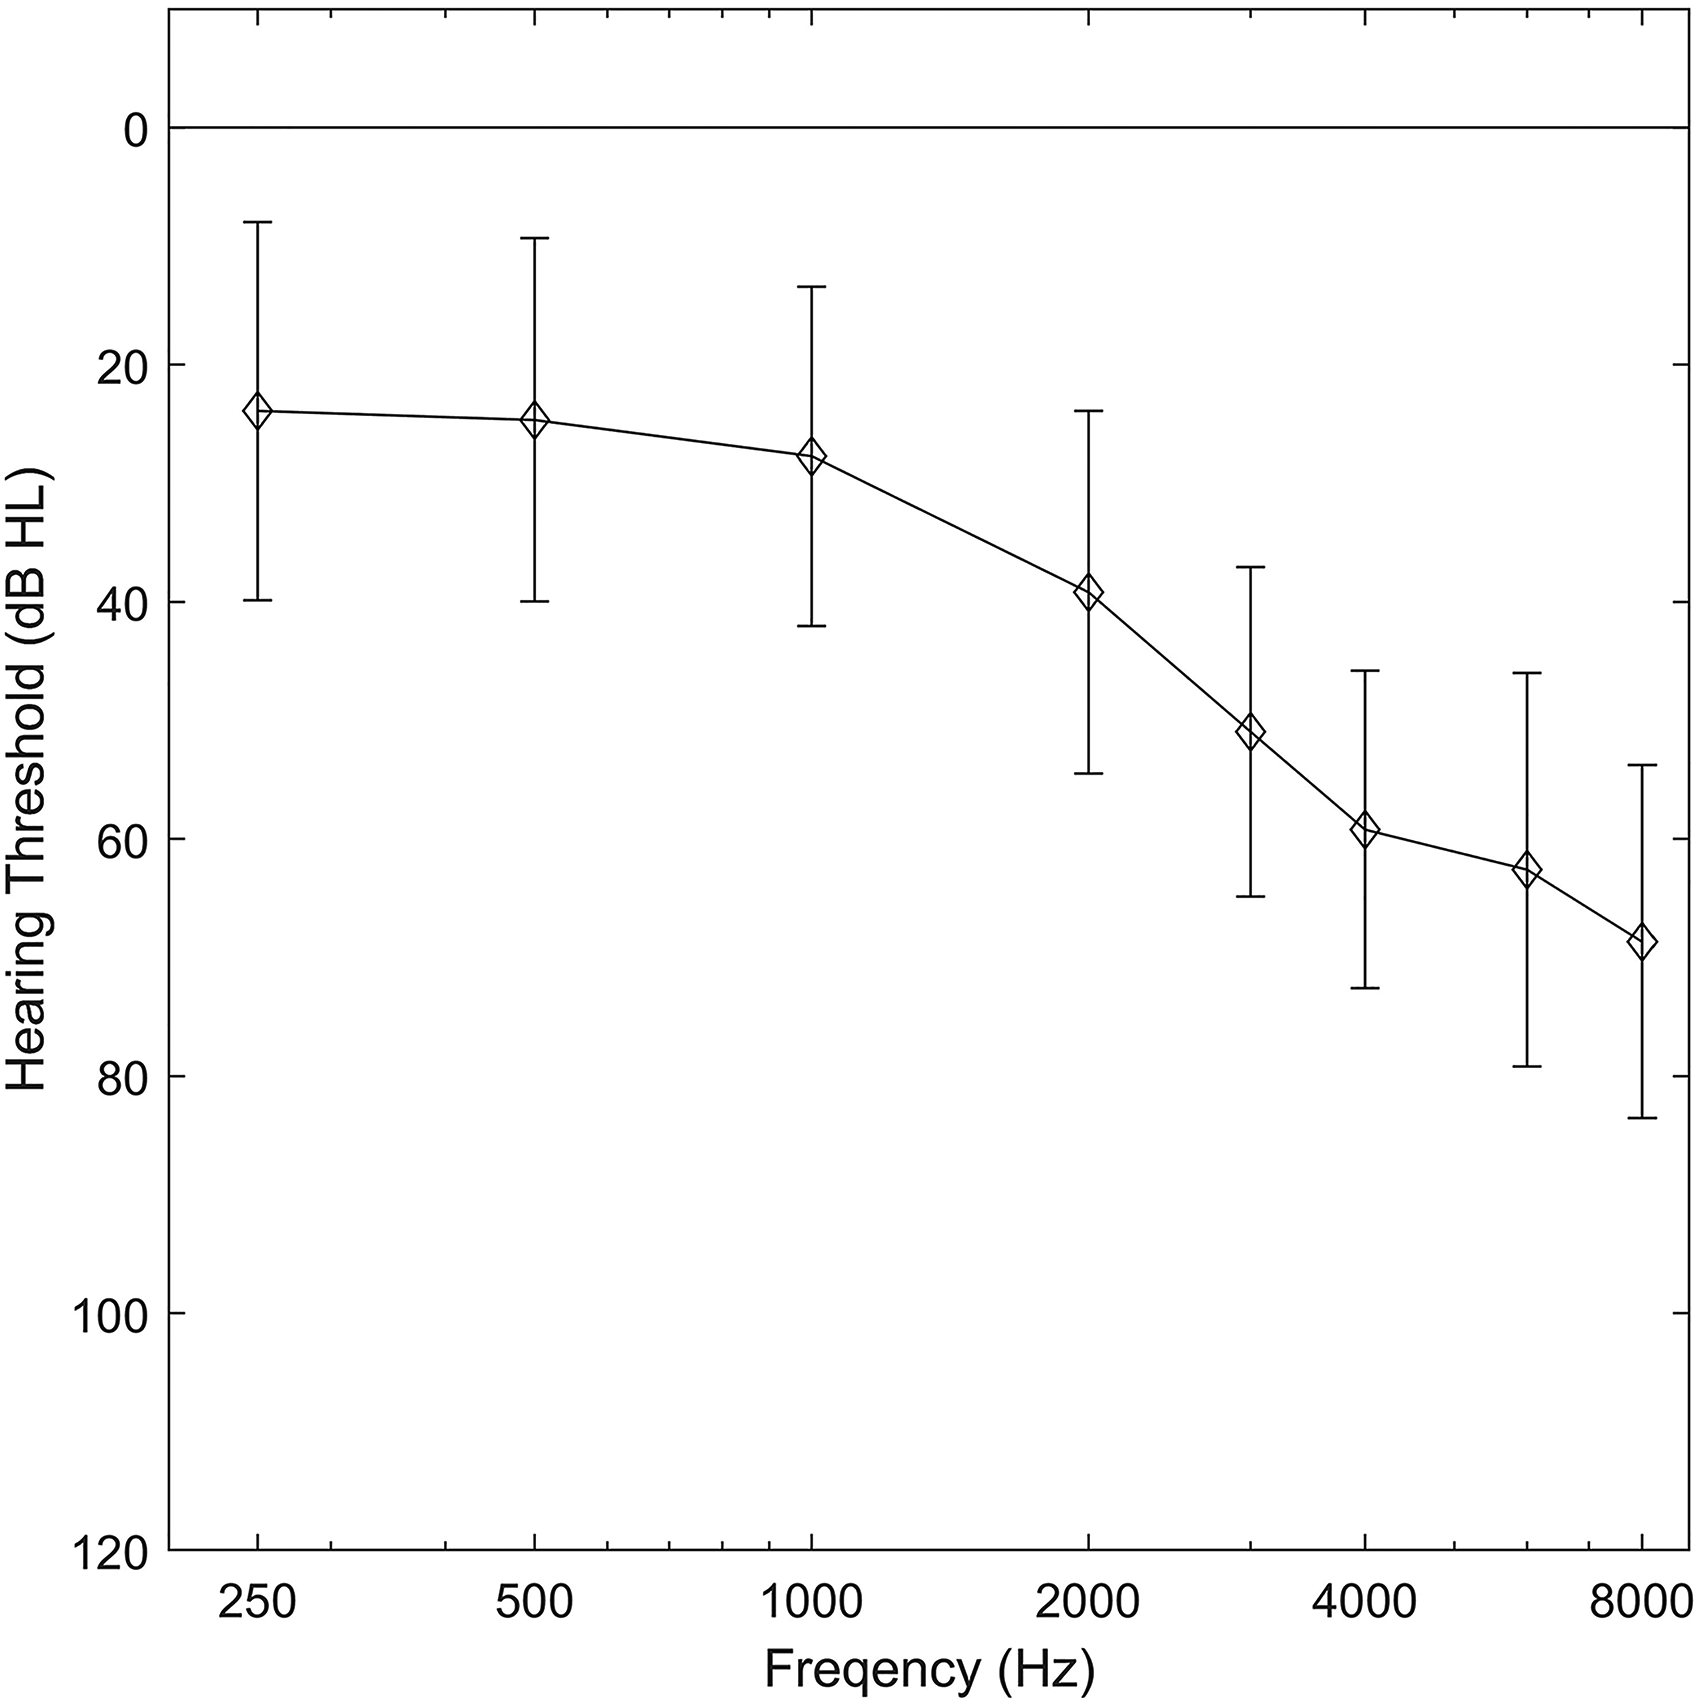
Means and standard deviations of the hearing thresholds of the fitted ears (35 bilateral and 10 unilateral).
Demographic Summary of the Participants.

a Number of those who completed and returned their preference diary. BTE = behind-the-ear.
Mean of 0.25 to 4 kHz.
Adjustments to the Initial Settings
Nine participants (14 fittings, 5 bilateral, and 4 unilateral) requested adjustments to one or both responses prescribed to them, resulting in a total of 23 adjustments (ca 14% of total fitted programs). Five of the 11 initial fit adjustments and six of the 12 REM adjustments resulted in a reduction in the gain (based on the sign of the average difference in overall gain from 0.25 to 8 kHz for 65 dB input level). Across the responses for which any adjustment was made, the median RMS error difference in gain after adjustment for the 50 dB SPL input level was 2.9 dB (range: 1.6–5.0 dB) for the initial fit and 2.3 dB (range: 1.1–6.3 dB) for the REM. For the 65 dB SPL input level, it was 2.8 dB (range: 0.9–4.2 dB) for the initial fit and 2.3 dB (range: 1.1–4.5 dB) for the REM.
Deviation from Prescription Targets
Figure 3 shows the median and IQRs of the deviations from the NAL-NL2 targets. For the 65 dB input level, the median deviations for the initial fit and REM settings were close to each other and clustered around 0 dB, except at 4 and 8 kHz, where gains were below target at both frequencies and more so for initial fit than REM at 4 kHz (−6 dB and −3 dB, respectively). In addition, REM deviations exhibited a narrower range than initial fits. Table 2 summarizes the RMS errors of the deviation from the NAL-NL2 targets for both fitting approaches. Although the RMS error differences between the two fitting approaches were relatively small, they were statistically significant, as determined by the Wilcoxon signed-rank test (p < 0.0001). The median difference between the RMS errors for the two approaches was approximately 2 dB, and the use of REM helped reduce the RMS error for 90% of the participants.

Box plots of the deviations between the measured REARs and NAL-NL2 targets for each fitting approach (before and after adjustments) at 50 dB SPL (Panel A) and 65 dB SPL (Panel B) input levels. The middle line in each box plot represents the median, and the top and bottom edges of the boxes represent the first and third quartiles. Minimum and maximum ranges are represented by whiskers, and outliers are represented by circles.
Summary of the Median Root Mean Square Error of the Deviations from the NAL-NL2 Targets for Each Fitting Approach (Before and After Adjustments) for Each Input Level. IQR Represents Interquartile Ranges.

Aim 1: Identifying Preferences
Participant Preferences
Clarity and Comfort
Figure 4 presents a raincloud plot of the paired comparison with magnitude estimation (averaged from weeks 3 to 6) of the clarity and comfort of sounds in quiet and noisy environments. Positive ratings indicate a preference for the REM fitting, and negative ratings indicate a preference for the initial fit. The median preference ratings for clarity were around zero and not statistically significant on the sign test (Quiet: Mdn = −0.04, z = −0.961, p = 0.337; Noise: Mdn = 0.00, z = −1.352, p = 0.176).The median preference ratings for comfort were in favor of initial fit and were statistically significant on the sign test (Quiet: Mdn = −0.76, z = −2.882, p = 0.004; Noise: Mdn −0.62, z = −3.167, p = 0.002).

Raincloud plots of participants’ clarity and comfort ratings. The data distributions and raw data are represented by the clouds and the closed circles. The medians and means are represented by the middle lines and open circles inside each box plot. Interquartile ranges are represented by the lower and upper edges of each box plot. Whiskers represent the minimum and maximum values. IF = initial fit; REM = real-ear measurement.
Overall Preference
Of those who successfully completed this experiment, 27 preferred initial fit, 10 REM and 8 had no preference. The proportion preferring initial fit (60%) was greater than REM (22%) and this was statistically significant (proportion difference = 38%, p = 0.008). Panel B in Figure 5 shows the proportion difference and the 95% CI between REM and initial fit.

Shows the proportion difference and its 95% CIs between the REM and initial fit.
Reliability of Preference Ratings
The reliability of clarity and comfort ratings was assessed between the mean of week six preferences and final follow-up questionnaire at the follow-up appointment. The intra-class correlation coefficient and its 95% confidence intervals were computed based on a mean-rating, absolute-agreement, two-way mixed-effects model. Good to excellent test-retest reliability was found for clarity in quiet 0.936 (0.851 to 0.971) F (30, 30) = 18.129, p < .0001; clarity in noise 0.939 (0.871 to 0.971) F (28, 28) = 16.384, p < .0001; comfort in quiet 0.968 (0.933 to 0.984) F (30, 30) = 30.237, p < .0001; and comfort in noise 0.832 (0.645 to 0.921) F (28, 28) = 5.926, p < .0001.
As indicated by the Friedman test, participants’ averaged weekly ratings did not significantly change from week 1 to week 6 for clarity in quiet χ2 (5) = 4.574, p = 0.47; clarity in noise χ2 (5) = 3.737, p = 0.60; comfort in quiet χ2 (5) = 6.235, p = 0.28; or comfort in noise χ2 (5) = 8.824, p = 0.12.
Predicting Participants’ Preferences
A cumulative odds ordinal logistic regression with proportional odds was performed to determine the effect of: (i) order of program, (ii) age, (iii) pure-tone average, and (iv) RMS error difference between initial fit and REM on overall preference (for 65 dB SPL input level). There were no significant associations with preference (Program order: odds ratio = 0.547 [95% CI, 0.153 to 1.956], χ2 (1) = 0.851, p = 0.35); Age (years): odds ratio = 0.969 (95% CI, 0.926 to 1.015), χ2(1) = 1.764, p = 0.18; PTAs (in dB HL): odds ratio = 0.985 (95% CI, 0.940 to 1.032), χ2(1) = 0.426, p = 0.51; and RMS error difference (in dB): odds ratio = 1.550 (95% CI, 0.930 to 2.584), χ2(1) = 2.831, p = 0.092).
Aim 2: Explaining Participants Preference
Of those who completed the study, 44 provided written responses for their preferred choices. Given the short and succinct nature of the responses, patterns were grouped into themes without subthemes for three groups: no overall preference (n = 8), preferred initial fit (n = 27), preferred REM (n = 10). Table 3 summarizes the frequency of codes for each theme and preference. For all direct supporting quotations, programs A and B were replaced with the actual name of the program (i.e., initial fit and REM). Individual responses, on some occasions, provide different codes within the same theme. Analyzing responses from 42 onward did not result in identifying more key themes; hence, saturation was achieved.
Frequency of Each Code/Reason.

Note. IF = initial fit; REM = real-ear measurement.
Preferred Initial Fit
Three main themes were identified from the responses of the 27 participants who preferred initial fit: (a) initial fit is mellow and less annoying, (b) initial fit is clear and (c) there are minimal differences between fitting approaches. Many of those who preferred the initial fit felt that it was mellower and had fewer annoying sounds compared to REM. They described hearing ‘hissing’, ‘tinny’ and ‘harsh’ sounds while using the REM program: ‘I chose initial fit because I often heard a sound like gushing water with REM and it was a bit tinny, whereas initial fit was mellower and more pleasant’ (P26).
Understanding speech with ease (i.e., greater clarity) was also another theme/reason for those who preferred initial fit. Participants, on many occasions, preferred the clarity of initial fit because there were distracting and interfering sounds with REM: ‘The initial fit program was preferable (especially in quiet places); it was clearer with less distraction’ (P19).
Although clarity was identified as a theme among participants who preferred initial fit overall, some acknowledged that REM provided them with more clarity in noisy environments: ‘I prefer initial fit because it is less crackly than REM in both quiet and noisy places. … The only time REM was slightly preferable was at a noisy table with a lot of people talking around me. I tried REM, and speech near me was slightly more audible above the general clatter of chairs, tables and crackles in a very noisy environment’ (P43).
Selecting the preferred program was not an easy task for some participants; they felt that there were small differences between programs: ‘little difference between initial fit and REM, but just to make a choice, I would plump for initial fit’ (P50).
Preferred REM
Reasons for the 10 participants who preferred REM were classified under three key themes: (a) REM is clearer and provides access to treble sounds, (b) REM is more pleasant and (d) there are minimal differences between fitting approaches. Most respondents who preferred the REM program liked it because it was louder, clearer and helped them to understand speech in complex listening environments: ‘I found that REM was clearer in certain areas. I work in a school which can often be a noisy environment…’ (P05). The ability to hear treble sounds was mentioned by some of those who preferred the REM program: ‘I prefer REM over initial fit because I can hear higher pitched sounds in music and birds’ (P28). Some participants appreciated the pleasantness of the REM program. They described it as being ‘comfortable’ and ‘free from distortion’. For example, one participant reported that ‘REM was more comfortable overall’ (P39).
Similar to those who preferred initial fit, some those who preferred REM felt that there was little difference between the two program: ‘… other than that I felt there wasn’t a difference between REM and initial fit’ (P48).
Had No Preference
Qualitative analysis of the responses of those who had no preference resulted in the identification of a single key theme: minimal or no differences between fitting approaches. Many participants indicated that there were no differences between the programs: ‘I could not detect any difference between the two programs in either quiet or noisy places’ (P25).
Discussion
This clinical trial is one of the first to use a double-blind, randomized, mixed-methods design to examine the routine use of REM for new adult hearing aid users. A daily diary was used, and participants were encouraged to swap between programs every day, to examine whether new adult hearing aid users prefer REM or initial fit and the reasons for their preferences. The following are the main findings of this study:
Gain adjustments were relatively few in number and small in magnitude. Median deviation from target was small with REM typically 3 dB closer to high frequency targets. There was no difference in median clarity ratings between the initial fit and REM, but comfort ratings favored the initial fit. 78% of participants did not report a preference for REM. Reasons for preferring initial fit were primarily based on comfort, and for preferring REM were primarily based on clarity.
Adjustments to Amplification Characteristics
Nine participants (20%) requested modification to the amplification characteristics, and most of these changes were relatively small. The median RMS error difference in gain after adjustment for the modified responses was 2.5 dB (range: 0.9–6.2 dB). These findings are larger than those reported by Abrams et al. (2012), who found that 15% of the initial fit and REM fittings were further adjusted based on patients’ feedback, and the RMS deviation was never greater than 1.1 dB from the original response. Post-fitting adjustments, when withheld from half of the new hearing aid users in Cunningham et al. (2001), did not significantly impact their self-reported and speech-in-noise performance. The magnitude of most changes in our trial and the findings of Cunningham et al. (2001) suggest that clinic-based fine-tuning (particularly those based on immediate patient feedback) may not necessarily improve participants’ outcomes.
Deviation from Prescription Targets
The deviations from prescription targets for initial fit and REM fittings have been investigated previously, with almost all reporting the same pattern of initial fit being below target (especially at high frequencies and low input levels) and a better match being obtained with REM (Aazh & Moore, 2007; Aazh et al., 2012; Munro et al., 2016; Sanders et al., 2015; Valente et al., 2018). A similar pattern was observed in the current study; however, an important observation is that the under-fit for both fitting approaches was smaller than in previous studies. Over time, hearing aids have become more adjustable, and manufacturers probably have more information on how to correct for earmold and ear tip acoustics (Dillon, 2012). The proportion of initial fit and REM fittings that were within 10 dB of the prescribed targets at frequencies from 0.5 to 4 kHz from a sample of studies along with the proportion identified in this study are reported in the Supplemental Material 1. As can be seen, there is a clear and steady improvement in the accuracy of initial fits, at least for the hearing aid models tested. For example, 20% of custom earmold initial fittings were within 10 dB of target in Munro et al. (2016) compared to 67% in the current study. Similar improvements in the manufacturers’ initial fits were also observed in recently published studies that found small initial fit deviations from targets and greater consistency between manufacturers (Folkeard et al., 2019; Narayanan et al., 2022).
Although the differences in the overall gain between initial fit and REM were relatively small, they were enough to elicit a preference for most participants. Although not directly comparable, the RMS difference between initial fit and REM for those who preferred a program—around 3.5 dB—was above the median just-noticeable-difference change in level for broadband noise (1.5 dB) stimuli (Caswell-Midwinter & Whitmer, 2019a; Caswell-Midwinter & Whitmer, 2019b). Previous research also suggests that differences of around 2 dB in overall gain can elicit preferences (Abrams et al., 2012; Keidser et al., 2008; Sabin et al., 2020).
While there has been a constant and steady improvement in the manufacturer's approximations of prescriptions, some differences in gain between initial fit and REM may continue to exist even in newer generations of hearing aid. That is, if the average ear canal acoustics, microphone location, and earmold characteristic effects used in a given hearing aid correction algorithm vary from the individual values, the hearing aid software may not be able to accurately approximate prescription targets (Munro & Mueller, 2016).
Aim 1: Identifying Preferences
Clarity and Comfort
On average, preference ratings for comfort were significantly better with initial fit than with REM. These findings align with those of Valente et al. (2018), who found that new users report lower averseness scores for initial fit than for REM on the Abbreviated Profile for Hearing Aid Benefit (APHAB; Cox & Alexander, 1995). Higher comfort ratings for initial fit could be attributed to the lack of tolerance and acclimatization to the additional high-frequency amplification associated with the REM program. Indeed, many participants described the REM program as hissy and tinny when asked about the reasons for their preference for the initial fit. Other participants, however, appreciated the REM's high-frequency boost and clarity. However, we cannot be sure that participants with a preference for comfort spent sufficient time with the REM program to acclimatize to, and benefit from, the additional high-frequency response.
Overall Preference
37 (82%) of participants expressed an overall preference for one of the programs. Of those expressing a preference, most (73%) preferred the initial fit overall i.e., only 22% of all participants expressed an overall preference for REM. This finding contrasts with those reported by Abrams et al. (2012), Boymans and Dreschler (2012), and Valente et al. (2018). Key differences in methodology could explain this apparent discrepancy. For example, unlike the present study, Abrams et al. (2012) involved experienced users who may have preferred REM because this was similar to what they had been using prior to enrolling in the study. The mean deviations from NAL-NL1 65 dB SPL targets for initial fit were around −10 to −15 dB at frequencies from 1 to 4 kHz. In this study, the median deviations from NAL-NL2 65 dB SPL targets for the initial fit were −2 and −6 dB at 1 and 4 kHz, respectively.
Interestingly, the gain averaged across the frequency of the preferred program in this study (i.e., initial fit) was, on average, around 2 dB lower than that of REM. Studies on self-fitting based on daily adjustments have shown that new users, on average, set their hearing aids 1.8 dB lower than the audiologist's fit (i.e., NAL-NL2 with REM verification; Sabin et al., 2020).
Reliability of the Participants’ Preferences
Excellent reliability (i.e., agreement between the final week diary entries and the ratings at the review appointment) was found in this clinical trial. This observation was not unexpected, given that adults and children were found to provide reliable preference ratings when asked to compare different settings or prescription methods (Caswell-Midwinter & Whitmer, 2021; Scollie et al., 2010).
Preference ratings were similar over the study period, consistent with those reported by Dawes and Munro (2017). This may indicate that changes in preferences over time are limited or lack adaptation to the non-preferred responses (i.e., participants with a preference for one program might have made little use of the alternative program, resulting in insufficient time to get used to the alternative response).
Although preferences might be influenced by the default (first) program (Cox et al., 2016) and the fitting process perceived by the participants (embodied narrative; Naylor et al., 2015), blinding and randomizing the order of the programs and using REM measurements while setting up the initial fit program diminished the non-acoustic differences between the fitting approaches. The results of the ordinal logistic regression and the fact that 20 out of 45 participants preferred the first program show that the order of the programs had limited or no effect on the participants’ overall preferences.
Aim 2: Explain the Preferences
Qualitatively analyzing the participants’ reasoning for preferences provided a more in-depth insight into the differences between initial fit and REM. The most frequent themes for those who preferred initial fit and REM were ‘initial fit is mellower and has less annoying sounds’ and ‘REM is clearer and provides access to treble sounds’. These findings indicate that, in general, the greater high-frequency gain of the REM program played a major role in driving the users’ listening preference ratings.
The participants who preferred the initial fit did not tolerate the hiss and tinny sounds and the louder background noises of REM. A lack of tolerance to such sounds is, indeed, one of the main reasons for hearing aid disuse (McCormack & Fortnum, 2013). A similar theme was also reported by Dawes et al. (2014), who investigated NHS hearing aid users’ perspective of getting used to hearing aids. As mentioned earlier, we could not be sure whether the participants who preferred comfort spent sufficient time with the REM program to acclimatize to and benefit from the additional high-frequency response. The use of the experienced user prescription target is unlikely to be an issue because this does not differ from new users when the pure tone average is <40 dB HL and is small (<3.5 dB) for pure-tone averages <50 dB HL (Keidser, Carter et al., 2012; Keidser, Flax et al., 2011). Our users had a pure tone average <35 dB HL. Thus, we do not think that this issue had much effect in this study.
Contrary to those who preferred initial fit, almost all who preferred REM reported that this gain-frequency response provided them with greater clarity and more access to treble sounds. This theme is not unexpected because the primary aim of the NAL-NL prescription methods is to maximize speech intelligibility (Byrne et al., 2001; Keidser et al., 2011).
Interestingly, five of those who preferred initial fit reported greater clarity with REM but enjoyed the comfort of initial fit. Similarly, two of those who preferred REM reported greater comfort with the initial fit but appreciated the clarity of REM. This may suggest that users may differ in how they weigh their overall preference, irrespective of the benefit obtained. Thus, it may be worthwhile asking if a given patient places greater weight on the clarity or comfort of sounds.
Strengths and Limitations
This study compared the two fitting approaches for new adult users with mild-to- moderate sensorineural hearing loss, using one hearing aid prescription, the same fitting software and the primary outcome of listening preference. The findings of this study could be generalized to other prescription methods, given the similarity between prescription methods (Johnson & Dillon, 2011) and the lack of noticeable deviations of initial fits from targets that were found with the Desired Sensation Level prescription method (Folkeard et al., 2019). However, caution should be exercised when generalizing the results of this experiment to other manufacturers’ fitting software, as there are mixed reports of deviation from target values (Narayanan et al., 2022; Sanders et al., 2015). In addition, it is unclear whether the findings can be generalized to other types and severities of hearing loss. Previously published studies have indicated that the more severe the hearing loss, the less accurate the manufacturer's initial fits, irrespective of the hearing aid model (Folkeard et al., 2019; Quar et al., 2019). In addition, these studies also found that using the REM for this particular group did little to improve the matches to the prescribed targets (Dao et al., 2021; Quar et al., 2019).
While REM has limitations in the high frequencies, the impact on this study's findings is minimal due to placing the probe tube within 5 mm of the tympanic membrane, according to the BSA (2018a) guidelines. This probe tube positioning results in an average insertion depth of 29 mm from the inter-tragal notch (Dillon, 2012), which has been found to provide accurate measures for high frequencies within 2 dB (Vaisberg et al., 2016).
Although this study focused on user preference without evaluating other outcomes, recently published studies have found no statistically significant difference in The Glasgow Hearing Aid Benefit Profile (GHABP; Gatehouse, 1999) between REM and initial fit in new hearing aid users (Duckworth et al., 2022).
In addition, this study used a within-subject design, where all participants were fitted with two programs, which might have resulted in a lack of sufficient acclimatization to the non-preferred program. Data logs were not obtained during the experiment, and the amount of time spent by each participant on each program was unknown.
Clinical Implications and Future Directions
The measured close proximity of the initial fit to targets and participants’ preferences for initial fits may suggest that audiologists could start fitting hearing aids using this approach and use the saved time and resources for counseling. However, audiologists should ensure that the potential user does not have unusual ear canal anatomy and that the hearing aid model they prescribe has been shown in the literature to produce initial fits that are reasonably similar to those of the verified fittings. They should also allow those unsatisfied with their fittings to have REM verification and, if necessary, further adjustment. Nevertheless, further studies are needed to explore whether similar results can be obtained using different outcome measurements, hearing aid brands, and prescription methods on adults with various levels of hearing loss severity. If the initial fit efficacy is sustained, future research should consider exploring the most effective practices for using the time and resources saved from dropping REMs (e.g., embodied narrative; Naylor et al., 2015).
The frequency of annoying sounds and loud background noise complaints from the REM program should warrant further clinical attention, as they may consequently deter the users from using their hearing aids. Thus, audiologists may consider fitting participants with two programs, one for clarity and another for comfort, or activate the volume control so that users can reduce the overall gain when needed.
The differences in listening preferences stemming from how people value and weigh clarity and comfort of sounds represent an interesting outcome that is worth investigating in future research. Predicting patients who place more value on clarity and high-frequency amplification (pre-fitting) could identify those requiring REM verification to ensure they receive the gain needed at the high frequencies.
The findings of this study reveal that adjustments made to the amplification characteristics during the fitting appointment are low in number and mostly relatively small. This suggests that clinic-based fine-tuning (particularly those based on immediate patient feedback) may not necessarily improve participants’ outcomes, consistent with reports in the literature (Caswell-Midwinter & Whitmer, 2019a; Caswell-Midwinter & Whitmer, 2019b). Thus, future experiments should consider determining the effectiveness relative to the time cost of these adjustments.
Deviations from the Pre-Registered Protocol
There were three deviations from the registered protocol:
The RMS error of the deviation between the measured and prescribed NAL-NAL 2 responses was calculated at frequencies from 0.25 to 4 kHz, instead of 0.25 to 8 kHz, to facilitate the comparison between the findings of this study and those of previous publications. We used non-parametric tests, where data were not normally distributed as determined by the Shapiro–Wilk test. Additional exploratory analyses were performed to identify the magnitude of clinic-based adjustments and determine whether participants’ preference ratings changed over time.
Conclusion
This registered, double-blind, randomized, mixed-methods clinical trial has investigated the outcome of initial-fit and REM fitting methods in new adult hearing aid users with mild-to-moderate hearing loss. Improvements in manufacturers’ initial fit, mean there is a close match to the prescription target without the need for real ear measures, at least for the models of hearing aid used in the present study. In addition, 35 (78%) of new users did not express a preference for the REM program. It may be acceptable to fit new adult users with mild-to-moderate hearing loss without routine use of REMs, if preference is the primary outcome of interest. Any time savings could be used to focus on patient-centered care addressing the specific listening needs of the individual. It remains to be seen if it is possible to predict the new adult users who will prefer the REM program or if the findings apply to other outcome measures.
Supplemental Material
sj-docx-1-tia-10.1177_23312165231189596 - Supplemental material for Listening Preferences of New Adult Hearing Aid Users: A Registered, Double-Blind, Randomized, Mixed-Methods Clinical Trial of Initial Versus Real-Ear Fit
Supplemental material, sj-docx-1-tia-10.1177_23312165231189596 for Listening Preferences of New Adult Hearing Aid Users: A Registered, Double-Blind, Randomized, Mixed-Methods Clinical Trial of Initial Versus Real-Ear Fit by Ibrahim Almufarrij, Harvey Dillon, Benjamin Adams, Aneela Greval and Kevin J Munro in Trends in Hearing
Supplemental Material
sj-docx-2-tia-10.1177_23312165231189596 - Supplemental material for Listening Preferences of New Adult Hearing Aid Users: A Registered, Double-Blind, Randomized, Mixed-Methods Clinical Trial of Initial Versus Real-Ear Fit
Supplemental material, sj-docx-2-tia-10.1177_23312165231189596 for Listening Preferences of New Adult Hearing Aid Users: A Registered, Double-Blind, Randomized, Mixed-Methods Clinical Trial of Initial Versus Real-Ear Fit by Ibrahim Almufarrij, Harvey Dillon, Benjamin Adams, Aneela Greval and Kevin J Munro in Trends in Hearing
Footnotes
Acknowledgments
Ibrahim Almufarrij is partially funded, and Kevin J Munro and Harvey Dillon supported, by the NIHR Manchester Biomedical Research Centre (NIHR203308). The views expressed in this publication are those of the authors and not necessarily those of the National Health Service, the NIHR or the Department of Health and Social Care. Ibrahim Almufarrij is also supported by the Deanship of Scientific Research at the College of Applied Medical Sciences Research Center at King Saud University. Special thanks to all audiologists at Withington Community Hospital for their help in the recruitment process.
Declaration of Conflicting Interests
The authors declared no potential conflicts of interest with respect to the research, authorship, and/or publication of this article.
Funding
The authors disclosed receipt of the following financial support for the research, authorship, and/or publication of this article: This work was supported by the NIHR Manchester Biomedical Research Centre, (grant number NIHR203308).
Supplemental Material
Supplemental material for this article is available online.
References
Supplementary Material
Please find the following supplemental material available below.
For Open Access articles published under a Creative Commons License, all supplemental material carries the same license as the article it is associated with.
For non-Open Access articles published, all supplemental material carries a non-exclusive license, and permission requests for re-use of supplemental material or any part of supplemental material shall be sent directly to the copyright owner as specified in the copyright notice associated with the article.