
Abstract
The use of automated coding procedures to scale up content analysis has risen over the last years. Using a mixed-method approach, we examine researchers’ justifications to scale up content analysis and assess the methodological adjustments—or lack thereof—when employing supervised machine learning for 38 large-scale content analyses. Almost all of the included studies displayed deficiencies in study design, primarily related to the uncritical use of frequentist statistics on datasets containing the entire statistical population, or employing supervised machine learning without methodological adjustments to account for misclassifications. Our findings question the need for large datasets and automated coding in the first place.
Researchers are increasingly drawn to methods that promise to extract insights from vast amounts of information, often believing that larger datasets inherently offer more valid, objective, or revealing results. This belief, described by boyd and Crawford (2012) as the “mythology” of Big Data, positions data scale as a marker of truth, objectivity, and knowledge. With the ever-growing torrent of digital data, we communication researchers have adopted automated coding, such as supervised machine learning (SML), as one of the tools for scaling up content analysis. While automated coding allows for efficient coding of large corpora, its application in communication research raises critical questions about researchers’ justifications to favor large census datasets over traditional representative samples, and the intended (or unintended) methodological adjustments. Through a review of 38 empirical studies that used SML, this article critically examines their study designs, specifically focusing on the use of automated coding in content analysis of text data. Our results suggest that the allure of Big Data is associated with researchers adopting large data and automated coding without sufficient methodological consideration. By confronting the mythology of Big Data and its influence on research practices, this study evaluates the appropriateness of very large datasets and automated coding in communication research.
To address these questions of justifications and methodological adjustments, we employed a mixed-method approach, combining qualitative and quantitative analyses across a dataset of 38 empirical studies published between 2013 and 2020. We applied reflexive thematic analysis (RTA) to explore how researchers justify the automation of manual coding tasks in content analysis and to understand their conscious and unconscious methodological adjustments to these decisions. This qualitative component allowed us to capture both explicit justifications and subtler, latent factors influencing the use of SML. By analyzing articles that directly compared manual and automated coding, we gained a comprehensive understanding of the factors driving the adoption of SML and the potential impact of its use in content analysis. We consolidate the themes we discovered through RTA and present points of self-reflection (PSRs) to the researcher community that we complement with statistical evidence on key methodological aspects.
The Big Data Meta
We define Big Data as a cultural, technological, and scholarly phenomenon that rests on the interplay of: (1) Technology: maximizing computation power and algorithmic accuracy to gather, analyze, link, and compare large data sets. (2) Analysis: drawing on large data sets to identify patterns in order to make economic, social, technical, and legal claims. (3) Mythology: the widespread belief that large data sets offer a higher form of intelligence and knowledge that can generate insights that were previously impossible, with the aura of truth, objectivity, and accuracy. (boyd & Crawford, 2012, p. 663)
As an anecdote, a new textbook on content analysis for communication researchers was recently published (Oehmer-Pedrazzi et al., 2023). It has been published after what several scholars call the Computational Turn (Hase et al., 2022; Hepp et al., 2021; Lukito & Pruden, 2023); 1 therefore, it might reflect how communication researchers think about content analysis today. The book contains chapters on manual and automated content analyses. Like previous textbooks (e.g., Krippendorff, 2018; Neuendorf, 2017; Riffe et al., 2014), the chapter on manual content analysis contains a section on sample size planning, which includes a description of the population and the sampling procedure. The subsequent chapter on automated content analysis, however, cites the four-step procedure by Wilkerson and Casas (2017) as “[c]ommon steps of analysis and research designs.” According to this four-step procedure, there is no sample size planning phase 2 and automated content analysis starts immediately with data collection, which entails obtaining a large text corpus either through news databases or application programming interfaces (APIs). The subsequent steps are data preprocessing, data analysis, and data validation.
This anecdote highlights a drastic difference in the practices between manual and automated content analysis beyond the coding procedure (the often-thought definitional difference between the two) as expressed in this new textbook: The size of text corpora plays a strong role in this form of content analysis. But the focus on the data size in this textbook was not a singular event. 3 Several methodological introductions published in communication journals also carry this focus. For example, Günther and Quandt (2015, p. 75) posit automated text analytic methods as a reaction to “new challenges to describe and analyze the wealth of information.” Similarly, Trilling and Jonkman (2018, p. 160) claim that the decision to scale up content analysis through automation arises “from the need to keep pace with the data revolution.” Or Jarvis et al. (2021, p. 42) suggest that automation in content analysis would “offer new ways to measure what people think, feel, and talk about—on the level of a whole society” and that “[t]he abundance of text data now available makes the limited scalability of traditional approaches more apparent.” It appears to us that the initial skepticism toward automated coding in content analysis (e.g., Grimmer & Stewart, 2013; Riffe et al., 2014) has faded away. Empirical research supports this view: Jünger et al.’s (2022) literature review of communication articles analyzing social media data found that automated data collection often goes hand in hand with automated data analysis techniques in practice.
What Justifies Large-Scale Content Analysis?
While it is true that through computational methods it has become easier to obtain and process more data for content analysis, this does not imply that one should always do so. From a statistical standpoint, one does not need to analyze very large samples or even conduct a census to study the population (see Appendix A). Even though the uncertainty around one’s estimates of interest diminishes with increasing data size all else being equal, inferring from a sufficiently sized representative sample is often adequate. In line with that, the traditional literature on content analysis (e.g., Krippendorff, 2018; Neuendorf, 2017) emphasizes the role of unitizing and sampling in the data making process. Also, in the early days of internet research, Weare and Lin (2000) discussed the opportunities offered by the abundance of data from the World Wide Web but still concentrated on unitizing and sampling (cf. Mahrt & Scharkow, 2013, on the difficulty of doing that).
This shift from studying a relatively small sample to studying large data (e.g., a large sample or census) can be partly attributed to the improvement of techniques such as SML. But it is not clear what other factors drive researchers to study ever-increasing datasets. Therefore, for our study, we formulate our first research question: 4
The decision to study either large datasets or smaller samples has implications for the choice between manual and automated coding methods. The automation of coding serves as a means to scale up content analysis. A related question is:
With this first set of questions, we aim to investigate whether obtaining very large samples and using automated coding are even necessary in the first place. Using the critical definition of Big Data by boyd and Crawford (2012, quoted above), the quest for large datasets could be attributed to the mythological (not methodological) belief that large datasets offer a higher form of intelligence, although there is no empirical evidence that supports this mythological belief.
Are There Methodological Adjustments?
The first wave of methodological reflections on content analysis of text data, best summarized by Baden et al. (2021), has criticized the lack of validity of many measurements with automated coding, the lack of generalizability, and the lack of language diversity. Haim et al. (2023) critically evaluated current content analyses (including automated ones) and (re)established the quality criteria of validity, reliability, reproducibility, robustness, replicability, and ethics. While these evaluations are valid, they position the automated coding procedure mainly as an isolated component. Using Breiman (2001)’s notion of statistical modeling cultures, the isolation is rooted in the algorithmic modeling culture in computer science, which focuses mainly on the prediction made by an algorithm for a specific purpose. However, content analysis as a research approach in communication science is in the data modeling culture, which focuses on finding and explaining relationships among variables. From the perspective of the data modeling culture, automated coding methods such as SML represent one component within the broader system of the data making process and should not be considered in isolation.
The classic methodological literature (e.g., Krippendorff, 2018; Neuendorf, 2017; Riffe et al., 2014) points out that the data making process (including unitizing, sampling, and recording, i.e., coding) impacts the subsequent inference process. This means that the consequences of the data making step must be evaluated within the entire research process (a useful summary of the entire process is available as a schematic by Krippendorff, 2018, p. 90). An example of how should the research process be adjusted because of the larger data size is given by van Atteveldt and Peng (2018): They state that data size and statistical significance are no longer “a sign of validity nor of invalidity of the conclusions” when the data are too large (p. 86); instead one should focus on substantive effect size and validity. This points out the statistical repercussions of using a large dataset. Given these considerations, our second research question is:
Some researchers express their concerns about automated data making and theory building (Hilbert et al., 2019; Waldherr et al., 2021). From our understanding, the most comprehensive diagnoses thus far are Mahrt and Scharkow (2013) and De Grove et al. (2020). They disclose the rarely discussed trade-off between measurement quality and sample quantity. A concrete evidence of this trade-off is TeBlunthuis et al.’s (2024) study on the measurement errors introduced by misclassifications in SML and their impact on the subsequent regression analysis.
With the above questions, we aim to understand the justifications and reasoning for employing SML as a means to scale up content analysis and also investigate whether the researchers reflect upon their methodological choices and study design. We ask these questions about SML because in our view, they are indicative of a larger trend in recent years in communication science that follows the Big Data Meta (Fuchs, 2017). Methodologically speaking, when to use manual or automated coding in content analysis is not clearly demarcated, except in terms of social factors such as knowledge silos (Hilbert et al., 2019; cf. Baden et al., 2021) or unequal access to computational resources and data (boyd & Crawford, 2012; Bruns, 2019). Traditionally, researchers need to plan the sample size of their content analyses carefully, because manual coding is often thought to be resource intensive and researchers want to make the best use of (human) resources. However, for automated coding, researchers might have taken the exploratory approach from data science 5 and got used to unplanned data collection activities to “compile huge troughs of data with few constraints” (Puschmann, 2019, p. 1582) and then engage in frequent iteration of their methods until they reach a point that they find acceptable (Wilkerson & Casas, 2017). Sample size planning seemingly has become less important and the exploratory approach contradicts the hypothetico-deductive tradition of quantitative content analysis. The research community should not merely accept the usage of computational methods for their own sake, especially given that SML can be error prone and, in the worst cases, may lead to wrong substantial conclusions (Fong & Tyler, 2021; H. Zhang, 2021).
Methodology
Inspired by the in-depth analyses by Baden et al. (2021) and Jünger et al. (2022), we took a mixed-method approach to study our questions (
Research Object: Content Analysis With Automated Coding
In this article, we specifically focus on content analysis of textual data that employs automated coding using SML. We chose SML for two reasons. First, it is at the intersection of manual and automated content analysis. When it is applied in content analysis, it can be understood as an automated extension of the manual coding process (Scharkow, 2011). It requires researchers to provide a manually coded “gold standard” (or training set), which is then fed into an SML algorithm. Second, we think SML is the best research object to answer
The research object of this study is not “automated content analysis.” Although the term is widely used, we found many conflicting definitions. The meaning of it is not clear enough to formulate suitable inclusion and exclusion criteria for our study. But an overarching feature is that one uses different computational methods to replace or extend manual coding: dictionaries, topic modeling, or SML, and so on. But as outlined in the introduction, “automated content analysis” does not seem to be determined simply by the method of coding.
There are other self-operating, or automatic, coding methods, such as off-the-shelf dictionary methods and topic modeling techniques. However, dictionary approaches are well understood (e.g., Boukes et al., 2019) and unsupervised methods, specifically topic models, are widely used but exhibit a separate set of complexities that exceed the scope of this study. There are other works that have scrutinized these methods in detail (e.g., Bernhard et al., 2023; Chen et al., 2023).
Data
Our study is based on the list of 102 publications provided by TeBlunthuis et al. (2024), which in turn is a compilation of reviews by Baden et al. (2021), Hase et al. (2022), Jünger et al. (2022), and Song et al. (2020). TeBlunthuis et al. (2024) gathered 102 articles published between 2013 and 2020 that employ some form of SML for content analysis of text data. Of those, they excluded articles that were either methods papers or articles which used SML for data cleaning but not for data analysis. These remaining 48 empirical articles serve as the basis of the current analysis. One drawback of this dataset is that the most recent articles were published in 2020. However, the data represent the 2010s which saw a strong increase in the usage of computational methods that was later coined as the Computational Turn. This first wave lasted until approximately 2020, right before the first major self-reflections and prescriptive works were published. We are particularly interested in how and why researchers scaled content analysis during this period. Our findings may not reflect how researchers think about these issues as of the date of this publication, or thereafter.
As we are interested in the decisions for scaling and automation over manual methods in empirical content analysis articles during this period, we established the following inclusion criteria:
The analysis was guided by hypotheses or research questions to study social phenomena.
A subset of the studied units was manually coded.
The first criterion excludes articles that studied methodological questions. The same exclusion criterion was used by Baden et al. (2021), Jünger et al. (2022), and Song et al. (2020). The second criterion is important because it ensures that manual coding produced the labeled data (rather than using structural clues such as publication time or URL structure) for the SML algorithm. Also, it excludes articles that either used machine learning models trained elsewhere (e.g., Microsoft Azure Sentiment Analysis API) or training data from elsewhere. It ensures that the manual coding part got automated.
Based on these two inclusion criteria, we excluded 10 articles (8 did not conduct any manual coding; 2 did not study social phenomena but methodological questions). Hence, 38 articles were eligible for further analysis. We will discuss the appropriateness of this data size in the next section. In the subsequent section, we use a hexadecimal notation to refer to these 38 articles AD to D2. Although their true identities are available in Appendix B, the purpose of this partial de-identification is to prevent any direct quote to be associated with author names in the APA citation style. Our potential critique is not directed toward any particular article and by extension toward particular researchers. Instead, our aim is to study how practitioners of content analysis (including us) thought about data size and automated coding. In the subsequent sections, we will use “we” to refer to the author(s) of the current article (except in quotes) and “researchers” to practitioners of automated coding. We are researchers too.
Reflexive Thematic Analysis
For our qualitative analysis, we chose to use RTA because it makes use of the researcher’s own expertise, perspective, and even subjectivity in the qualitative interpretation of data (Braun & Clarke, 2006, 2019a). We are actively aware that this analysis was anchored on our understanding of several methodological concepts: content analysis, frequentist analysis, and SML (see Terminology). For transparency, our team was composed of communication researchers and statisticians. We do have a methodological ideal of how a content analysis should be conducted, which is mostly based on Krippendorff (2018, or its older editions) as well as the recent canon about automated coding such as Grimmer and Stewart (2013), Haim et al. (2023), Scharkow (2011), and van Atteveldt and Peng (2018). We also had a preconception that some aspects of the current content analysis contradict our methodological ideal. We dealt with this by making our coding orientation explicit. According to Braun and Clarke (2022), investigators should choose and state their own orientation along the three axes: experiential/constructionist, inductive/deductive, and semantic/latent. We decided to choose a constructionist, deductive, and latent orientation. With this orientation, we coded both manifested and latent meaning in the data in a critical-realist manner. For example, we coded the absence of some elements (e.g., random sampling).
We followed the six-step approach advocated by Braun and Clarke (2006) and Braun and Clarke (2019a). One coder familiarized themselves with the 38 articles (Step 1) and then did the initial coding (Step 2). Using our research questions (
The original developers of RTA reject the idea of saturation and therefore also the idea of getting enough samples to attain the so-called data saturation (Braun & Clarke, 2019b). Instead, they advocate the concept of information power, which states that a small sample with relevant information is more important than a large sample with less relevant information. Our 38 articles should provide enough relevant information, as evidenced by the supplied richness in the description of the themes below.
Results
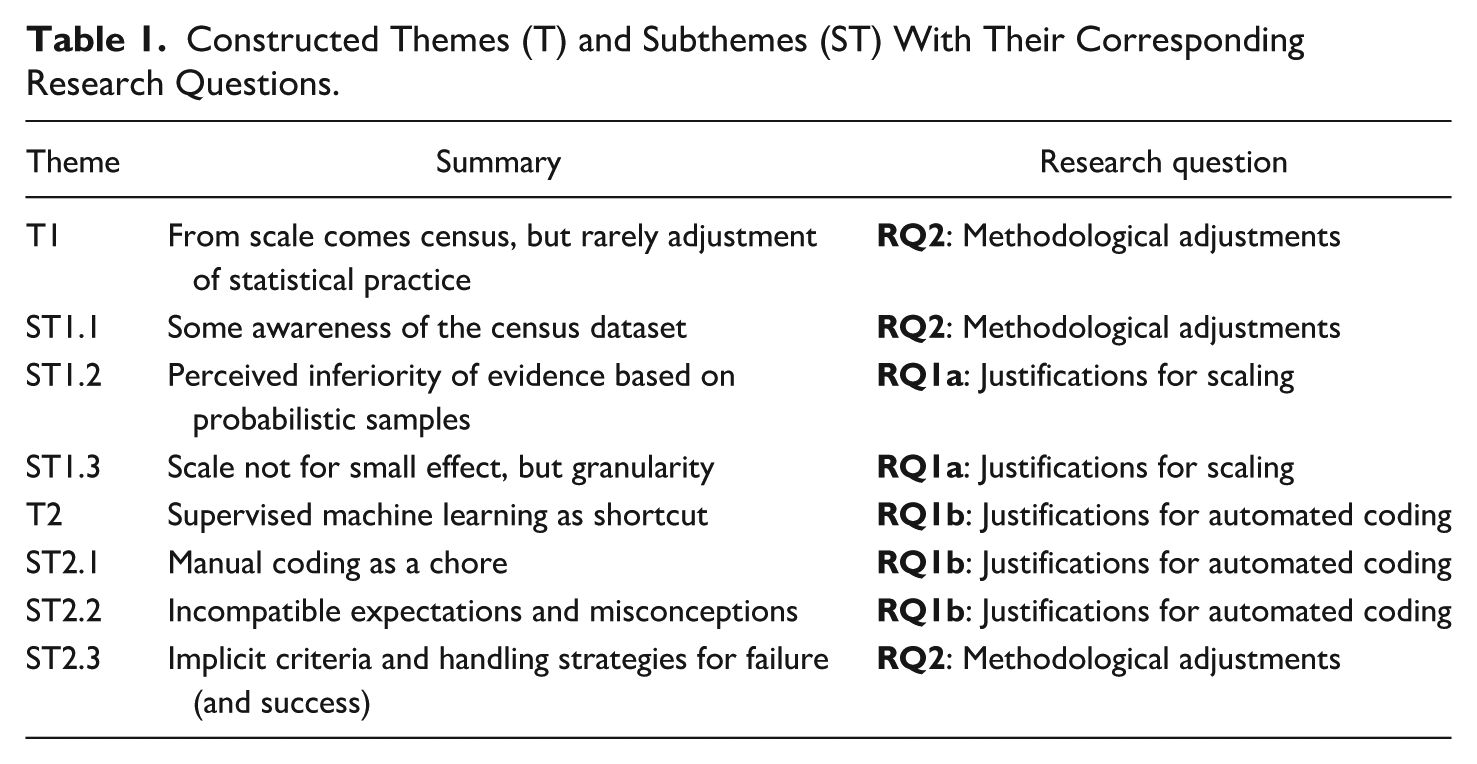
Given our research questions, we constructed two themes (Ts) and several subthemes (STs) that address the study designs of the publications together with their justifications and methodological choices. Table 1 shows a summary of the themes and subthemes, where T1 is mainly concerned with the size of datasets used in the reviewed publications alongside their statistical implications and T2 focuses on the practices surrounding SML.
Constructed Themes (T) and Subthemes (ST) With Their Corresponding Research Questions.
T1: From Scale Comes Census, But Rarely Adjustment of Statistical Practice
We identified five studies that used a form of probabilistic sampling in (parts of) their study designs (C9, C4, B0, D2, AE). Among those, C9, C4, B0, and D2 used cluster sampling. AE used random sampling only for one subset analysis. Importantly, AE contained a survey experiment, C9 and D2 were linkage analyses (linking survey and content data), and C4 and B0 were pure content analyses.
The rest of the studies, however, took a census dataset. Figure 1 shows the distribution of data sizes for the studies where data size was mentioned unambiguously. A tendency can be observed that census datasets are often larger in size compared to sample datasets. But even sample datasets are comparatively large. Even with this difference from traditional content analyses and most study designs, adjustment in statistical practice was rare. We observe several fixtures, which are the established practices of data analysis in social science. These fixtures are:
Frequentist inference, such as reporting
Use of two-sided nil hypothesis significance testing. That is, a parameter of interest is hypothesized to be different from zero,
Rare reporting of effect sizes, especially the standardized ones. Only nine reported any effect size.
Extremely rare sharing of data and code.
We would like to further expand on the last fixture. We only had access to reproducible materials for two articles (C6 and B3) and one article with incomplete data which does not allow the SML training (D2). At the same time, the description of the SML procedure in many articles was unclear. Among the 38 articles, there were 26 for which we have no doubt about how the SML procedure was done. Among the ones we have doubt, the actual size of the data, training set, or test set was obscured with imprecise language, for instance “about 100 million sentences” (D2) and “training set comprises 400–500 randomly-selected texts” (B8). Some articles reported performance metrics, but we do not know with certainty whether these metrics were calculated with a separate test set. In BE, a confusing method of validation was mentioned: “leave-one-out cross-validation (with an 80/20% train/test split),” which left us wondering whether it was leave-one-out cross-validation, a validation on a separate test set, or both. 6 These ambiguities could have been resolved with the provision of reproducible material such as the data and code. Similarly, when an article did not report any effect size, it would have been possible to recalculate it if the data (or at least summary statistics) and code were available.
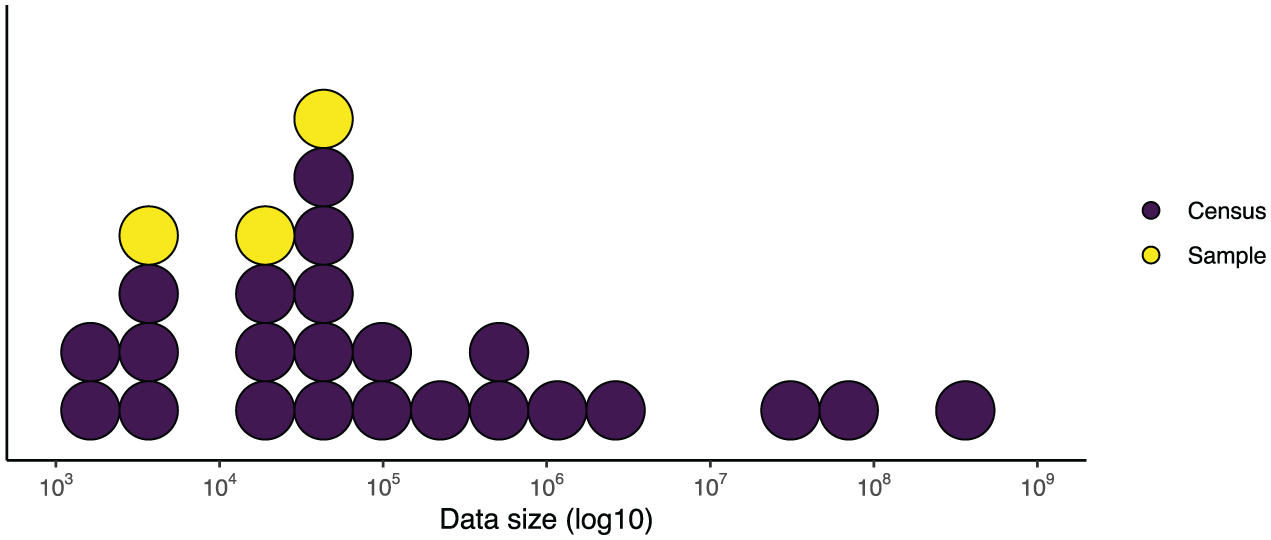
Sizes of Datasets Among the Reviewed Studies. Note That Only 26 Out of 38 Studies Were Considered Because for the Remaining 12 Studies the Data Size Could Not Be Inferred Unambiguously.
Regarding the justifications for scaling the dataset, the inferiority of evidence based on probabilistic samples is a strong perception among researchers (ST1.2). However, there are other justifications for scaling (ST1.3).
ST1.1: Some Awareness of the Census Dataset
There should be some awareness about using a census dataset among researchers. Implicitly, 13 studies presented only descriptive information and data visualization without explicitly mentioning that they analyzed a census dataset. Explicit mention of adjustment in statistical practice because of it was rare, but there were two mentions.
7
In B6, only descriptive analysis of the data was reported and stated that “[d]ue to full data analysis, no inferential statistics are needed.” In BB, the issue was acknowledged but the statistical practice remained the same as Fixture 1: We note that we have “population data.” That is, we have all of the posts from all [subjects] over the timeframe of our study. Since our data are not a sample, p-values of estimated model parameters are suspect; thus, we also report confidence intervals. (BB, actual research subjects replaced)
Although confidence intervals are more informative than reporting p values alone, this “adjustment” of reporting cannot address the issue of having a census dataset.
ST1.2: Perceived Inferiority of Evidence Based on Probabilistic Samples
The use of probabilistic samples, even labeled as “representative” in many articles, was perceived by some researchers as inferior because it was not complete data (i.e., census). The inferiority, together with the limited choices of news outlets, was thought to limit the generalizability of previous research: Most research on [a particular communication phenomenon] uses only representative samples from a small number of news outlets, limiting the generalizability of its findings. (B9, actual communication phenomenon replaced)
An advantage of SML was posited as a way to skip the “inferior” process: Conversely to the usual practice of employing human coders, we used computer-based coding. The SML was
Similarly, SML was described as the enabler of full data analysis: . . .[A]utomated coding via machine learning enabled a full data analysis of complex content-related variables. (B6)
ST1.3: Scale Not for Small Effect, But Granularity
Most studies did not provide a reason for using a large, census dataset. However, the classic statistical argument (Cohen, 1992) of detecting a small effect with enough power was not a reason in these articles. Among the ones with an explicit expression of a reason, none of them mentioned effect size (See the above Fixture 3). Similarly, we did not find any sample size determination, neither a priori nor a posteriori.
Scaling appears to be a passive process of dealing with the increasing amount of data that can be obtained easily. C7 made this point clear (we will discuss this further below in T2): SML is a relatively new technique that allows analysis of
For those that explicitly mentioned a reason for scaling, we observed one overarching methodological reason: granularity. With a systematically collected large dataset from various sources or across time, researchers can slice the data into different granularity for more sophisticated analyses. The granularity allows comparative analysis across geographical regions (D1, CB, B7) and outlets (CE, B9, CB). The most powerful, in our opinion, was to provide the granularity for dicing the data into time series to allow the study of temporal dynamics (B3, CA, BA, B5, C2, CE, D0, B8), as expressed in this quote: Machine-based content analytic methods, complementing human coders, can help capture accumulated [a particular communication phenomenon] dynamics as they change over time, and allow us to examine important subsequent questions, such as how many individual [a particular communication phenomenon] mentions in the media, over what period of time. (BA, communication phenomenon replaced)
T2: SML as Shortcut
Most of the included articles did not explicitly mention any reason for employing SML despite the potential challenges of its implementation (Zamith & Lewis, 2015). In the rare instances, where explicit reasons were given, using SML was justified by scaling up the data size (C6, CA, D0, CB) and harnessing technological advancements (C7, C3). Another common way to introduce the need for SML was to pit it against manual coding (ST2.1). SML was thought to be a means to conquer two perceived adversaries: the immediate availability of large data and the tediousness of manual coding (ST2.1). However, when SML became a shortcut to skip a huge chunk of manual coding and enable the analysis of Big Data, this external force from computer science also turned “magical” (magnificent, ubiquitous, and mysterious): Researchers might justify the use of SML with incompatible expectations or misconceptions (ST2.2). SML becomes mysterious as researchers also show inconsistencies in how to tame this external force by encountering practical challenges and often lack sufficient methodological consideration (ST2.3).
ST2.1: Manual Coding as a Chore
Manual coding was presented as a task that researchers want to get rid of. In one extreme case (C0), even when 91.27% of the content were manually coded, the remaining 8.73% were coded with SML automatically. In the same article, it says: The research also makes a significant methodological contribution, highlighting the value of automated coding efforts that can enhance or potentially even
Several articles made similar methodological claims (D1, B1). However, manual coding in previous studies was still described as theoretically better but more costly than SML (C4, C8, B7, BC). However, these costs were not made concrete, for instance: When manually coding [texts], deeper insights (though still not entirely accurate) may be extracted from the [texts] by the coders. However, a high cost in both time and effort is required. (C4, actual text type replaced)
Exception to this was C8, which puts a vague estimation of person hours and says: But as new technologies emerge and online content grows, these strategies [manual coding] are becoming unwieldy and cost prohibitive. Hand coding what could be considered a representative sample could require hundreds of hours of work. (C8)
A related issue was the methodological concern about scaling manual coding, such as the danger of code drift in previous studies: . . .[M]anually classifying thousands of documents increases the likelihood that coding becomes inconsistent and colored by a researcher’s personal expectations. (C6)
However, manual coding is still an essential part of SML: Researchers still need to code manually to produce training and testing data. Researchers took the opportunity to express their dissatisfaction with this inevitable “long and tedious process.” (C4)
ST2.2: Incompatible Expectations and Misconceptions
We identified several expectations of SML that are probably true and can certainly be achieved using SML. However, they are incompatible with the practices of academic research or the current accepted practices of computational methods. An example of this incompatible expectation is real-time analysis based on “real time social media information”: The real time social media information will be beneficial to understand the public’s perception, since the opinion information extracted from unstructured, free-text messages often reflect people’s attitudes in backstage view and can be monitored in real-time. (B4)
While it is true that one can apply SML for the real-time analysis of social media information, this is not how researchers usually do their analysis. As a matter of fact, B4 was still an analysis of a historical snapshot of data. 8
Another example of an incompatible expectation is the idea that a model that was trained with SML can be reused for future studies, making it more efficient than using manual coders: Trained and validated in this study, the classifiers can now be applied to code even larger datasets. This makes it possible to
Again, while it is true that a trained classifier can be applied elsewhere without any effort, this is not compatible with the current understanding of validity (Hosseini et al., 2017; Rauchfleisch & Kaiser, 2020; Schöpke-Gonzalez et al., 2025; van Atteveldt & Peng, 2018; Vargo, 2024). An “off-the-shelf” classifier, similar to “off-the-shelf” dictionaries, requires individual validation with respect to the data at hand. Moreover, none of the reviewed articles made their trained model publicly available for reuse. And other reviews of software and tool usage in computational communication research have shown that classifiers are rarely reused in practice, which suggests that researchers are aware of validity issues (Stecker et al., 2024). This is unfortunate, because if researchers made their models and data available, 9 SML could have the potential to enable large scale content analysis for researchers in various situations. Fostering such a sharing culture would potentially lead to more standardization of coding practices and counteract theoretical fragmentation found in journalism studies (De Grove et al., 2020).
There were also some expectations that were probably due to misconceptions about SML: . . .[A]utomated coding may help us find patterns that counter conventional wisdom, none of which would be discovered if conventional wisdom dictated the coding process. (C6)
This quote does not fit the description of SML because the generation of the training and test sets is still “dictated” by conventional wisdom. Training sets still dictate how classifiers are trained, and manually coded test sets are assumed to be the ideal (or “gold standard”) for evaluating their performance. This quote in our understanding fits better with unsupervised learning methods such as Latent Dirichlet Allocation.
Another quote shows misconception about what a test set in machine learning is: . . .[T]he algorithm uses information from texts whose [label] are assumed known (“training set”) to learn about a second set of texts whose [label] are
ST2.3: Implicit Criteria and Handling Strategies for Failure (and Success)
Despite the fact that nine articles did not mention anything on the performance of the classifier, performance tuning was mentioned in several articles (B0, CE, AF). For instance:
It turned out that the initial sample of 1000 [texts] was not enough to train a model with satisfactory performance. It was especially challenging to reach satisfactory accuracy for classifying [label]-mentioning [texts] . . . Therefore, more [texts] were manually labeled. After several rounds of iterations, a final sample of 2100 labeled [texts] were used to build a model to classify [label]. (B0, emphasis added, original text type and label replaced)
However, what exactly satisfactory performance means was not disclosed. Among the articles without any reported tuning, we observe a large variation in performance. For example, B2 and CC reported F1 scores of 0.53 and 0.47, respectively. C4 explicitly declared that the SML was a failure because the F1 values were low (e.g., 0.22, 0.36, and 0.52). Consequently, the authors decided to use the manually coded training data for their analysis. Given that the manually coded data from C4 was a representative sample, they could directly use it as such. In contrast, study CB suggested that their training set was not representative. Nonetheless, the misclassified variables were not corrected for in statistical analyses of all articles. 10
Discussion and Reflections
Rather than aiming for the identification of research gaps or the prescription of a research agenda, our goal is to reflect upon and discuss the why of scaling up content analysis and their methodological implications. We acknowledge that our study exhibits limitations such as the age of the reviewed publications as well as the focus on SML for content analysis of text data. The themes and subthemes reflect a particular moment in the field’s development, where “computational methods are becoming increasingly established in the discipline” and “fundamental concerns with epistemological parameters can be found” (Jünger et al., 2022, p. 1488). With this in mind, we also acknowledge the evolution in our field since the first wave of the Computational Turn.
The second limitation is that we only focused on studies that employed SML for content analysis of text data. We did not consider studies using SML for analyzing image or video data which have arguably become highly relevant for communication research. Video content has become ubiquitous, for example, political communication is increasingly mediated on video-centric platforms. Therefore, the analysis of video data in particular probably strongly benefits from computational methods, where the complexity of the material can be reduced with utilities such as key frame extraction or automated transcriptions.
While existing research agendas provide valuable guidance on the how of future research (e.g., Baden et al., 2021; Birkenmaier et al., 2023; Hilbert et al., 2019; Lukito & Pruden, 2023; Pouwels et al., 2023; Shah et al., 2015; Shen et al., 2024; Waldherr et al., 2024) our discussion and reflections aim to contribute by examining the fundamental why behind these methodological shifts.
With our analysis, we would like to elicit the zeitgeist of the first wave of the Computational Turn and reflect and learn from it for the second wave. This is particularly relevant, because in the first wave researchers had easy access to a large variety of data—such as social media data—that is now hard to acquire (Bruns, 2019). Moreover, modern computational methods require more computing power than ever before, which in turn requires fresh water and energy.
11
In this second wave, researchers have begun to leverage resource-hungry methods for analyzing content data for communication research (e.g., Fan et al., 2024; Joo & Steinert-Threlkeld, 2022; Kroon et al., 2023; Peng et al., 2023). We are no historians, so we quote Timothy Snyder, reflecting upon the clarity of why: When we forget the
Researchers should put the equal amount of mental energy into critically evaluating the why of scaling and automation. During the initial phase, researchers’ imagination on the why of automated coding was based, if not exclusively, on the mainstream discourse to scale up content analysis to (passively) cope with the amount of data (Günther & Quandt, 2015; Trilling & Jonkman, 2018).
Our RTA suggests several justifications, the whys, for researchers to adopt SML, as one example of an automated coding approach (ST 1.2, ST 1.3, T2, ST 2.1, ST 2.2). ST1.2 (perceived inferiority of evidence based on probabilistic samples) is particularly noteworthy, because the other side of the same coin is exactly the mythological belief of Big Data defined by boyd and Crawford (2012). Even when one supposes that the Big Data myth were correct and a larger data size alone were really an indicator of a higher form of intelligence, the answers to
We observed that the use of SML was not principled in terms of the criteria of failure (ST2.3). Meanwhile, measurement errors arising from SML were completely ignored (ST2.3). The unprincipled application of the Fixtures (ST1, the status quo) to the vastly different, upscaled, census dataset was also prevalent, although we also observed some awareness of this issue (ST1.1). The irony of these Fixtures is that most of them were established for data scarcity and apply only to relatively small probabilistic samples. This historical methodological state during the initial phase was confusing, conflicting, and even ironic. In our opinion, researchers should reflect on the why again, or else this methodological state from that period would perpetuate into the future.
As an essential step of RTA, we provide our reflexive account on our findings and our experience of getting them published. Readers can consider them to be our own PSRs on scaling and automation. From our reading of the methodological literature of our field, discussions of those points are not common, except similar points expressed by Mahrt and Scharkow (2013), De Grove et al. (2020), and TeBlunthuis et al. (2024). We punctuate all of them with a superposition of the exclamation and question punctuation marks to simultaneously opine and doubt our own opinion on behalf of the readers. Please note again the distinction between our use of researchers and the pronoun we.
PSR1: One Content Analysis‽
Krippendorff (2018, p. 384) grouped content analyses into three different classes based on their entry point: text-driven content analysis (“the availability of texts”), problem-driven content analysis (“a desire to know something currently inaccessible and the belief that a systematic reading of potentially available texts and other data could provide answers”), and method-driven content analysis (“the analysts’ desire to apply known analytical procedures to areas previously explored by other means”). This classification is important because it deals with the why of content analysis.
Because of our inclusion criteria, all 38 included articles looked like problem-driven content analyses. 12 If the entry point was epistemic questions, then one should plan how best to answer these questions. The deciding factors, ideally speaking, should not be which type of data is easily obtainable (text-driven) or by which way one can massively process the data (method-driven).
If it is the ideal, it seems that in the beginning, researchers created one content analysis. Only one. Manual coding or automated coding should only be a methodological choice that suits a study design. This point looks banal, but it puts back coding to its integral role in the entire methodological approach of content analysis and invites systems thinking about the entire research process. It also prevents what Krippendorff (2018, p. 398) said about the risk of “Law of the Instrument”: “. . .[W]hen researchers get hooked on one analytical technique, when they become experts in its use, they may well end up applying that technique to everything in sight—and not without pleasure.” 13
A subpoint is—unsurprising for this field—how one communicates about this branch of research methodology. Perhaps a healthy first step for us is to talk about “automated coding” and “manual coding” in a content analysis instead of using the terms “automated content analysis” and “manual content analysis.” The term “automated content analysis” is ambiguous and could imply that the entire research process, which includes formulation of research questions, data making, making inferences, and narration, is automated. As of this writing, we have never encountered such a technological marvel. Even when it would exist in an artificial intelligence (AI) laboratory somewhere, one should question the epistemic value of such an “automated content analysis.” Whom would it serve?
PSR2: Sampling Is More Efficient Than Automation‽
Scaling can be done by increasing the number of observations drawn from a population. Researchers look for efficiency and cost effectiveness (ST2.1), but manual coding is an inefficient chore. However, it is also an inevitable step even for automated coding. From ST2.1, researchers usually consider automated coding as a cost saving measure (cf. De Grove et al., 2020). This train of thought deserves rethinking because, in comparison to scaling and then automating coding, sampling is a more valid and efficient way to reduce costs. Using a representative sample reduces the amount of manual coding work, often resulting in a sample that is much smaller than the one needed for training an SML classifier, as attested by the mean training set size of the 38 papers: 3049.5.
The claim of sampling being valid and efficient, however, goes against the perception of inferiority of representative samples among researchers (ST1.2). This perception is unjustifiable because the difference between a census dataset and a representative sample is the sampling fraction, the proportion of members selected from a population. A census dataset is a special case of a representative sample, where the sampling fraction is 100%. Purely from a statistical viewpoint, the higher the sampling fraction, the higher the sample size for a given population; and thus, the smaller the sampling error. 14 If the sample is representative, sampling error is a random error within a predictable range (contrast this with another source of error in PSR4). This controllable, predictable error is usually not influential enough to affect the validity of a research finding. But of course, if this error is too large, it would drive us to question the validity of the finding. Krippendorff (2018, p. 366) subsumed sampling error inside the validity of a content analysis and called it sampling validity (a). 15 When the sample is representative, one can control the acceptable range of sampling error by a proper sample size planning. However, to plan a proper sample size, the often-ignored effect size (See T1 and Fixture 3) must play a stronger role.
Establishing a sampling plan is not trivial (see Cohen, 1988, 1992 for thorough treatments on power analysis). Many uncertain quantities play a role and must be considered. Nonetheless, it is worth doing
16
to avoid underpowered but also overpowered studies. Under the frequentist statistical paradigm, the sampling plan is typically fixed before the start of the study (but see Pocock, 1977). Adaptation of the sampling plan based on interim inspection of results risks inflating the Type I and II error rates (Armitage et al., 1969; Yu et al., 2014) and obtaining meaningless
To get an intuition about effect sizes and the required sample sizes to detect a certain effect, we provide a simplified example. Figure 2 displays the correlation effect size
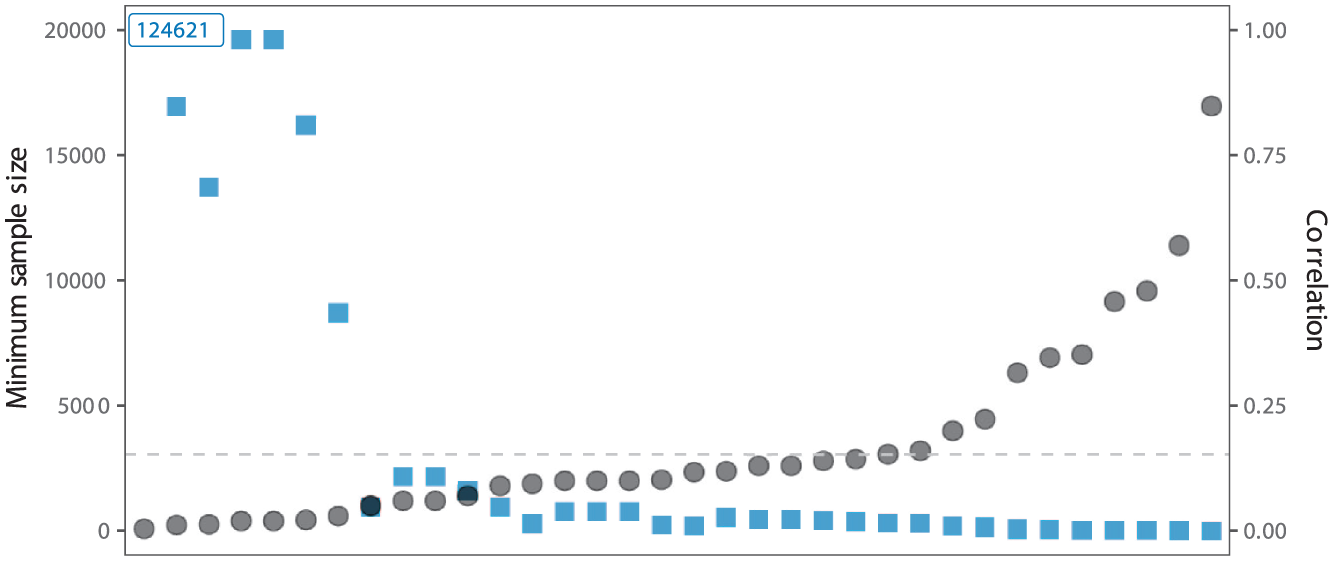
The Black Dots Display Effect Sizes in Terms of Correlation (See Right
As an alternative to frequentist statistics, one could use the Bayesian statistical framework (for introductions, see Dienes, 2011; Gelman et al., 2013; Kass & Raftery, 1995; Kruschke, 2015; Wagenmakers et al., 2018). Among several advantages of Bayesian statistics (e.g., Dienes, 2011; Wagenmakers, 2007), one that is immediately relevant for the current discussion is that Bayesian statistics allows sequential testing, so that one can monitor the data as they come in and based on the results thereof decide whether sampling should be continued or stopped (Rouder, 2014; Schönbrodt & Wagenmakers, 2018). A predefined decision criterion
18
guides the choice for continuing or stopping data collection, which could be a desired Bayes factor (evidence for one hypothesis over the other) or a width of a specified percentage,
PSR3: Let Census be Census‽
If there is really a need to conduct a census (for example, for granularity, ST1.3), one should appropriately adjust the statistical practices (ST1.2). The practice of applying frequentist statistics (e.g.,
Census should be descriptive. Regression can still be used for the estimation of effect sizes, also a descriptive action. Practical significance by evaluating the magnitude of an effect is meaningful. Statistical significance of that effect is not. For this, one can apply systems thinking (PSR1) to consider also PSR2. One can also get an effect estimate for the evaluation of practical significance more efficiently with a survey (PSR2). Therefore, we cannot think of a reason why conducting a census is methodologically necessary for the estimation of effect sizes.
PSR4: Hold Automated Coding to a Higher Standard Than Manual Coding‽
Our review raises the following questions on how one should approach automated coding vis-à-vis manual coding: Should one hold automated coding to a higher standard than manual coding? Is it fair to ask for more justifications for SML? Do we overlook limitations of manual approaches?
We hold SML to a higher standard than manual coding, because the former has more uncertainties than the latter. Although SML can be considered as a convenient extension of manual coding, it inherits all issues of manual coding and also comes with unique issues that extend beyond manual coding. The methodological literature has long been documenting the validity and reliability issues of manual coding (e.g., Krippendorff, 2018; Neuendorf, 2017). We can assume that manually coded data always have validity and reliability issues. For instance, a Krippendorff’s
Without fixing the imperfectly coded data due to validity and reliability issues of manual coding, manually coded data are used as the gold standard in automated coding. The imperfect—even erroneous—manual coding decisions were modeled computationally by a SML algorithm. The accuracy of the SML was evaluated by assuming manual coding as the “ground truth” (there is no way for F1 to exceed 1). Because of that, automated coding inherits all the errors from manual coding. Garbage in, garbage out. Up to this point, one should at least hold manual coding and automated coding on the same standard.
In ST2.2, we did not list the arguably biggest misconception among researchers about SML as a coding method for content analysis: SML-coded variables can be directly used in subsequent analyses without any consequences, whether or not the performance of the SML classifier relative to the human performance was demonstrated. All of the included 38 articles suffer from this misconception. This misconception may have arisen from the conflicts between the two cultures of statistical modeling (Breiman, 2001). In computer science, SML is assumed to be used for prediction only. How the predictions are used afterward was not a concern of computer science during the early development of machine learning. Hence, the demonstration of acceptable predictive accuracy suffices, even though we do not know what the acceptable level is (ST2.3). In the context of content analysis, however, one uses SML to create new surrogate variables and subsequently use these variables to conduct further analyses. This difference in cultures asks for different yardsticks for validity. Communication researchers should use a validity yardstick that is useful for “our culture,” that is, whether or not the classification further distorts subsequent analyses. Predictive accuracy metrics derived from a confusion matrix such as F1 are incomplete indicators of validity for communication researchers’ use case.
A unique SML validity threat is that misclassifications are seldom random, but a single value such as F1 assumes misclassifications to be random. On the contrary, misclassifications are often associated with other variables, that is, misclassifications are differential. An example of differential misclassifications is the variation across languages in SML performance relative to humans (Baden et al., 2021). If a multilingual populism classifier, for instance, classifies German content closer to human performance than Hebrew content, the misclassifications are differential because the populism variable generated with the classifier will be more “wrong” (or less human-like) for the Hebrew content than the German counterpart. In other words, the language difference (and by extension, countries where these languages are spoken, such as Austria versus Israel) causes the differential misclassifications.
Unlike the predictable sampling error arising from small sample size, differential misclassifications introduce bias, that is systematic and unpredictable before the data collection; the direction and magnitude of the bias introduced by SML depend on the causal structure of the misclassifications with all measured variables and unmeasured confounders (see also Fong & Tyler, 2021; H. Zhang, 2021). The evaluation of the complete causal structure of misclassifications is a feat that is impossible. Therefore, researchers should not be able to show that the misclassifications do not bias the results. The best they can do is to partially adjust for the biases introduced using additional manually coded data (see an overview by TeBlunthuis et al., 2024, but adjustment is not needed in the first place if the data size is not large and there is no need to automate the coding). Scaling without adjusting for differential misclassifications amplifies the biases introduced by SML and consequently generates highly precise but also highly inaccurate estimates. A Monte Carlo Simulation based on the R program from TeBlunthuis et al. (2024) is presented in Figure 3, which simulates the scaling effect of differential misclassifications with automated coding with an impressive F1 of 0.9 and idiosyncratic coding errors by humans on regression analysis (further details about the simulation can be found here: https://osf.io/a4wb6). While the observed values based on manual coding approach the expected values as the data size increases, the observed values based on automated coding become more precise but farther away from the expected values. The latter sort of scaling, in our opinion, is harmful to science. As these biases are unpredictable, we have no means to determine how the unadjusted misclassifications influenced the reported results, neither in terms of direction nor magnitude, of the included 38 articles (See Fixture 4 on missing shared data and code; if they were available, we would be able to check).
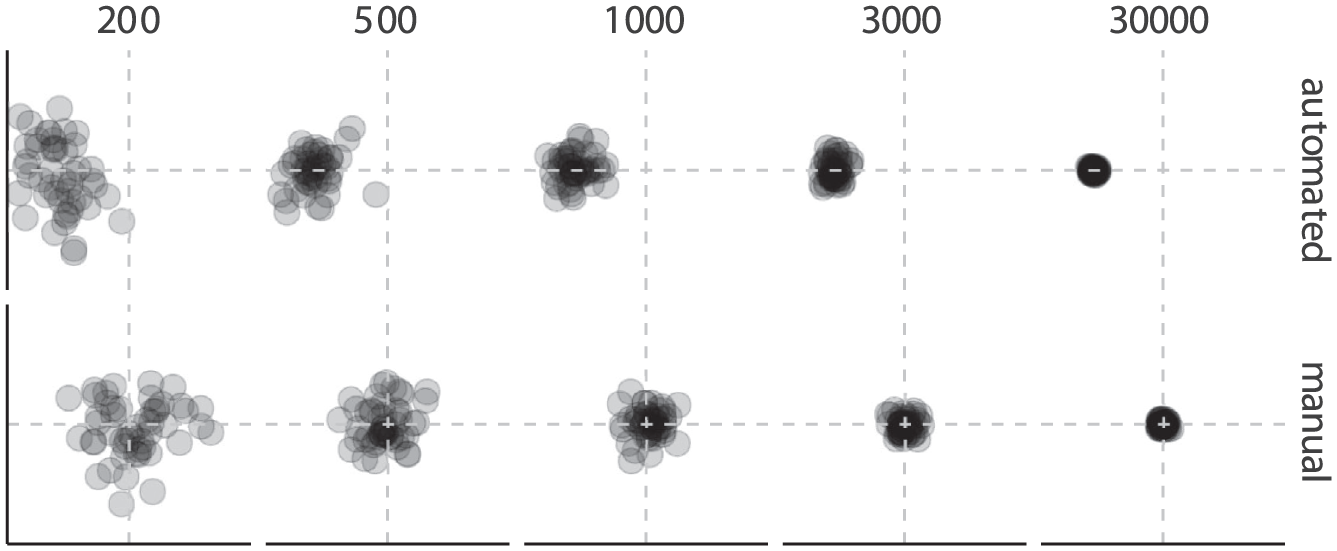
A Monte Carlo Simulation to Demonstrate the Difference in Scaling on Statistical Analysis With Misclassifications in Automated Coding (Top Row) and Scaling With Idiosyncratic Coding Errors, or Unreliability, in Manual Coding (Bottom Row); With Increasing Sample Sizes (Columns, Left to Right). In the Regression Model, the Dependent Variable Was Assumed to be Coded Either Automatically or Manually. The Performance of the Classifier Was Set to F1 of 0.90 But With Misclassifications Correlated With One Independent Variable. Manual Coders Were Set to Make Random Guesses 1/5 of the Time. There Were Two Independent Variables and Their Regression Coefficients Were Set to Zero (the Intersection Point of Two Dashed Lines) in the Simulation as the Expected Values and Plotted in the Two Axes. Each Scenario Was Based on 50 Simulation Runs. The Black Dots Display the Observed Values of the Two Regression coefficients.
In summary, automated coding inherits all problems of manual coding and introduces the unique problem of differential misclassifications. If manual coding is “wrong,” automated coding is a “wrong” made of another “wrong,” as in “two wrongs don’t make a right.” Using the principle introduced earlier, we should hold automated coding to a higher standard than manual coding.
Acknowledgments
The following R (R Core Team, 2024) packages were used for the data analysis: effectsize (Ben-Shachar et al., 2020), pwrss (Bulus, 2023), viridis (Garnier et al., 2024), tidyverse (Wickham et al., 2019), data.table (Barrett et al., 2024).
We would like to thank (Baden et al., 2021; Hase et al., 2022; Jünger et al., 2022; Song et al., 2020) for making their literature databases publicly available; TeBlunthuis et al. (2024) for consolidating these databases and providing us the list of articles. This study would not be possible without their commitments to Open Science. This study is also not possible without Professor Klaus Krippendorff (1932 - 2022)’s lifework on content analysis.
Concluding Remarks
Braun and Clarke (2019a) position RTA in the “big Q” of the “big Q/small q” dichotomy of qualitative research. Unlike the “small q” qualitative research, “big Q” qualitative research is not informed by the positivist values and practices that animate many quantitative approaches. Our work is peculiar because our mixed-method approach has an interpretivist “big Q” component, but the research object is the often positivist approach of content analysis. Our roles in interpreting the data are crucial.
We acknowledge our own position and made reflections on how that would shape the interpretation of data. We are not interchangeable coders, as assumed in the calculation of Krippendorff’s
If there is one thing we argue in this article, we argue that researchers should ask themselves why they use a certain methodological approach, be it using scaled-up large data, small historical data of only 38 papers, manual coding, automated coding, or an interpretivist qualitative approach of RTA. What justifies such a methodological approach as suitable for answering one’s research questions? This question is not related to the research topic (e.g., misinformation) or the availability of massive data (e.g., from social media APIs). The same way that physicists would not conduct a census of the
It is easy to interpret our motive as us—perhaps some methodological conservatives—being against this branch of computational methods and as us wanting to bring back the orthodoxy of the so-called “manual content analysis.” Even though using a small sample and manual coding could be a common outcome when researchers have asked themselves why, it is not our intention to “restrict” researchers to taking that route. We acknowledge the fact that methods for conducting automated coding are improving rapidly, recently due to the rise of large language models. Unless researchers discard human coding as the gold standard, it would be extremely difficult to have automated coding methods that are free of differential misclassifications (PSR4, also Figure 3). When one thinks about how to address the issues we raised, it is beneficial to consider PSR1: One should improve content analysis as a whole package, not just (automated) coding. Improving sampling strategies and statistical methods (PSR2) is in our opinion equally important—perhaps also more efficient—avenues to address the issues. We also would like to advocate for rethinking study designs for content analysis and consider the integration of qualitative methods in the workflow. It may be self-evident to most readers, but we also want to mention explicitly that using automated coding still has merits for many research questions. Higher sample sizes are needed for study designs of that require high granularity such as time-series analysis (ST1.3), comparative designs (ST1.3, Weber & Popova, 2012), 19 or causal inference (Egami et al., 2022). As is evident from this exemplary non-exhaustive list, there is a multitude of research scenarios for which a large sample is beneficiary. Even though all of these measures have their place, we argue that researchers should examine more thoroughly and systematically whether they are necessary to answer their research question.
Footnotes
Appendix A
Appendix B
Acknowledgements
Not applicable.
Declaration of Conflicting Interests
The authors declared no potential conflicts of interest with respect to the research, authorship, and/or publication of this article.
Funding
The authors received no financial support for the research, authorship, and/or publication of this article.
Ethical Approval and Informed Consent Statements
Not applicable.