
Abstract
Objective
To develop and validate a robust machine learning-based prediction model for assessing the risk of thrombotic events in critically ill cancer patients during their ICU stay.
Methods
This retrospective observational study utilized data from 1892 cancer patients in the MIMIC-IV database for model development and internal validation. A stringent data preprocessing pipeline was applied, including multiple imputation for missing data, exclusion of outliers, and the use of the Synthetic Minority Over-sampling Technique (SMOTE) to address class imbalance. Feature importance was evaluated using SHAP, leading to the selection of six key predictors. Nine machine learning models were constructed and compared. Model performance was assessed using the Area Under the Curve (AUC), F1-score, recall, Matthews correlation coefficient (MCC), accuracy, and specificity. The optimal model was selected, calibrated, and interpreted using SHAP. Its clinical utility was further evaluated via calibration curves and decision curve analysis (DCA). Finally, external validation was performed on an independent dataset of 200 patients from our institution.
Results
The CatBoost model demonstrated superior performance. In internal validation, the calibrated model achieved an AUC of 0.855 (95% CI: 0.797-0.913), with a sensitivity of 0.971 and a specificity of 0.753 at an optimal threshold of 0.245. In external validation, the model maintained strong performance with an AUC of 0.83 (95% CI: 0.742-0.918), sensitivity of 0.968, and specificity of 0.698. SHAP analysis identified “history of thrombosis” as the most influential predictor. Decision curve analysis confirmed the model's clinical utility across a wide risk threshold range (0.25-0.75). The final model was deployed as an online platform to facilitate real-time, individualized risk assessment.
Conclusion
The developed CatBoost model exhibits excellent discriminatory power, good calibration, and favorable clinical interpretability for predicting thrombosis risk in critically ill cancer patients. It serves as a promising and reliable clinical decision support tool to guide personalized thromboprophylaxis and improve patient outcomes.
Keywords
Introduction
Cancer patients, particularly those admitted to the intensive care unit (ICU) in critical condition, are at exceptionally high risk for venous thromboembolism (VTE).1,2 Within the ICU environment, this elevated risk is further amplified by cancer-related hypercoagulability, frequent invasive procedures, prolonged immobilization, and multiple comorbidities.3,4 Accurate and timely assessment of thrombotic risk in this vulnerable population is therefore essential to guide appropriate prophylactic anticoagulation and improve clinical outcomes. 5
Current clinical tools for VTE risk stratification in cancer patients—such as the Caprini, Padua, and Khorana scores—exhibit notable limitations. 6 The Caprini score is primarily validated in surgical populations and lacks generalizability to non-surgical critically ill patients ; the Padua score demonstrates suboptimal predictive performance in certain ethnic groups, including Chinese populations, likely due to genetic and epidemiological differences; while the Khorana score, although tailored for ambulatory chemotherapy recipients, relies on a static set of variables derived from limited observational data, making it insufficient to reflect the rapidly evolving physiological dynamics of ICU patients.7,8 These conventional models depend on fixed-variable frameworks and fail to leverage the rich, multidimensional, and real-time data routinely captured in ICU settings, resulting in suboptimal sensitivity and limited utility in the era of precision medicine.
In contrast, machine learning (ML) approaches offer the capacity to analyze high-dimensional datasets and model complex, nonlinear interactions among variables, thereby enabling more accurate and adaptive risk prediction in heterogeneous clinical environments.9,10 Advances in electronic health record systems and access to large-scale, open-source critical care databases—such as MIMIC-IV—have created new opportunities to develop dynamic, individualized VTE risk prediction models using ML techniques.11,12
This study therefore aimed to develop and validate an interpretable machine learning model to predict thrombosis risk specifically in ICU-admitted patients with malignant tumors.13,14 We utilized the Medical Information Mart for Intensive Care (MIMIC-IV) database to train and test multiple algorithms. 15 The Shapley Additive exPlanations (SHAP) method was employed to identify and interpret the key predictors from a comprehensive set of clinical variables, vital signs, and severity scores . Model performance was rigorously evaluated and compared using metrics including the area under the receiver operating characteristic curve (AUC) and the F1-score. Our ultimate goal was to establish an optimal, interpretable predictive tool to aid clinicians in proactive decision-making and potentially improve patient outcomes in this high-stakes clinical environment.
Methods
Study Design and Population
This retrospective, observational study was conducted utilizing the Critical Care Medical Information Marketplace IV (MIMIC-IV) (v2.2) database for predictive model development and internal validation. 15 Developed by the Computational Physiology Laboratory at the Massachusetts Institute of Technology, MIMIC-IV is an open-access resource that contains comprehensive electronic health records of ICU patients from the Beth Israel Deaconess Medical Center in the United States . The researcher, Yang Chang, underwent the necessary data access training, secured the required permissions, and extracted the relevant data.
Patients with their first ICU admission having a confirmed diagnosis of a malignant tumor (CA), as indicated by the MIMIC-IV diagnostic codes, were included in this study. The following patients were excluded from this study: (1) patients aged < 18 years at admission, (2) patients with non-first ICU admissions, (3) patients with ICU stay < 1 day, (4) patients with key variable missing rates > 50%, (5) patients with incomplete critical information on the first day of admission (eg, D-dimer, platelets, hemoglobin, white blood cell count), (6) patients with pregnancy-related or postpartum thrombosis. Ultimately, 1892 patients were included in this study.
An independent external validation was conducted using a dataset of 200 ICU patients with malignancies from Chongqing University Cancer Hospital (from December 2024 to June 2025). Inclusion criteria were a diagnosis containing “malignancy” or “cancer” and admission to the ICU for the first time, with all patients undergoing Doppler ultrasound to confirm thrombosis diagnosis. Exclusion criteria were consistent with those for the MIMIC-IV study population. This external validation set was used to assess the model's generalizability.13,16
The study was conducted in accordance with the ethical principles outlined in the Declaration of Helsinki. Use of the MIMIC-IV database was approved by the Massachusetts Institute of Technology Institutional Review Board (IRB). Use of the institutional database was approved by the Ethics Committee of Chongqing University Cancer Hospital (Approval Number: CZLS2023375-A). As all patient identifiers were removed prior to analysis, the requirement for informed consent was waived.
The primary objective of this study was to predict the risk of thrombosis in ICU patients with malignant tumors. The literature indicates that the incidence of VTE varies across patients with cancer. A study reported a VTE incidence of 3.7% in ICU patients, whereas another study noted that patients with high-risk cancer could experience VTE rates > 10%.1,8 Considering the characteristics of the study population and potential high-risk factors, a 10% event rate was adopted for the sample size estimation.2,17
To ensure the robustness of the predictive model, the sample size was estimated based on the “events per variable (EPV)” principle, using the following formula:

Substituting the values, we obtain the following:

The calculation yielded a minimum required sample size of 1600. Our final dataset of 1892 patients satisfied the criterion of EPV ≥ 20, which aligns with recommendations for predictive model development. 18
Feature Extraction and Outcome Definition
Clinical Characteristics and Data Processing
This study utilized a no-code tool (DecisionLinnc software) for data extraction and preprocessing. As a no-code tool was employed, specific preprocessing scripts cannot be provided. To ensure the reproducibility and transparency of the research results, this paper will offer the SQL query scripts used to extract data from the MIMIC-IV database in the Appendix. These query scripts will assist other researchers in replicating the data extraction process. Additionally, to further enhance reproducibility, we also provided an external validation set from our hospital for model validation. The extracted potential predictors were categorized into six groups:
Demographic details, such as race, age, sex, weight, height, and marital status Comorbid conditions, including sepsis (sepsis3,
19
respiratory, coagulation, liver, cardiovascular, central nervous system, renal), acute kidney injury stage, and history of thrombosis Laboratory measurements, such as platelet count, white blood cell count, hemoglobin and D-dimer levels, and neutrophil and lymphocyte counts Admission severity scores, including the SOFA,
20
Glasgow Coma Scale (GCS),
21
Systemic Inflammatory Response Syndrome (SIRS),
22
and APACHE II scores,
23
Simplified Pulmonary Embolism Severity Index (SPESI) score,
24
Shock index
25
Mechanical ventilation Fluid balance metrics, with all laboratory variables and severity scores obtained from initial tests or assessments conducted upon ICU admission
The overall dataset can be found in Appendix 1, and the specific SQL extraction queries are detailed in Appendix 2.
Outcome Measurement
The primary outcome measure was thrombosis occurrence. The corresponding thrombosis complication codes extracted from the MIMIC-IV database are presented. For the external validation set, the outcome was thrombosis diagnosed by Doppler ultrasound. 3
Data Preprocessing and Feature Selection
Data Preprocessing
To minimize bias and enhance model accuracy, all indicators were processed using real values, whenever possible. The DecisionLinnc software was used to preprocess the data, screen, and exclude samples with missing values from the scoring sheets. For continuous variables, multiple imputation techniques were applied to address missing data (platelet count, 0.3%; white blood cell count, 0.1%). 17 Subsequently, the dataset was divided into training and test sets at a 7:3 ratio for patients with thrombosis. Outliers in the training set were identified using the boxplot method based on quartiles and interquartile ranges (IQRs), with data points outside Q1–1.5IQR or Q3 + 1.5IQR classified as outliers . Continuous variables (eg, hemoglobin level, platelet count, white blood cell count, neutrophil count, ventilation time, fluid balance, input/output fluid volume) were filtered. Owing to the low incidence of thrombosis, class imbalance was addressed by applying the Synthetic Minority Over-sampling Technique (SMOTE) method to the training set and adjusting the ratio of patients without thrombosis to patients with thrombosis from 1125:199 to 1125:1125. The test set remained unprocessed to prevent information leakage.26,27
Predictor Selection
Following the sampling of the training set, a decision tree model based on Gini coefficient partitioning was used, and the SHapley Additive exPlanations (SHAP) method was used to rank predictor importance. 28 The model parameters were configured as follows: maximum tree depth, 5; minimum internal node sample size, 2; minimum leaf node sample size, 1; and minimum impurity reduction threshold, 0. Using the SHAP method, the influence of each variable on the model predictions was analyzed, yielding ranking results (Figure 1). This screening approach, based on model contribution, automatically filtered out variables with limited clinical predictive value or redundancy (such as some demographic variables), thereby ensuring the final model was both concise and efficient. The top six predictors accounting for > 60% of the cumulative feature importance were identified as prior thrombosis history, GCS score, shock index, SIRS score, Simplified Pulmonary Embolism Severity Index (SPESI) score, and total mechanical ventilation duration . These predictors were selected based on their dominant roles in shaping the predictive logic of the model. Furthermore, although the initial feature set included some physiological scores with potentially overlapping information (eg, SIRS, SOFA, APACHE II), the tree-based ensemble models used are inherently insensitive to multicollinearity, which further ensures the robustness of both the feature importance ranking and the final model performance.
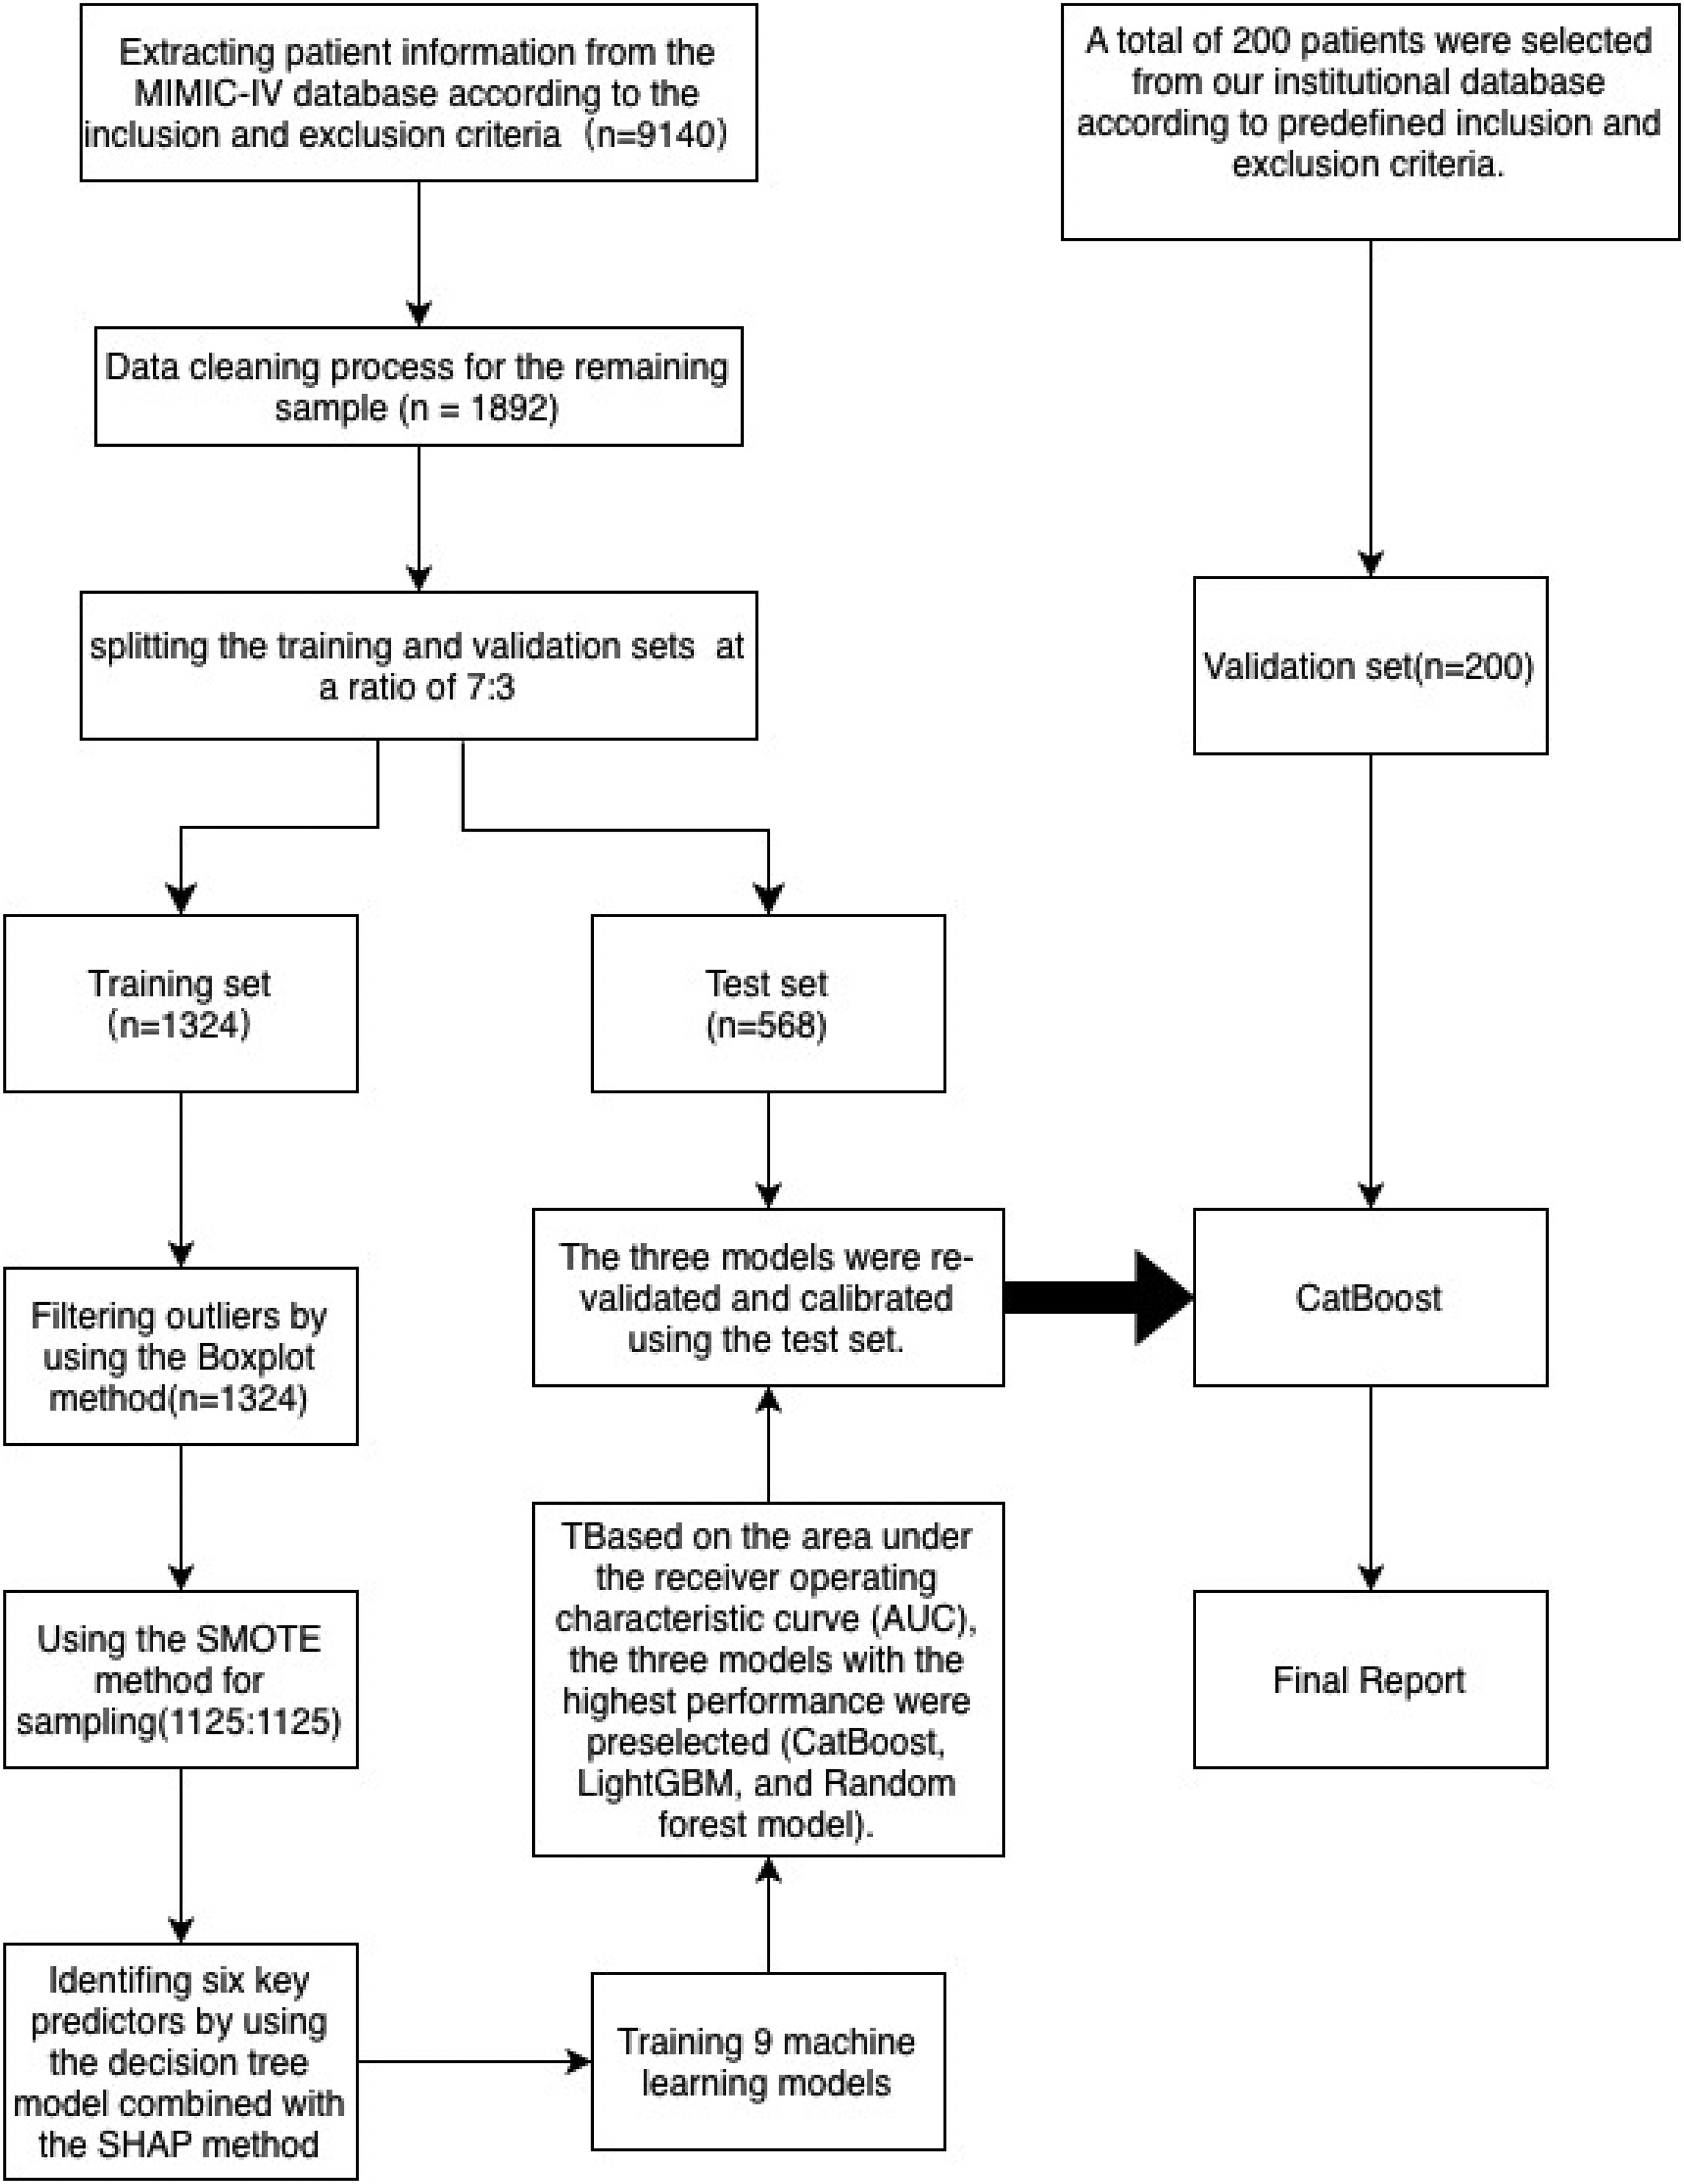
Technical roadmap.
Model Development and Evaluation
Model Development and Validation
Nine machine learning models were implemented in this study: Light Gradient-Boosting Machine (LGBM), 29 decision tree, gradient boosting tree, Extreme Gradient Boosting (XGBoost), 30 random forest (RF), 31 naive Bayes, Adaptive Boosting (AdaBoost), Categorical Boosting (CatBoost), and logistic regression classifier. The top three models, based on the AUC, were further evaluated using the bootstrap method to determine the optimal predictive model. 32
Model Performance Comparison
Multiple metrics, such as the F1-score, Matthews correlation coefficient (MCC), recall, specificity, and AUC, were used to comprehensively assess the performance and reliability of the predictive models. The F1-score reflects the harmonic mean of precision and recall, balancing the model's ability to identify positive samples and its prediction reliability. MCC provides a balanced evaluation of classification models in imbalanced datasets, whereas recall emphasizes the effective identification of positive cases to reduce missed diagnoses. 33 Specificity controls false-positive rates, minimizing misdiagnosis risks, and AUC evaluates the overall model robustness across various thresholds. Combining these metrics facilitates a thorough assessment of model accuracy and clinical applicability. Bootstrap resampling was used during model selection and performance comparison to enhance stability and reliability. 32 Confidence intervals (CIs) for key indicators, such as AUC, sensitivity, and specificity, were estimated using the bootstrap method, further strengthening the robustness and interpretability of the results. 18
Model Interpretation and Deployment
Model Interpretation
To improve model transparency, the SHAP method was introduced to quantitatively analyze the individual prediction contributions. Based on the cooperative game theory, SHAP calculates the marginal contributions across all feature combinations, ensuring consistent and locally accurate explanations of the model outputs. In clinical prediction models, SHAP reveals global feature importance and provides patient-specific insights, aiding physicians in understanding model judgment. This approach enhances model credibility and supports traceability in clinical decision-making.28,34
Web-Based Calculator
For practical clinical applications, the final optimal prediction model was integrated into a web-based platform featuring an intuitive graphical user interface. Medical staff can input patient-specific clinical variables (eg, thrombosis history, GCS score, mechanical ventilation duration) into the interface, enabling the system to automatically compute and output the predicted probability of thrombotic events. This tool enhances clinical usability and facilitates personalized risk assessment, thereby assisting physicians with targeted prevention and intervention strategies. By encapsulating complex algorithms in a user-friendly format, the transition from model development to clinical practice can be achieved effectively, thereby supporting precision medicine initiatives. 35
Statistical Learning
This study used the DecisionLinnc software for the statistical analyses. Initially, raw data were preprocessed to automatically eliminate all samples containing missing values in any row, ensuring data completeness. Following this, the baseline feature table was used to describe the fundamental characteristics of the data; continuous variables are expressed as medians and IQRs, whereas categorical variables are represented as frequencies and percentages. For grouped data, hypothesis testing was applied to assess differences between variables, with a P value < .05 indicating statistical significance. To further evaluate the balance of each variable's distribution across the groups, the standardized mean difference (SMD) was calculated. This metric is unaffected by the sample size and is appropriate for measuring the distributional differences between groups. Typically, an SMD < 0.1 suggests a balanced distribution of the variable across groups, allowing the difference to be disregarded (Table 1).
The Baseline Table of the Total Dataset, as Well as the Comparison Table of the Training Set and the Test Set.

Note: A P value less than .05 or a standardized mean difference (SMD) greater than 0.1 indicates a statistically significant difference between groups. These have been highlighted in bold in the table.
After dividing the dataset into training and test sets, the distributions of the variables in both sets were statistically compared to assess the baseline consistency. For continuous variables, the Henze–Zirkler test was initially applied to determine normality (Attachment 3); if the variables did not follow a normal distribution, the rank-sum test was used for group comparisons. The significance threshold was set at P < .05. This analytical approach has been extensively adopted in machine learning modeling studies and effectively ensures the consistency of variable distributions between the training and test sets, thereby enhancing the scientific rigor and robustness of model construction.
Outliers in the training set were detected and removed using the boxplot method (Attachment 4). To address the issue of imbalanced sample categories, the SMOTE technique was used to oversample minority classes and improve the balance of the training data. 26
For feature selection, this study integrated the decision tree model with the SHAP method to rank variable importance and ultimately identified six key predictors strongly associated with thrombosis: history of prior thrombosis, GCS score, shock index, SIRS score, SPESI score, and total duration of mechanical ventilation.
Based on these features, nine machine learning models were developed to predict the thrombosis risk, with the area under the receiver operating characteristic curve (AUROC) serving as the performance evaluation metric. Three models demonstrating superior performance were selected for the bootstrap validation phase: RF, LightGBM, and CatBoost. Finally, based on the bootstrap validation results, the performances of the models were comprehensively assessed across six dimensions: F1-score, recall, MCC, AUROC, specificity, and calibration curve, leading to the selection of CatBoost as the final clinical prediction model for this study. Additionally, the Brier Score, Hosmer–Lemeshow test, and calibration curve were calculated to evaluate the calibration performance.
Results
Sample Size
The minimum sample size required was 1600. The final total number of samples actually included was 1894 cases, meeting the EPV ≥ 20 standard, which can effectively support the development and validation of machine learning prediction models and has good generalization ability. 17 The external validation set consisted of 200 independent cases.
Dataset Description and Division
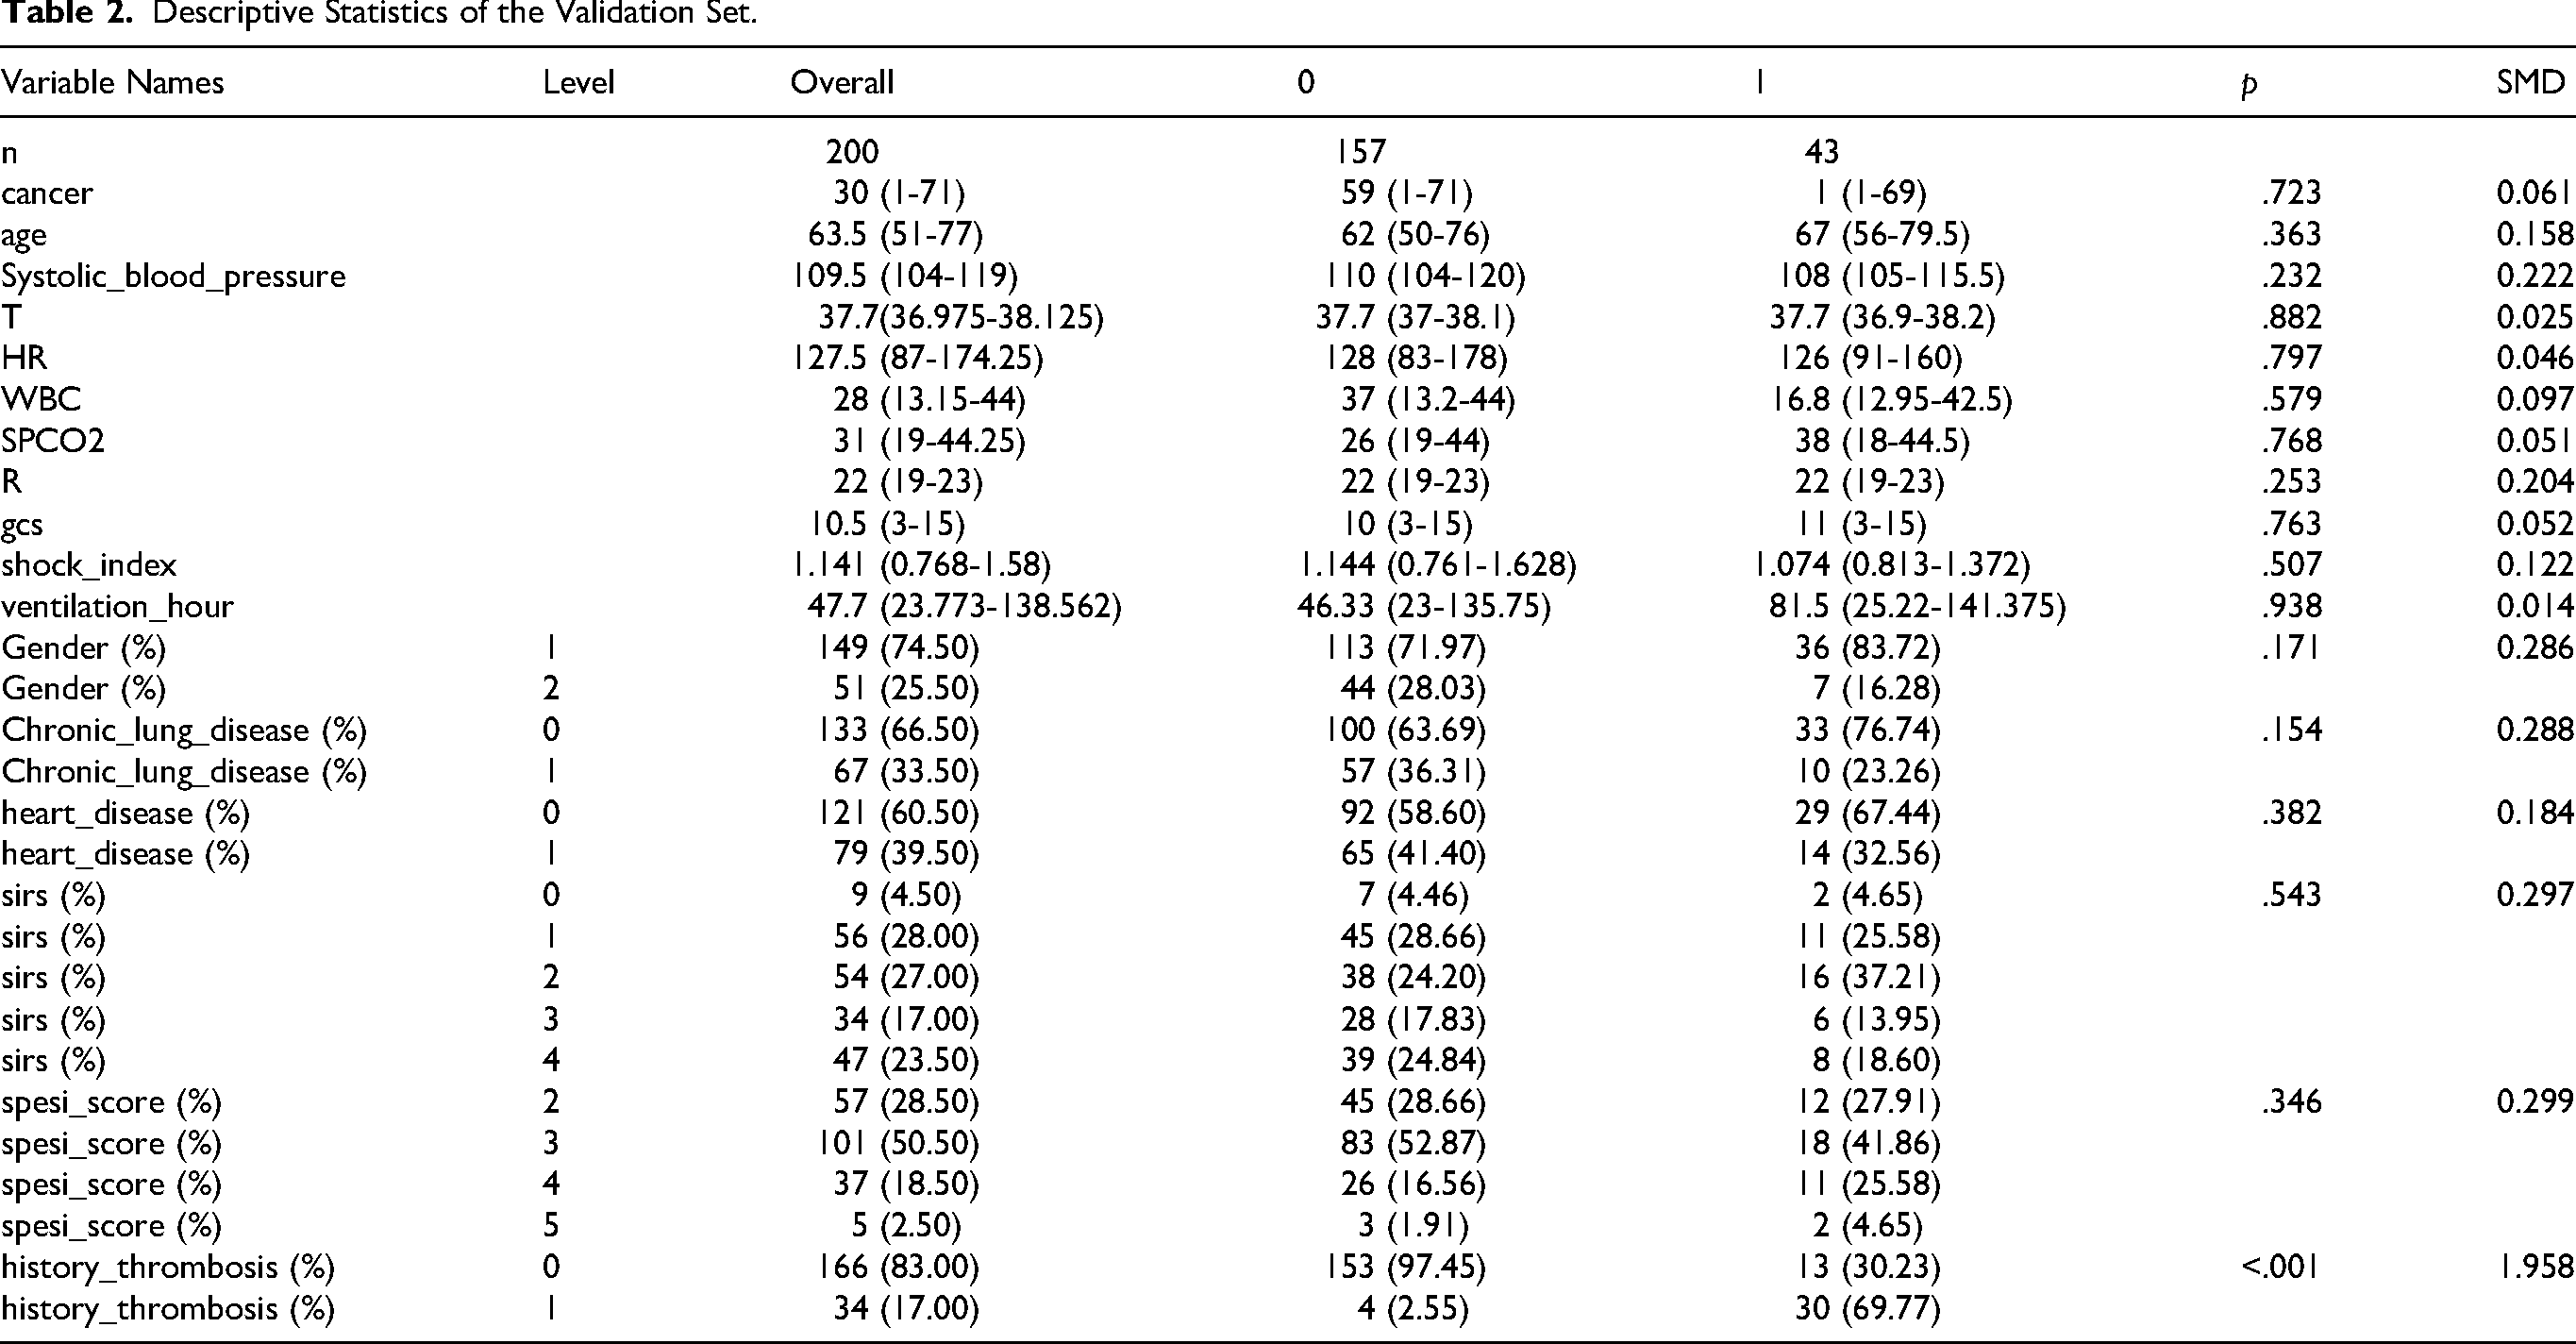
This study used the MIMIC-IV database, 15 which includes clinical data from 1892 ICU patients, to develop a machine learning dataset for predicting thrombosis events. Among these patients, 274 (14.48%) experienced thrombotic events (thrombosis = 1), whereas 1618 (85.52%) did not (thrombosis = 0). To assess the generalization capability of the model and prevent overfitting, the dataset was randomly divided into a training set (N = 1324) and a test set (N = 568) in a 7:3 ratio. The thrombotic event rates in both sets were comparable (15.03% in the training set vs 13.20% in the test set), meeting the stability criteria required for model validation. Baseline characteristics included demographic details (sex, age), clinical variables (preoperative comorbidities, laboratory indicators), and ICU scoring scales. The distribution of these variables was assessed using the SMD, with a median P > .05 or SMD < 0.1, indicating satisfactory balance among variables. 36 Predictive factors were identified using a decision tree algorithm, and variables with statistical significance but limited clinical relevance were excluded (eg, SAPS II score: 46.0 in the training set vs 43.0 in the test set, P = .00, SMD = 0.15). A detailed description of the data division process and feature selection strategy is provided in the research design framework (Figure 2), which adheres to the methodological guidelines outlined in the “Clinical Prediction Model Development Guide”. 18 The external validation set from our hospital consisted of 200 patients, with 43 (21.5%) thrombotic events. Its baseline characteristics are shown in Table 2.

Order of importance of predictive factors.
Descriptive Statistics of the Validation Set.
Comparison of Performance Parameters for Multiple Models on the Test Set.

Explanation of Predictive Factors
Prior thrombosis history: This criterion evaluates the risk of recurrent thrombotic events based on the presence of thrombosis at the time of admission. 1
Glasgow Coma Scale: A widely used to assess consciousness levels, particularly in neurological diseases, head injuries, and postoperative consciousness disorders. The scores range from 3 to 15, covering eye opening, verbal response, and motor response. Scores of 13–15 indicate mild or normal impairment, 9–12 moderate impairment, and ≤ 8 severe impairment. 21
Shock index: Calculated as the ratio of heart rate to systolic blood pressure (SBP), which assesses circulatory perfusion status. A value > 0.9 suggests potential circulatory dysfunction, whereas ≥ 1.0 is commonly associated with hemorrhagic or septic shock. 25
SIRS score: A clinical criterion for identifying systemic inflammatory responses, incorporating abnormal body temperature (> 38 °C or < 36 °C), heart rate > 90 beats/min, respiratory rate > 20 breaths/min or partial pressure of carbon dioxide < 32 mm Hg, white blood cell count > 12 000/mm3 or < 4000/mm, or immature neutrophil count > 10%. Meeting two or more criteria indicates an SIRS state, often used for the early detection of sepsis or severe infections. 22
SPESI score: A simplified tool for evaluating PE severity and predicting short-term mortality risk. Criteria include age > 80 years, cancer history, chronic heart/lung disease, SBP < 100 mm Hg, respiratory rate ≥ 30 breaths/min, heart rate ≥ 110 beats/min, and arterial oxygen saturation < 90%. A total score of 0 indicates low risk, whereas ≥ 1 indicates high risk.
Mechanical ventilation duration: The cumulative time (hours or days) for which a patient receives mechanical ventilation support is clinically significant in the intensive care setting. Extended ventilation periods are associated with increased risks of ventilator-associated pneumonia, airway injury, ICU-acquired weakness, and delirium.
Model Performance Comparison
Among the nine machine learning models compared in this study, overfitting or underfitting occurred in the training set. Therefore, the final results were based on the test set. Among them, CatBoost, LightGBM, and RF performed the best overall, with AUC values on the test set approaching 0.89, demonstrating an excellent classification discrimination ability. CatBoost, ranked first with an AUC of 0.890, was particularly suitable for handling high-dimensional categorical variables and complex data structures and possessed both high accuracy and strong robustness. LightGBM followed closely (AUC = 0.889), and because of its efficient training speed and excellent generalization performance, it has been widely applied in both industry and academia . RF (AUC = 0.886), as a classic ensemble model, also performed stably in capturing nonlinear features and preventing overfitting . Notably, although the decision tree model was the most basic, its AUC was as high as 0.881, approaching that of the mainstream ensemble models. This suggests that in the dataset of this study, there were relatively clear boundaries between variables, thereby enhancing its discrimination ability. Although logistic regression, a traditional model, has limitations in modeling nonlinear relationships, its AUC still reached 0.864, demonstrating its robustness and interpretability as a baseline model in scenarios where features are linearly separable. 37 In contrast, although both XGBoost and LightGBM are efficient gradient boosting methods, the AUC of XGBoost was slightly lower (0.885), whereas that of gradient-boosted decision tree (AUC = 0.789) had a significant gap, which might be attributed to differences in the parameter optimization strategies or underlying implementation mechanisms. Additionally, AdaBoost (AUC = 0.761) and naive Bayes (AUC = 0.787) showed relatively weak adaptability and generalization abilities in this study, indicating certain limitations in handling high-dimensional heterogeneous data (Figure 3, Table 3). Therefore, CatBoost, LightGBM, and RF, with their outstanding AUC performances and robustness, entered the bootstrap validation stage for thrombosis prediction.

Comparison of ROC curves between the training set and the test set of the 9 model.
Validation Results of the Best Model
Based on the bootstrap validation results of the three models (CatBoost, light gradient boosting machine [LGBM], and RF), a comprehensive analysis of AUC, calibration performance, and stability was performed, leading to the following conclusions. In terms of the AUC metric, LGBM performed the best, with an AUC range of 0.841–0.864 and a median value of 0.853, showing no significant abnormal fluctuations, indicating a robust model discrimination ability. Compared with the median AUC of CatBoost at 0.85 (range, 0.838-0.862), LGBM had a slight advantage. However, the median AUC of RF was only 0.799 (range, 0.786-0.812), which was significantly lower than the other two. In terms of model calibration, the calibration error decision curve analysis (DCA) value of CatBoost (0.051-0.059) was significantly lower than that of LGBM (0.057-0.071), indicating a high consistency between the predicted probabilities and the actual observed proportions. Additionally, CatBoost demonstrated a good balance between high sensitivity (0.979) and moderate specificity (0.717) at the optimal threshold (0.276), making it suitable for clinical scenarios requiring early risk warning. Although the LGBM showed the highest AUC in a single test (BR3TEST = 0.878), its performance was unstable in some test sets (eg, BR9TEST = 0.845), and it had a relatively high calibration error, which might cause the predicted probabilities to deviate from the actual observed values. RF, although it had an outstanding AUC in some test sets (BR3TEST = 0.887), had severe outliers (BR6TEST = 0.527, BR7TEST = 0.509), indicating insufficient stability. In summary, CatBoost was determined to be the core model because of its high discrimination ability, precise calibration, and good generalization performance, and its overall performance was significantly superior to that of LGBM and RF (Figure 4).

Comparison of the performance of three models.
Model Calibration
Model calibration enhances decision reliability by aligning predicted probabilities with actual observed probabilities. Prior to calibration, the Brier score of the CatBoost model was 0.054, and the calibration curve deviated from the diagonal line, indicating a systematic probability bias. Following calibration using the Platt Scaling method, the Brier score decreased to 0.053, and the calibration curve closely approximated the ideal diagonal line (Figure 5), confirming the improved probability output reliability. The Hosmer–Lemeshow test (P > .05) validated the good fit of the calibrated model, whereas the uncalibrated model failed this test, signifying inadequate calibration performance.38,39

Comparison before and after calibration, and in the validation set for CatBoost.
Although calibration did not alter the model's discrimination ability (AUC = 0.855; 95% CI, 0.797-0.913), the optimal decision threshold decreased from 0.397 to 0.245, potentially reducing the likelihood of missed high-risk diagnoses while preserving sensitivity (0.971) and specificity (0.753). DCA revealed that the calibrated model yielded a higher net benefit than conventional strategies within the risk threshold range of 0.25–0.75 (Figure 5), underscoring its clinical utility. However, the net benefit diminished in the high-threshold range (> 0.75), suggesting limited discrimination ability or a risk of overestimating probabilities in high-risk areas. 40 Such phenomena may be associated with local data sparsity or the limitations of the calibration method, emphasizing the importance of evaluating model practicality in conjunction with clinical decision thresholds to avoid masking performance deficiencies in critical intervals using global metrics.
External Validation Results
To evaluate the model's generalizability, we performed external validation using an independent dataset of 200 ICU cancer patients from our hospital. This external validation set had similar demographic and clinical characteristics but a slightly higher thrombosis incidence (21.5% vs 14.48%), reflecting real-world data diversity.
The model demonstrated good discriminative ability in the external validation set, with an AUC of 0.83 (95% confidence interval: 0.742-0.918), slightly lower than the internal validation result but still significantly better than traditional scoring systems (eg, Caprini, Padua). 8 At the optimal threshold of 0.307, the model's sensitivity was 0.968 and specificity was 0.698, indicating strong ability to identify thrombotic events, though specificity decreased, possibly due to differences in external data distribution.
The calibration curve showed good consistency between the model's predicted probabilities and actual observed probabilities, with a calibration error of 0.078 (Figure 5). Compared to internal validation, the calibration error increased slightly but remained acceptable, suggesting the model maintained good calibration performance across different institutions. Decision curve analysis (DCA) further verified the model's clinical utility: within the risk threshold range of 0.25–0.75, the model's net benefit was significantly higher than the “treat all” or “treat none” strategies (Figure 5), but net benefit decreased at high-risk thresholds (>0.75), consistent with internal validation results.
The external validation results overall support the robustness and applicability of the CatBoost model in real clinical environments, although there may be room for optimization in specificity and calibration in high-risk intervals. Future work could involve fine-tuning model parameters with multi-center data or adopting adaptive threshold strategies to improve performance.
Visualization Analysis and Clinical Decision Support
High Discriminative Power and Calibration Consistency
The CatBoost calibration model exhibited exceptional discriminative ability (AUC = 0.855; 95% CI, 0.797-0.913) in predicting thrombotic events among critically ill patients with malignant tumors, surpassing traditional scoring systems, such as Caprini, Padua, and Khorana. 7 At the optimal threshold of 0.245, the model achieved a favorable balance between sensitivity (0.971) and specificity (0.753), making it suitable for early screening applications. The calibrated predicted probabilities were closely aligned with the actual outcomes (Brier score = 0.053), and DCA confirmed the net benefit advantage within the risk threshold range of 0.245–0.75 (Figure 5). With the calibrated threshold set at 0.245, for patients with a thrombosis risk below this value, the model minimizes unnecessary interventions in low-risk populations (as indicated by DCA showing negative or negligible net benefits in this range); for those with a risk ≥ 0.245, intervention is recommended if no bleeding contraindications exist (positive DCA net benefit and higher-than-predicted actual thrombosis probability in high-risk groups). Notably, when the risk exceeds 0.75, despite the slower growth rate of the DCA net benefit, priority intervention remains essential because of the model's conservative prediction of high-risk scenarios, unless clear bleeding contraindications are present. 41
Model Interpretation Based on SHapley Additive exPlanations Plots
Global Feature Priority
The SHAP importance plot highlights that history_thrombosis (history of thrombosis) is the most influential feature (longest bar), followed by ventilation_hour (mechanical ventilation duration), which collectively drives the model's prediction of thrombosis risk (Figure 6). This aligns closely with the significant contributions of these features in the force-directed graph (Figure 7) for individual samples (eg, negative SHAP values for no history of thrombosis and reduced risk from prolonged ventilation) and their prominent distributions in the bees plot (Figure 8) at the population level (purple/yellow values representing high/low risks). Taken together, they form a coherent chain of interpretations that link global, individual, and population-level insights.

SHAP importance plot.

SHAP bees plot.
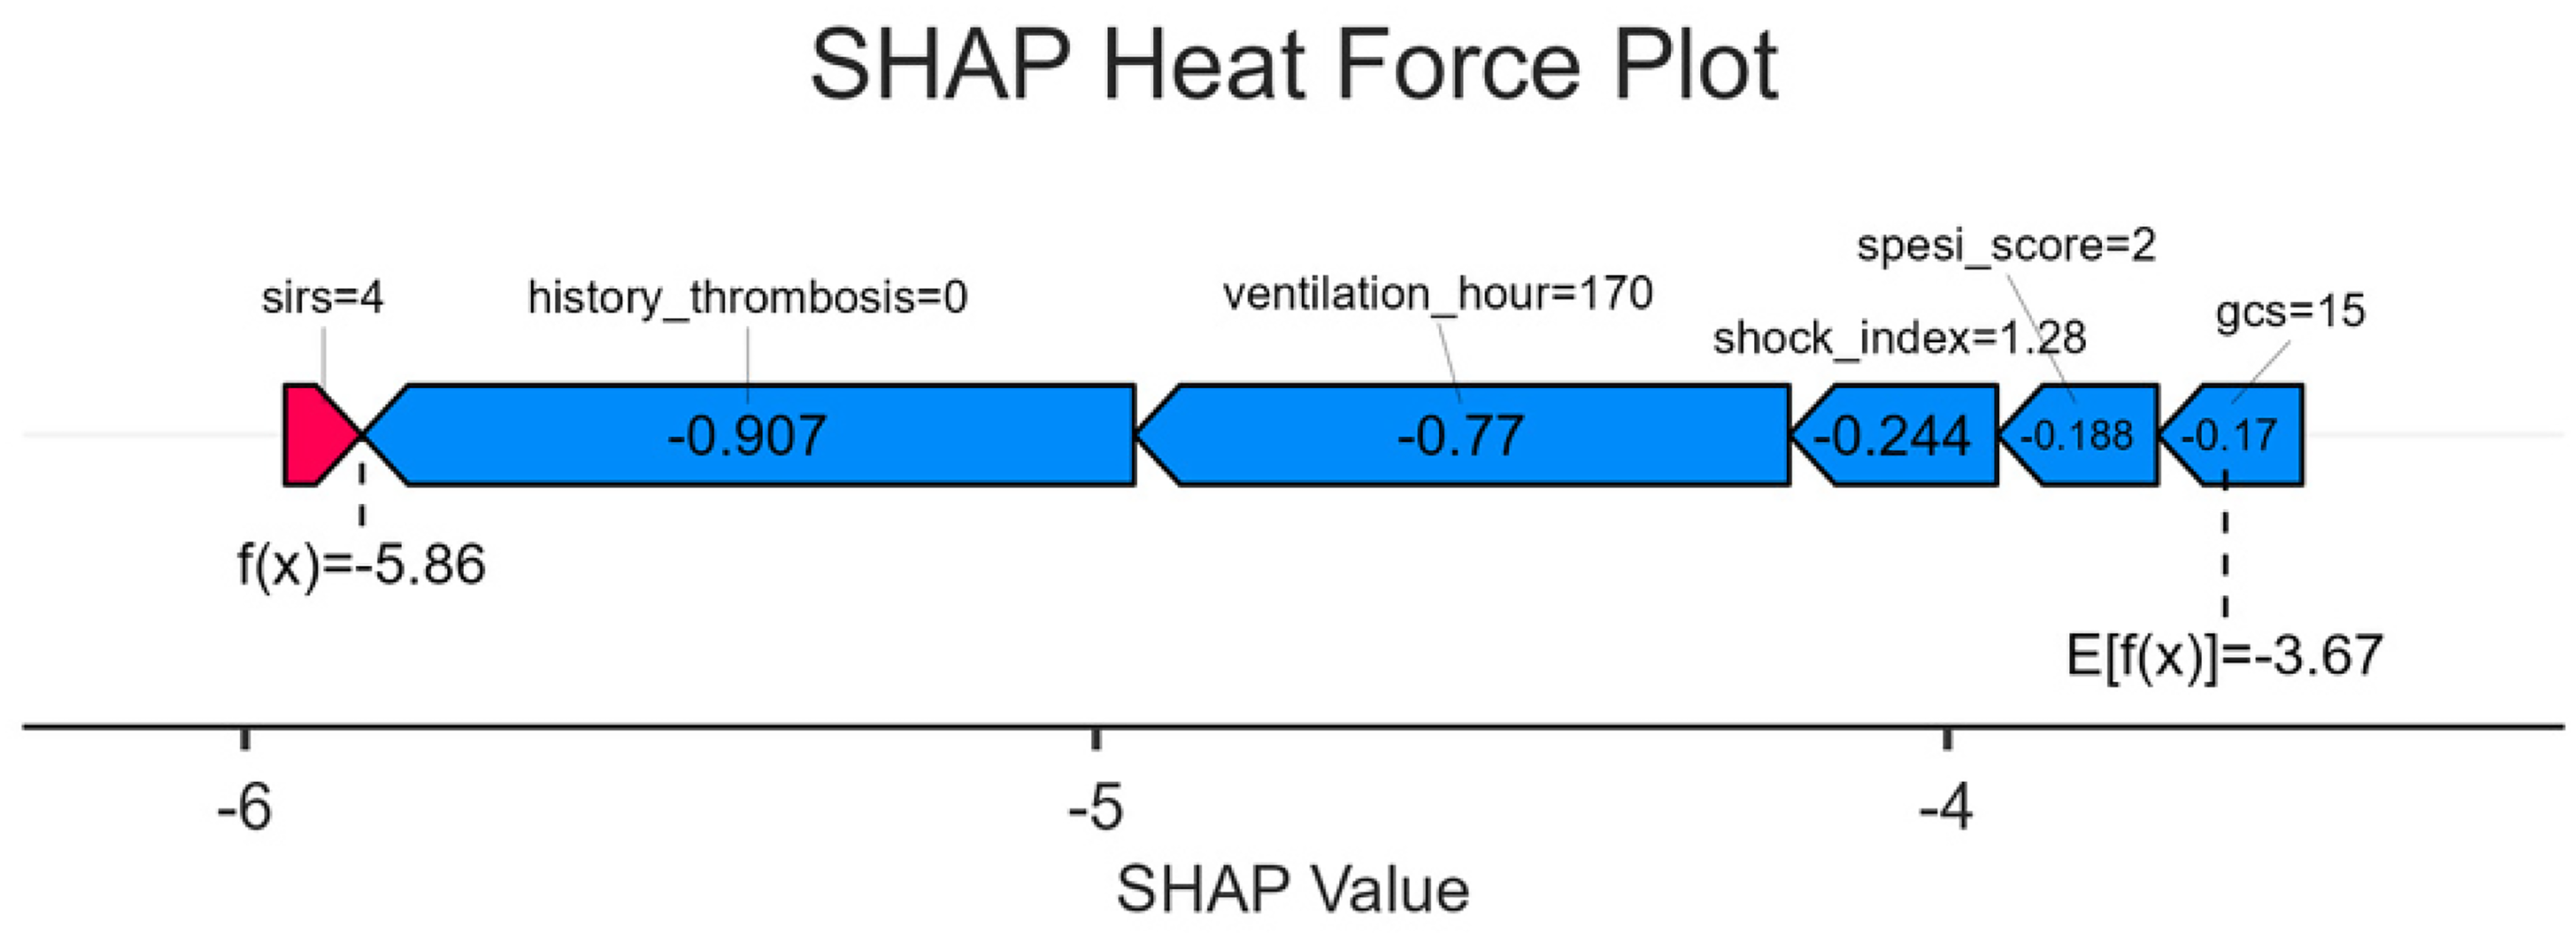
SHAP heat force plot.
Population Feature: Risk Distribution
For history_thrombosis: A positive history (purple) corresponds to a positive SHAP value (increased risk), whereas no history (yellow) results in a negative SHAP value (reduced risk), consistent with the negative contribution observed in the force-directed graph for samples without a history (eg, f[x] = –5.86 below baseline). This reinforces the population-level rule that “no history of thrombosis” serves as a low-risk marker.
For ventilation_hour: Longer ventilation times (purple) yield negative SHAP values (reduced risk), whereas shorter durations (yellow) produce positive SHAP values (increased risk). This explains the negative impact of extended ventilation observed in the force-directed graph (eg, 170 h lowering the predicted value) and underscores the need for heightened vigilance regarding thrombosis in patients with insufficient early postoperative ventilation.
Other features (eg, spesi_score, gcs): Higher scores (purple) correspond to positive SHAP values (higher risk, eg, elevated SPESI scores indicating severe PE and increased thrombosis likelihood), whereas lower scores (yellow) result in negative SHAP values (lower risk, eg, normal GCS score reflecting stable circulation and reduced risk 21 ). These findings complement single-sample analyses in force-directed graphs and elucidate feature-risk associations at the population level (Figure 7).
Individual Feature Contribution Decomposition
Using a specific sample as an example, the force-directed graph visually demonstrates how core features (history_thrombosis = 0, ventilation_hour = 170) dominate the low-risk prediction through substantial negative SHAP values (–0.907, −0.77), consistent with the yellow/leftward distribution of no history and long ventilation in the bees plot. Auxiliary features (shock_index, GCS) contributed to smaller negative adjustments, reflecting the model's comprehensive evaluation of multidimensional clinical indicators (eg, modest risk reduction associated with a shock index of 1.28, requiring clinical judgment of the complex relationship between shock and thrombosis) (Figure 8).
Model Interpretation and Clinical Application
Risk stratification:
− High risk: Presence of thrombosis history (history_thrombosis = 1), short ventilation time (ventilation_hour short, yellow value), and elevated SPESI/SIRS scores (purple value) → Intensify anticoagulation measures (eg, increase dose, shorten monitoring intervals) to prevent thrombosis recurrence or progression. − Low risk: Absence of thrombosis history (history_thrombosis = 0), prolonged ventilation (ventilation_hour long, purple value), normal consciousness (GCS score = 15, purple value), and reduced anticoagulation intensity (eg, decreased dose, extended monitoring intervals) to minimize bleeding complications.
Enhanced explainability:
The three SHAP plots progress from global feature ranking (importance plot) to group feature-risk distribution (bees plot) to individual feature contribution (force plot), enabling clinicians to clearly understand the following:
− Why a patient is considered high-risk (eg, “thrombosis history + short ventilation” → accumulation of positive SHAP values increases risk). − Why a patient is deemed low-risk (eg, “no history + long ventilation” → dominance of negative SHAP values reduces risk).
This interpretability strengthens trust in the artificial intelligence (AI) model and facilitates data-driven and precise anticoagulation strategies in clinical practice, thereby balancing treatment efficacy and safety. Through the collaborative interpretation of the three SHAP plots, the model provides an explainable thrombosis risk analysis from the global to the individual level. Core features (history, ventilation time) guide risk assessment, and auxiliary features refine predictions, offering a robust framework for clinical workflows: screening (global), group management (bees plot), and personalized decision-making (force plot). This not only validates the model's clinical utility but also integrates AI predictions with clinical expertise via visualized feature contributions, optimizing thrombosis risk management and improving patient outcomes.
Web Calculator Implementation
As shown in Figure 9, this model is embedded in a web-based application (https://fast.statsape.com/tool/detail?id = 15), where inputting the values or scores of the six predictive factors will generate the probability of thrombosis. Currently, the validity period of this model is one year.

Web calculator.
Discussion
Limitations of the Study Population and Data Source
The generalizability of our findings is constrained by the characteristics of our study population and data source. First, the model was developed and validated using data from adults (≥18 years), excluding adolescents and patients with pregnancy-associated tumors. Given the substantial differences in treatment modalities, hemodynamic profiles, and coagulation mechanisms, the VTE risk pathways in pediatric patients are fundamentally distinct from those in adults, precluding direct extrapolation. Similarly, pregnancy constitutes a high-thrombotic-risk state, which is further amplified by co-occurring malignancy. 42 Predictive modeling for these populations must incorporate their specific pathophysiological changes. Second, our reliance on the single-center MIMIC-IV database from the United States limits the racial and regional diversity of our dataset. Known racial disparities in VTE incidence and genetic predispositions—such as the higher risk observed in African Americans and the relatively lower risk in Asian populations—mean that the absence of race-specific subgroup analyses may affect model performance across different ethnic groups. 43 Therefore, future studies focusing on these specific populations and employing large-scale, multi-center, multi-ethnic datasets for external validation are essential to assess and improve the model's broad applicability. 7
Notwithstanding these limitations, this study took a critical step toward clinical translation by successfully validating the CatBoost model using an independent dataset of 200 patients from our institution. Although the sample size of the external validation set limits the precision of performance estimates—as indicated by wider confidence intervals—the 43 observed thrombotic events provide a clinically and statistically meaningful basis for evaluation. The evidence obtained supports the satisfactory discriminative ability and calibration of the model within our institutional setting, offering a pragmatic foundation for considering its local implementation. Future efforts to aggregate data across multiple centers of comparable scale will help refine performance estimates and enhance the model's broader applicability.
Model Technical Limitations and Future Development Directions
Our model possesses certain technical limitations that point to clear directions for future development. Firstly, it relies heavily on static clinical variables, such as prior thrombosis history and scores at ICU admission. While these features are critical, they fail to capture dynamic changes during the ICU stay and are prone to underreporting, limiting the model's capacity to track evolving risks. Secondly, despite including key variables, the model does not explicitly account for potential interaction effects, such as those between systemic inflammatory response (SIRS) and pulmonary embolism severity (SPESI), which may synergistically modulate thrombosis risk. The current univariate contribution modeling can underestimate the clinical significance of such interactions.
To address these limitations, future research will focus on two key methodological extensions:
Integration of Dynamic Modeling: Incorporating time-series data (eg, continuous vital signs, laboratory results) using architectures like recurrent neural networks (RNNs) or Transformers to construct a dynamic and adaptive framework for real-time risk prediction.44,45 Enhanced Interaction Modeling: Explicitly modeling interaction terms (eg, between APACHE II score and thrombosis history,
46
or between mechanical ventilation duration and shock index
47
or employing algorithms adept at capturing feature interactions, such as factorization machines, to better capture underlying clinical complexity and improve predictive power.
The adopted CatBoost framework offers a robust foundation for these enhancements, as it inherently handles complex feature interactions and nonlinear relationships while remaining robust to multicollinearity. 48 This robustness allows us to prioritize clinical relevance over strict statistical independence during feature engineering, thereby preserving potentially meaningful variables without compromising model stability. 49 Combined with post-hoc interpretability methods like SHAP, this approach ensures a balance between high predictive performance and model interpretability. 28
Generalizability of Validation and Decision Thresholds
The external validation process revealed important considerations regarding model generalizability. The external validation with 200 cases from our hospital confirmed the model's effectiveness in an independent dataset, but the slight decrease in AUC and calibration performance suggests the model might be affected by data distribution shifts or local treatment patterns. 13 This emphasizes the necessity for continuous validation and model updates in multi-center environments.
A related issue is the generalizability of the model's fixed decision threshold (0.245), which was optimized internally via the Youden index. This is evidenced by the different optimal threshold (0.307) identified during external validation. In multi-center applications, such threshold instability could impair performance due to population and procedural heterogeneity 38 Therefore, future work must employ multi-center external validation and develop adaptive thresholding methods to ensure robust clinical utility.
It is particularly important to note that the 200 patient external validation conducted for this institution is only a preliminary verification. Therefore, when applying these findings to different clinical scenarios from this study, a cautious approach should be adopted.
Clinical Translation and Concluding Outlook
The ultimate goal of this predictive model is to serve clinical practice. 50 A feasible integration path is to embed it as a plugin within the hospital's electronic medical record (EMR) system, providing automated risk calculation and decision support without significantly increasing clinical workload. However, wide adoption faces challenges, including technical integration with heterogeneous hospital information systems, the critical need to cultivate clinical doctors’ trust in the AI's decision-making logic, 10 and navigating evolving regulatory approval requirements for clinical decision support software. 10
Looking ahead, we plan to confirm the model's universality through large-scale multi-center external validation, 51 a recognized best practice for validating clinical AI. Concurrently, we will leverage explainable AI technologies like SHAP to enhance clinical understanding and trust, gradually promoting the smooth transition of this tool from research to clinical practice. 52 By integrating dynamic features and interaction effects as outlined previously, we anticipate a significant enhancement in the model's precision, clinical utility, and potential for personalized risk assessment and intervention strategies. 50
Finally, while machine learning provides the opportunity to analyze highly complex datasets and develop sophisticated models with greater predictive accuracy, it is imperative to underscore that key decisions throughout the analytical process—from study design and feature selection to model interpretation—must remain the responsibility of the researchers. This process should be guided by a strong conceptual framework and deep clinical expertise. Such a framework not only allows for a meaningful understanding of the model's findings but also ensures a clear recognition of its limitations, thereby safeguarding against the over-interpretation of results and promoting the responsible integration of artificial intelligence into clinical practice.
Conclusion
This study developed and validated a CatBoost-based machine learning model to predict thrombosis risk in critically ill cancer patients. The model exhibited high discriminative ability, favorable calibration, and clinical interpretability in both internal and external validation datasets. The results of the preliminary external validation support the model's potential real-world applicability, offering a promising tool for individualized thrombosis risk assessment. Future large-scale, multi-center studies are essential to confirm these findings and solidify the model's generalizability before broad clinical adoption.
Supplemental Material
sj-xlsx-1-cat-10.1177_10760296251408357 - Supplemental material for CatBoost Machine Learning Model for Thrombosis Risk Prediction in Critically Ill Cancer Patients: A MIMIC-IV Database Study
Supplemental material, sj-xlsx-1-cat-10.1177_10760296251408357 for CatBoost Machine Learning Model for Thrombosis Risk Prediction in Critically Ill Cancer Patients: A MIMIC-IV Database Study by Chang Yang, Hongli Ma, Xianzhang Zeng, Jing Yang, Bang Xiao, Ruyi Tan, Yuanfei Liu and Qin Zeng in Clinical and Applied Thrombosis/Hemostasis
Footnotes
Acknowledgments
We express our sincere gratitude to the team members associated with the MIMIC database for their contributions to the gathering and structuring of publicly available data. The organization providing funding played no role in any part of this research, such as planning, data acquisition, analysis of results, interpretation of findings, or preparation of the manuscript.
Ethics Approval and Consent to Participate
This study utilized the MIMIC-IV database (version 2.2), which was approved by the Institutional Review Board (IRB) of the Massachusetts Institute of Technology (MIT) (Protocol #0403000206). All data were fully de-identified, and the requirement for individual patient consent was waived by the MIT IRB in accordance with the U.S. Health Insurance Portability and Accountability Act (HIPAA) Privacy Rule.
Consent for Publication
Not applicable. This study used fully anonymized data from the MIMIC-IV database, and no individual patient identifiers were included in the manuscript.
Author Contributions
QZ: Conceptualization, investigation, writing – original draft, writing – review & editing. YFL: Data curation, methodology, writing – review & editing. CY: Data extraction, resources, writing – review & editing. HLM: Data curation, project administration, writing – original draft, writing – review & editing. XZZ: Conceptualization, methodology, supervision, validation, writing – review & editing. BX: Investigation, writing – review & editing. JY: Methodology, writing – review & editing. RYT: Investigation, writing – review & editing.
Funding
The authors disclosed receipt of the following financial support for the research, authorship, and/or publication of this article: This work was supported by the Chongqing Science and Technology and Health Joint Medical Research Youth Project, (grant number No.: 2022QNXM021).
Declaration of Conflicting Interests
The authors declared no potential conflicts of interest with respect to the research, authorship, and/or publication of this article.
Data Availability Statement
Supplemental Material
Supplemental material for this article is available online.
References
Supplementary Material
Please find the following supplemental material available below.
For Open Access articles published under a Creative Commons License, all supplemental material carries the same license as the article it is associated with.
For non-Open Access articles published, all supplemental material carries a non-exclusive license, and permission requests for re-use of supplemental material or any part of supplemental material shall be sent directly to the copyright owner as specified in the copyright notice associated with the article.