
Abstract
Deep venous thrombosis (DVT) is a leading cause of cardiovascular-related mortality, with an increasing incidence in elderly patients. However, existing risk assessment tools remain limited for this population. This study aimed to develop and validate machine learning (ML)-based models for predicting DVT risk in elderly patients. We retrospectively analyzed data from 1226 elderly patients discharged from the cardiovascular surgery department between January 2022 and December 2023. Risk factors were identified using the least absolute shrinkage and selection operator (LASSO), and seven ML models were subsequently trained on the selected features. Optimal hyperparameters for each model were selected through grid search with ten-fold cross-validation. Logistic regression (LR) and random forest (RF) demonstrated the best performance, with areas under the receiver operating characteristic curve (AUCs) of 0.835 and 0.819, respectively. SHapley Additive exPlanations (SHAP) revealed swelling, pain, albumin (ALB), and D-dimer as key predictors. These models may facilitate accurate risk stratification in elderly patients and provide clinical decision support through an interactive web-based tool.
Introduction
Deep venous thrombosis (DVT) is characterized by the abnormal formation of blood clots within the deep veins, most commonly in the lower extremities. It remains one of the leading causes of cardiovascular-related mortality worldwide.1,2 The pathophysiology of DVT aligns with Virchow's triad, involving the interplay of blood stasis, endothelial injury, and hypercoagulability. 3 A systematic review and meta-analysis indicated that the overall incidence rate of DVT is 0.809 per 1000 person-years (95% CI: 0.606-1.012). 4 Economic burden analyses showed that in the United States alone, the direct medical costs associated with DVT amounted to between $9.8 billion and $52 billion annually. 5
Among the various factors influencing the development of DVT, age is a critical determinant that cannot be overlooked. Notably, the relationship between age and DVT risk is not linear but rather exhibits an exponential increase with advancing age. 6 Epidemiological studies have revealed clear age-related stratification: the annual incidence rate increases by less than 1% in individuals under 60 years old, whereas in those over 80 years old, the annual growth rate can reach 3.73% to 4.10%.7,8 This age-related risk may be attributed to the unique physiological changes in the elderly, such as impaired venous valve function, weakened muscle pump action, and a higher prevalence of chronic comorbidities. Recent evidence from China reveals that between 2007 and 2016, the hospitalization rate for uncomplicated DVT across 90 hospitals nationwide increased from 2.0 per 100,000 to 10.5 per 100,000, representing a 425% increase. 9 This study further underscored that the proportion of hospitalized patients aged over 65 years rose sharply with advancing age, suggesting that the prevention and treatment of elderly DVT face significant challenges.
DVT, as a preventable condition, can significantly improve patient outcomes through early and precise risk stratification. 10 However, the applicability of current DVT risk prediction systems in elderly populations remains limited. Although traditional assessment scales, such as Wells and Caprini, have been widely used in clinical practice,11–13 several studies have confirmed that these tools are insufficient in influencing management decisions for hospitalized patients.14–16 More concerning is the fact that elderly individuals aged 65 and above are often excluded from the majority of key clinical trials on DVT prevention and treatment, leading to a clear age bias in the existing evidence base. In this context, there is an urgent need to develop age-specific prediction tools for elderly patients.
Although ML technologies have made progress in predicting DVT in specific clinical scenarios, such as urological surgery 17 and spinal infection surgery, 18 there are two main limitations in current research. First, many existing prediction models are based on generalized linear models, which are constrained by explicit statistical assumptions and are unable to fully capture the complex nonlinear relationships and feature interactions present in the multidimensional clinical data of elderly patients. Second, there is a lack of systematic reports on risk prediction models specifically targeting elderly populations. In contrast, ML methods like support vector machines (SVM), random forest (RF), and extreme gradient boosting (XGBoost) are better equipped to handle complex high-dimensional data and identify nonlinear patterns, thereby demonstrating higher accuracy and flexibility in DVT prediction. 19 Therefore, this study aims to develop and evaluate a robust and interpretable ML-based system for predicting the risk of DVT in elderly patients.
Methods
Study Population and Data Source
This retrospective cohort study included elderly patients (aged ≥65 years) who were discharged from the cardiovascular surgery department of Fuzhou University Affiliated Provincial Hospital between January 2022 and December 2023. DVT status was determined retrospectively based on discharge ICD diagnostic codes. Participants were selected from the hospital's big data research platform. The inclusion criteria were as follows: (1) age ≥ 65 years; and (2) availability of relatively complete clinical and laboratory examination data. Participants were excluded if they had received anticoagulant medications (eg, rivaroxaban, warfarin, or other anticoagulants) or other drugs that could affect coagulation mechanisms prior to hospitalization. All patient data were anonymized. The study received approval from the hospital's ethics committee (K2022-01-020), which waived the requirement for informed consent from patients.
Data Preprocessing and Feature Selection
The proportion of missing data for all variables was less than 20%, as detailed in Supplementary Table S1. To effectively handle these missing values, the missForest imputation algorithm was applied. This method is recognized for its robustness and can handle various types of data, including continuous and categorical variables. 20 The use of this approach allowed us to impute missing data without assuming specific distributional characteristics, thereby preserving the original structure of the dataset.
In this study, we conducted a systematic literature search and selected 47 variables for comprehensive analysis. These variables encompass a range of physiological, pathological, and biochemical indicators, including age, gender, body mass index (BMI), drinking, smoking, swelling, pain, ulceration, hypertension, diabetes, history of thrombosis, hyperlipidemia, history of tumor, history of atrial fibrillation, history of surgery, coronary heart disease, cerebral infarction, history of fracture, platelet count (PLT), white blood cell (WBC) count, basophil (B) count, red blood cell (RBC) count, hemoglobin (Hb), lymphocyte (L) percentage, eosinophil (E) count, blood urea nitrogen (BUN), uric acid (UA), alkaline phosphatase (ALP), gamma-glutamyl transferase (GGT), creatinine (Cr), direct bilirubin (DBIL), aspartate aminotransferase (AST), creatine kinase (CK), ALB, high-density lipoprotein cholesterol (HDL-C), alanine aminotransferase (ALT), apolipoprotein B:A (Apo B:A), low-density lipoprotein cholesterol (LDL-C), glucose (GLU), lactate dehydrogenase (LDH), apolipoprotein A (Apo A), total cholesterol (TC), triglycerides (TG), international normalized ratio (INR), antithrombin III (AT III), fibrinogen (FIB), and D-dimer. The diversity and comprehensiveness of these data ensure that the model can effectively capture the key features associated with the target event.
We performed univariate analysis to assess the association between the 47 features and the target event, and selected variables with significant differences. LASSO regression was then applied using the glmnet package, with alpha = 1 and family = “binomial”. During model selection, lambda.1se was used to automatically exclude redundant variables potentially arising from incidental associations and to enhance model simplicity and interpretability.
Model Development, Evaluation and Interpretation
During model development, the dataset was randomly divided into a training set and a test set at a 7:3 ratio. The training set was used for model construction and optimization, while the test set was reserved for evaluating model performance and generalizability to unseen data. A range of ML algorithms was employed, including LR, decision tree, RF, XGBoost, K-nearest neighbors (KNN), SVM, and neural network (nnet). Ten-fold cross-validation was applied for internal validation, and hyperparameters were optimized using grid search for each algorithm.
In assessing the predictive ability of the model for DVT in elderly patients, this study employed a comprehensive and complementary set of evaluation metrics, aiming for a precise analysis of model performance from multiple dimensions. These metrics included the AUC, accuracy, sensitivity, specificity, positive predictive value (PPV), and negative predictive value (NPV), along with calibration curves and decision curve analysis (DCA).
To improve the interpretability of ML models and facilitate clinical interpretation, SHAP values based on game theory were used to assess feature importance. SHAP values provide a unified measure of each feature's contribution to model predictions, with larger values indicating greater influence on the outcome. This approach helps identify key factors driving model decisions. The two best-performing models were deployed on a web-based platform using the Shiny package in R, providing clinicians with an intuitive interface for real-time predictions and supporting clinical decision-making, thereby facilitating translation into clinical practice.
Statistical Analyses
Data processing and analysis were performed using R (version 4.4.2), SPSS (version 27.0), and Zstats v1.0 (www.zstats.net). Categorical variables were presented as frequencies (percentages) and compared using the chi-squared test, continuity-corrected chi-squared test, or Fisher's exact test, as appropriate. The Kolmogorov-Smirnov test was used to assess the normality of continuous variables. Normally distributed data were expressed as mean ± standard deviation and compared using independent-samples t-tests. Non-normally distributed data were expressed as median (P25, P75) and compared using the Mann-Whitney U test. A two-sided P-value < 0.05 was considered statistically significant.
Results
Demographic and Clinical Characteristics
A total of 1226 elderly patients were divided into a training group (859 patients) and a test group (367 patients) in a 7:3 ratio (Figure 1). Statistical analysis revealed no significant differences between the two groups overall (Supplementary Table S2). The median age of the patients was 70 years, and 49.1% were male. In the training set, 29 predictive factors showed statistical differences, including swelling, pain, diabetes, history of thrombosis, cerebral infarction, history of tumor, history of surgery, history of fracture, age, WBC, RBC, Hb, L, ALP, GGT, AST, CK, ALB, Apo B:A, HDL-C, LDL-C, LDH, Apo A, TC, TG, INR, AT III, FIB, and D-dimer (Supplementary Table S3).
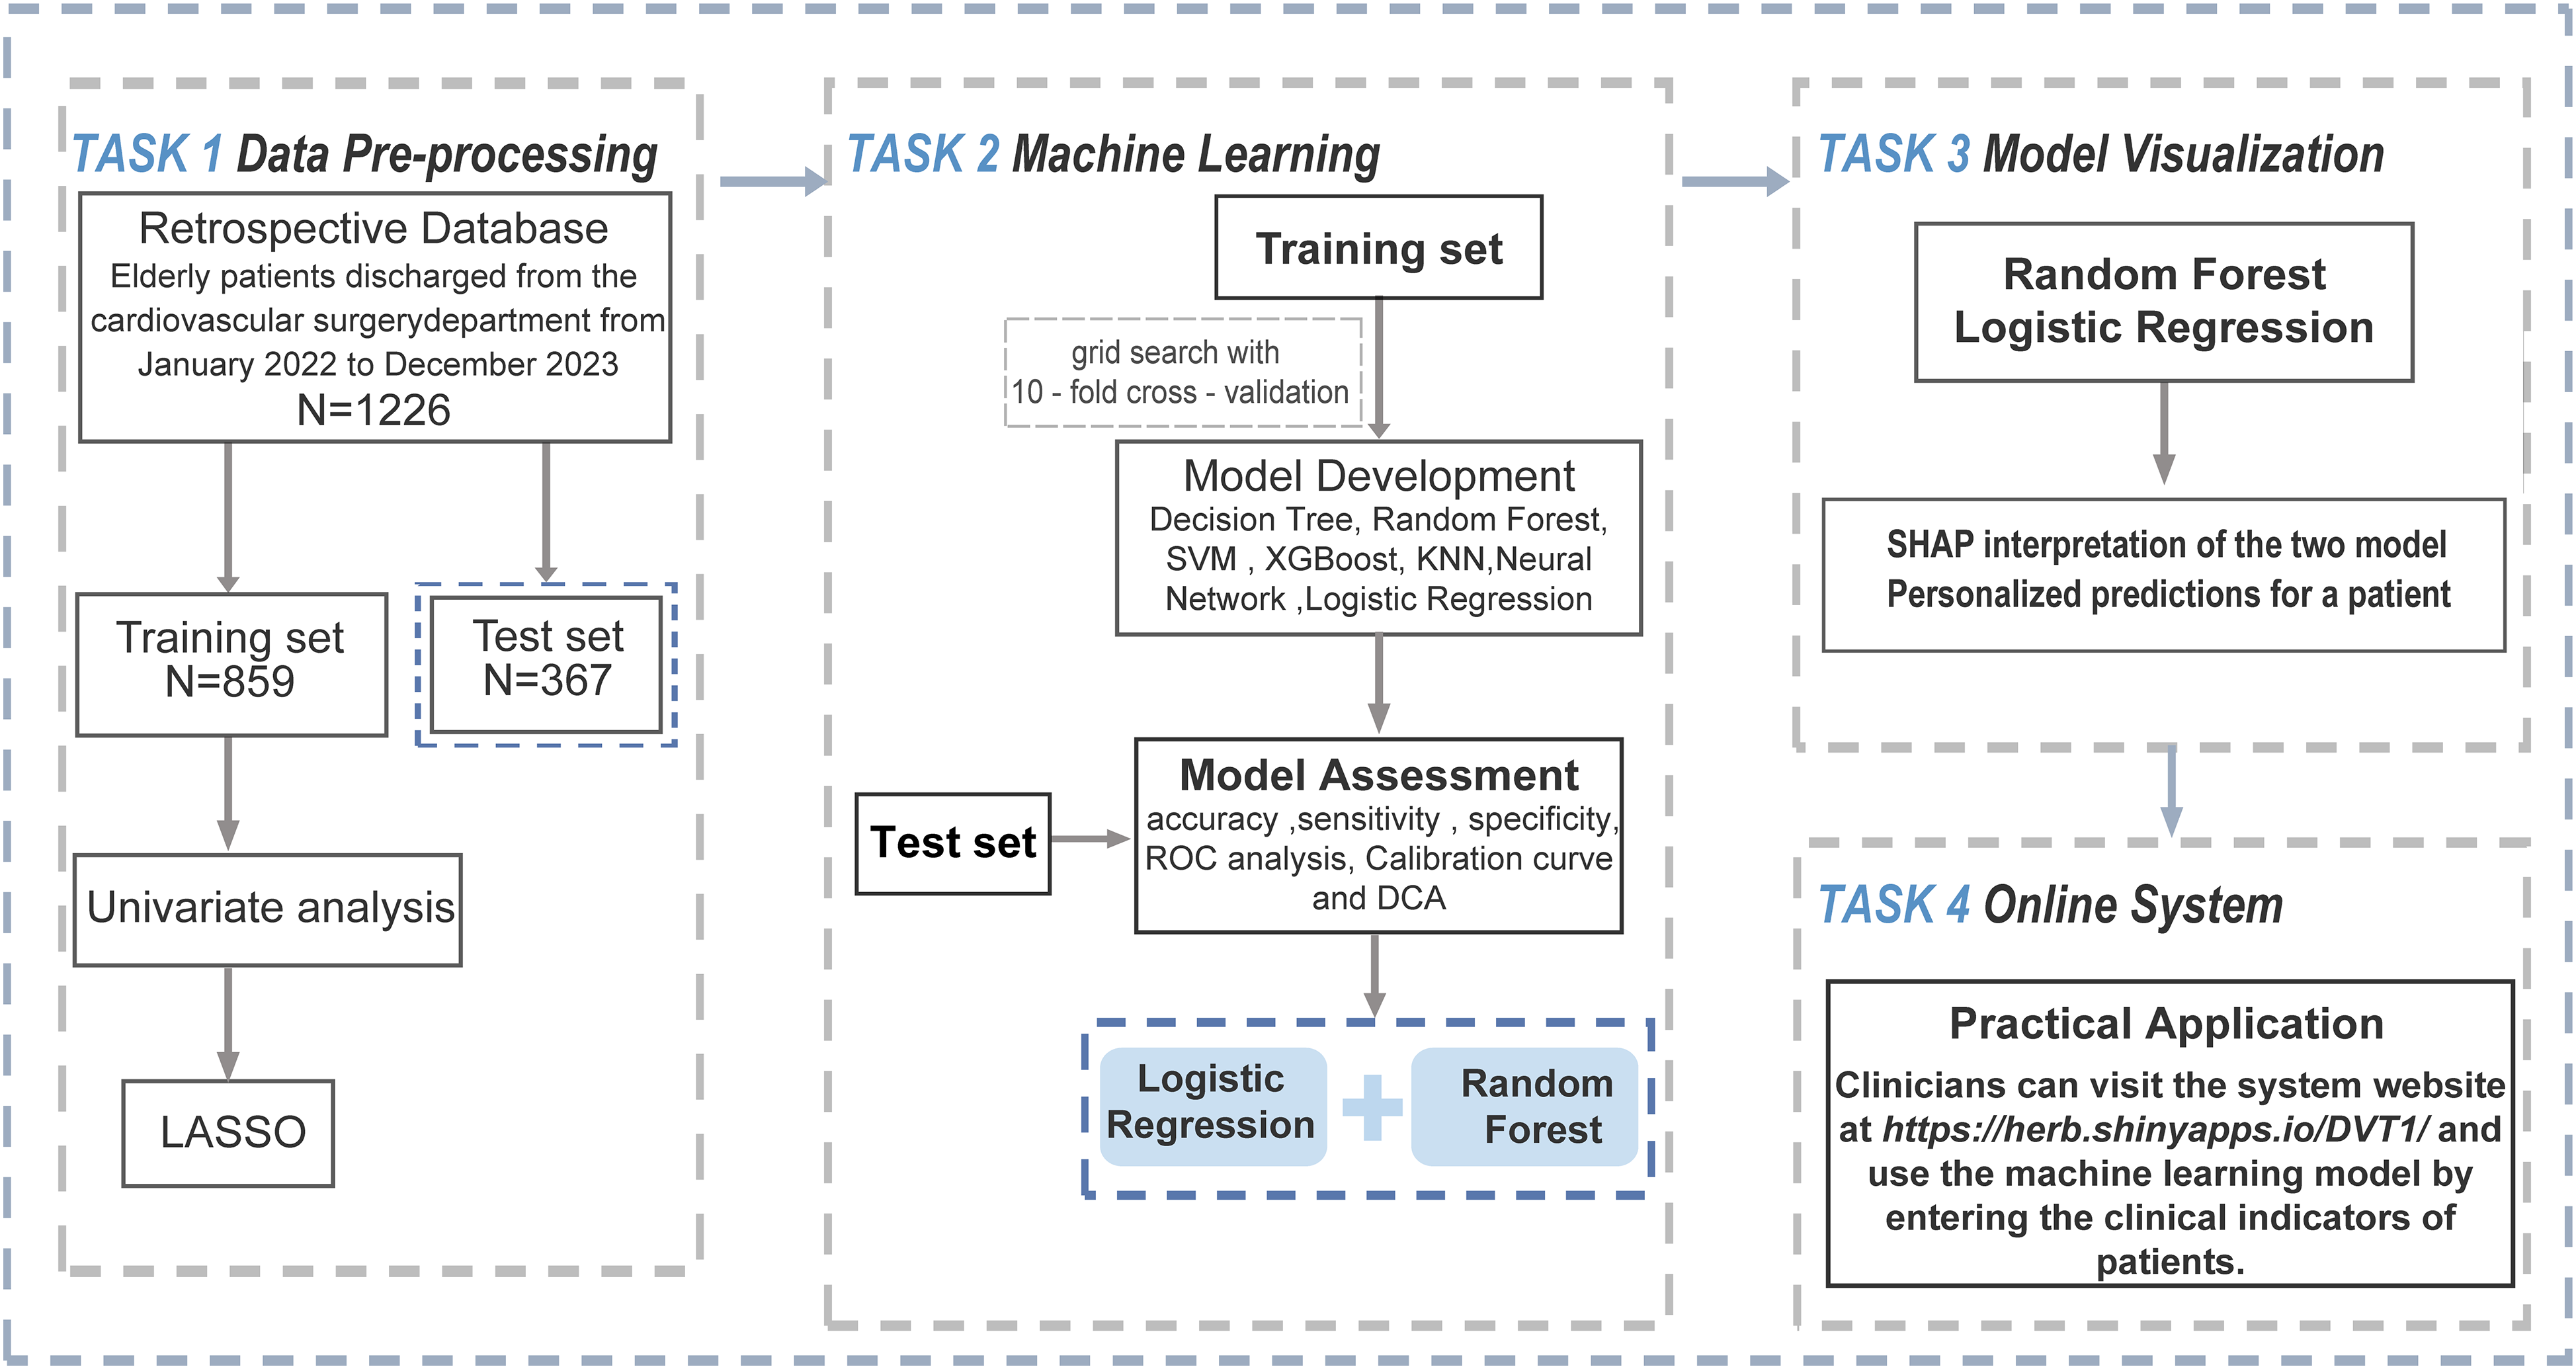
Study Flowchart.
Feature Selection
LASSO regression analysis was performed on 29 statistically significant variables, achieving optimal model sparsity at a shrinkage parameter (λ) of 0.03270. LASSO excluded irrelevant variables and retained those with significant contributions to the prediction model (Figure 2). A total of 11 key predictive factors were identified, including swelling, pain, history of thrombosis, cerebral infarction, history of tumor, history of fracture, as well as biochemical indicators such as ALP, GGT, ALB, FIB, and D-dimer. These variables served as essential predictors in model development.

LASSO Regression for Feature Selection. (a) Coefficient Path Plot of LASSO Regression; (b) Ten-fold Cross-validation Curve for Selecting the Optimal λ (λ.1se) in the LASSO Regression Model.
Performance Comparison of Multiple Models
Seven ML models were used to predict DVT in elderly patients, and ROC curves were generated to assess model performance. In the training set, the RF model achieved the highest AUC (0.932), outperforming the other models (Figure 3a). This was followed by the neural network (AUC = 0.901) and XGBoost (AUC = 0.895), both showing good predictive performance. LR (AUC = 0.851) exhibited lower performance, likely due to its linear structure, which limited its ability to capture complex nonlinear relationships. Calibration curves indicated good calibration across all models except for SVM (Figure 3b).
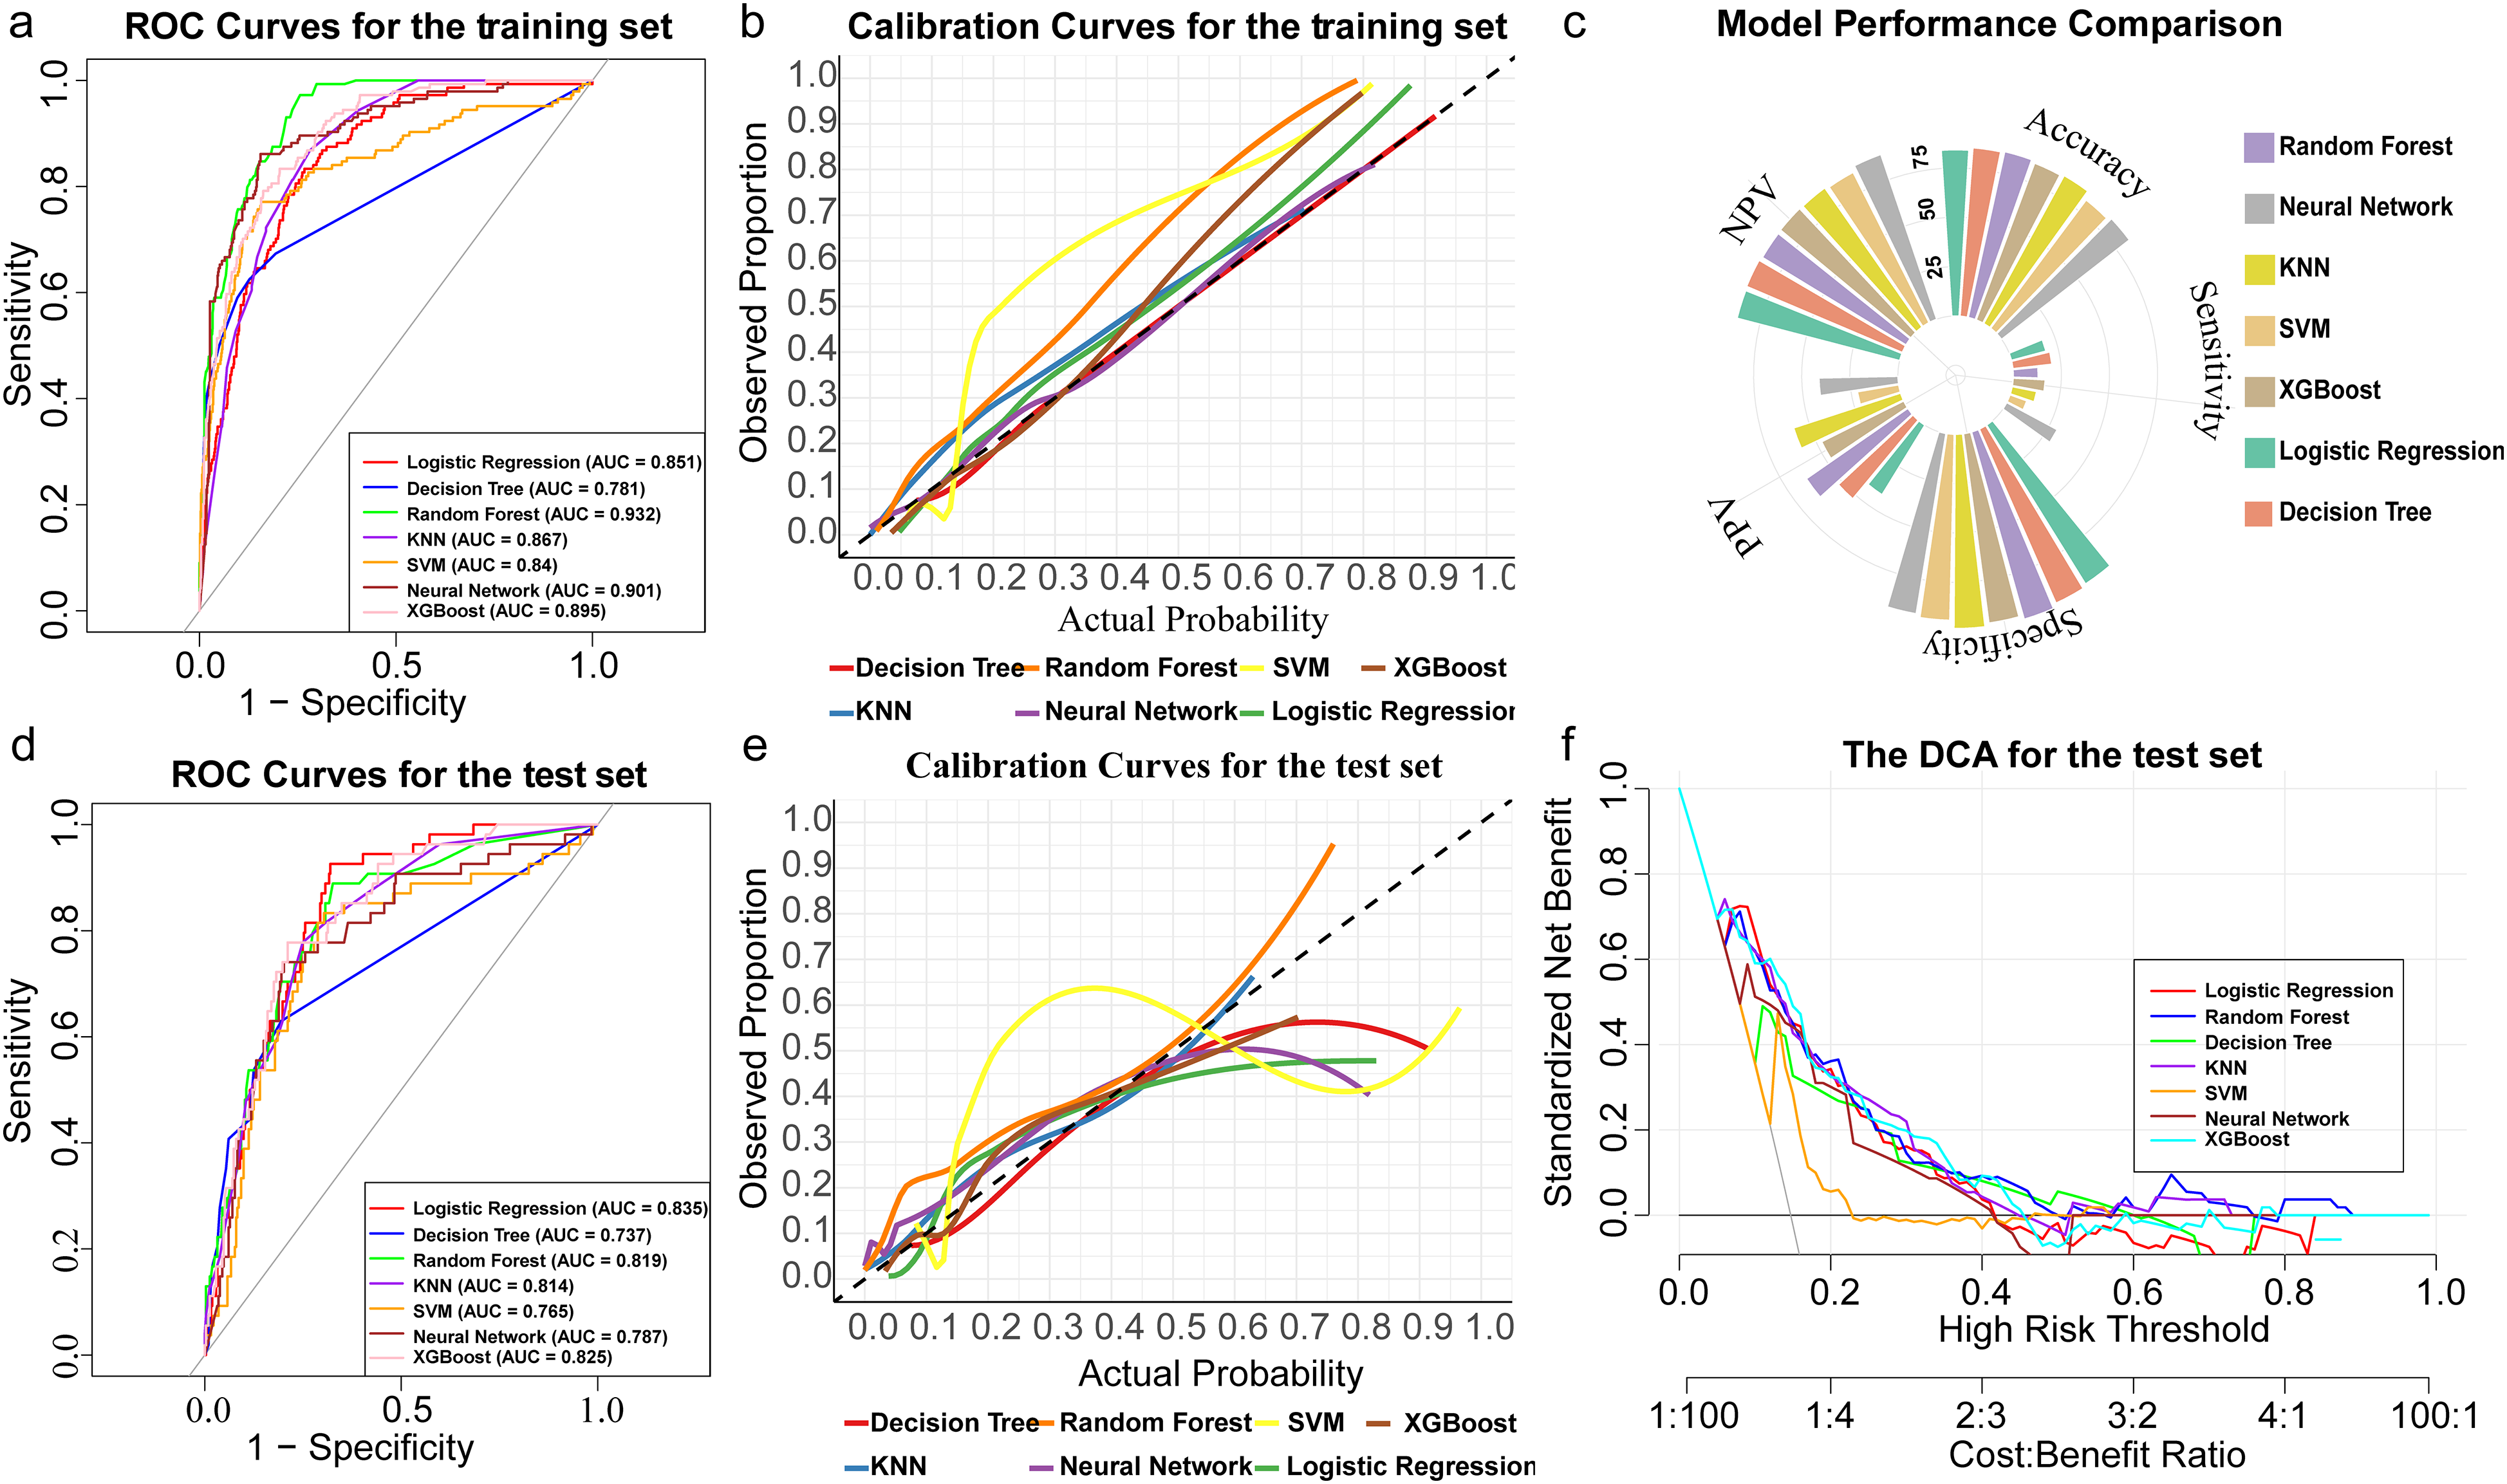
Comprehensive Performance Evaluation of ML Models for Predicting DVT Risk. (a) ROC Curves in the Training Set; (b) Calibration Curves in the Training Set; (c) Summary of Evaluation Metrics (Accuracy, Sensitivity, Specificity, PPV, NPV) in the Test Set; (d) ROC Curves in the Test Set; (e) Calibration Curves in the Test Set; (f) DCA in the Test Set.
In the test set evaluation, the RF model emerged as the optimal model, achieving the highest accuracy (0.861), specificity (0.987), and PPV (0.636) (Figure 3c), while LR exhibited strong identification ability for negative samples, with a relatively high accuracy (0.842), NPV (0.872), and specificity (0.955). Decision tree and KNN models demonstrated stable accuracy and specificity, but lacked sensitivity, while SVM performed the worst overall. The ROC curve of the test set showed that LR (AUC = 0.835), XGBoost (AUC = 0.825), and RF (AUC = 0.819) were the top three models (Figure 3d), with LR exhibiting the smallest AUC difference of only 0.026 between the training and test sets, indicating the best generalization performance. The calibration curve for the test set showed acceptable performance for all models except SVM (Figure 3e). Further cost-effectiveness analysis was conducted under different risk thresholds (Figure 3f). The results revealed that RF consistently led in terms of standardized net benefit at medium to low thresholds, with its net benefit significantly higher than other models, particularly at lower risk thresholds, demonstrating its strong generalization capability and stable predictive performance. Although LR performed well at low thresholds, its net benefit rapidly declined with increasing thresholds, indicating a reduction in predictive ability at higher risk thresholds. Taking all indicators into account, RF and LR were identified as the optimal models, both of which exhibit good predictive stability and high accuracy, making them suitable for practical clinical applications.
Model Interpretation and Web-Based Deployment
To investigate the decision-making processes of the models, we performed a detailed analysis of the results from the LR and RF models using the SHAP method (Figure 4a-b). The contribution of each feature to the occurrence of DVT was evaluated by the length of the rectangular box in the SHAP analysis plot. Swelling, pain, D-dimer, and FIB were the main influencing factors in both models. When the feature value is high, the SHAP value tends to be negative, indicating a decreased contribution to DVT prediction. For instance, low ALB values are associated with increased DVT risk, whereas other variables show a positive association between high values and DVT risk. To further clarify the decision-making process of the model at the individual level, this study conducted an interpretability analysis on two randomly selected samples (Figure 4c-d). The SHAP value visualization results of these samples intuitively show the specific contribution of each feature to the model prediction, providing a highly targeted reference basis for clinical decision-making.

SHAP-based Interpretability Analysis. (a) SHAP Summary Plot of Feature Importance in the LR Model; (b) SHAP Summary Plot of Feature Importance in the RF Model; (c) Individual-level SHAP Explanation for a Sample Predicted by the LR Model; (d) Individual-level SHAP Explanation for a Sample Predicted by the RF Model.
To further enhance clinical utility, an interactive web-based application was developed, allowing users to select between the LR and RF models (Figure 5). This platform enables healthcare professionals to input patient-specific data and obtain personalized DVT risk assessments in real time, thereby supporting more precise clinical decision-making. Users can enter data multiple times to explore risk variations under different clinical scenarios. When the predicted DVT risk exceeds 0.5, the system issues an alert with a red triangle, and the prediction area is highlighted in red for clear visual emphasis. The web application is publicly available at https://herb.shinyapps.io/DVT1/, providing a convenient tool to support clinical practice.

Web-Based Deployment of the LR and RF Models.
Discussion
In geriatric medicine, early screening, precise assessment, and effective prevention and treatment of DVT in elderly patients are essential for maintaining venous health and reducing the risk of severe complications such as pulmonary embolism. This study analyzed discharge samples from a tertiary hospital, revealing a DVT prevalence of 16.15% among elderly patients. Through analysis, 11 independent risk factors associated with DVT were identified: swelling, pain, history of thrombosis, cerebral infarction, history of tumor, history of fracture, ALP, GGT, ALB, FIB, and D-dimer. Based on these findings, LR and RF models were developed to predict DVT risk. To address clinicians’ concerns about the “black-box” nature of ML, we developed a publicly accessible web-based tool. As it operates independently of electronic medical record systems, the platform is accessible even in departments with limited information technology infrastructure and can be easily integrated into existing workflows to support routine DVT risk screening in elderly patients.
Among the 11 independent risk factors identified, several have been extensively validated in previous literature, including D-dimer, 21 ALB, 22 FIB, 23 history of thrombosis, 24 history of fractures, 25 cerebral infarction, 26 and history of tumor. 24 D-dimer, as a key marker of fibrinolytic system activation, plays a crucial role in the dynamic monitoring of DVT screening. 27 This marker not only reflects the extent of thrombotic burden, but also provides valuable guidance in excluding thrombotic diseases when the result is negative, although its nonspecific elevation remains a limitation.28,29 Cheng et al 30 demonstrated through ROC curve analysis that a combination of plasminogen activator inhibitor-1, FIB, and D-dimer exhibited an AUC of up to 0.992 in predicting post-operative DVT in patients with lower limb fractures, corroborating our findings that utilized FIB and D-dimer as key predictive markers. Moreover, research indicated a significant negative correlation between ALB levels and the aging process, 31 with a 10 g/L decrease in ALB levels associated with a 137% increase in all-cause mortality. 32 Low ALB levels might exacerbate thrombosis formation by promoting blood viscosity and endothelial dysfunction. 33 The Valeriani team, in an evidence-based study involving 2 million samples, found that hypoalbuminemia significantly increases the risk of venous thromboembolism (VTE) (relative risk = 1.88), a finding that was consistent with the cohort study by Sun et al.34,35 In this study, the ALB levels in DVT patients were lower than in non-DVT patients, further supporting the role of ALB as an important biomarker for DVT risk assessment and suggesting that low ALB levels may serve as an independent risk factor for DVT in elderly patients.
Lower limb swelling and pain were identified as independent risk factors for DVT in the elderly. Following thrombus formation, alterations in venous pressure gradients increase capillary hydrostatic pressure, promoting fluid extravasation into the interstitial space and resulting in edema. 36 Concurrently, the release of local inflammatory mediators exacerbates tissue responses, leading to the onset of pain symptoms. 37 In the clinical assessment framework, the Wells scoring system identifies a lower limb circumference difference greater than 3 cm and deep vein tenderness as core parameters. 12 Notably, predictive models for post-thrombotic syndrome (PTS) developed by research groups such as Lu 38 and Méan 39 have demonstrated a dose-response relationship between the number of DVT-related symptoms and the risk of PTS. This suggests that symptom burden might reflect the extent of thrombus dissemination and the severity of endothelial injury. Although lower limb swelling and pain exhibit high sensitivity in DVT diagnosis, their limited specificity should not be overlooked. These symptoms share significant clinical overlap with common geriatric conditions such as varicose veins 40 and diabetic peripheral neuropathy, 41 which could lead to misdiagnosis during the initial evaluation phase. Nevertheless, despite these limitations, these symptoms remain highly valuable clinical indicators as they were among the most common and quantifiable complaints from patients. Particularly in non-invasive screening, they serve as early warning signals, complementing objective markers like D-dimer to form a robust diagnostic evidence chain.
Our retrospective cohort analysis revealed that elevated ALP and GGT levels were significantly associated with DVT, consistent with findings reported by Zhu 42 and Raghu. 43 As classic biomarkers of liver function, elevated levels of ALP and GGT not only reflect liver and biliary diseases but also highlight their potential interaction with vascular endothelial dysfunction and the activation of the coagulation system.44,45 ALP disrupts the balance of vascular calcification inhibition by hydrolyzing pyrophosphate, which subsequently reduces vascular elasticity and induces hemodynamic disturbances. 46 In addition, ALP serves as a surrogate marker of systemic inflammation, demonstrating a positive correlation with inflammatory indicators such as C-reactive protein.47–49 Similarly, GGT, another liver enzyme, not only reflects hepatocellular damage but is also associated with oxidative stress. 50 GGT is involved in the degradation of extracellular glutathione and the provision of cysteine for glutathione synthesis, and its elevation appears to promote the production of reactive oxygen species, thereby contributing to oxidative stress.50,51 This mechanism shares similarities with the pathogenesis of cardiovascular diseases. 51 Reactive oxygen species play a critical role in DVT formation by influencing coagulation pathways and fibrinolysis, ultimately promoting thrombus formation.52,53
This study has several notable strengths. First, by applying multiple machine learning algorithms, we systematically evaluated their predictive performance for DVT risk in elderly patients, demonstrating the potential of data-driven approaches to improve risk stratification in this population. Through comparative analysis of seven algorithms, the random forest and logistic regression models were identified as optimal, achieving favorable performance across multiple metrics. Second, the study incorporated a broad set of clinical and laboratory variables relevant to DVT risk, thereby enhancing the comprehensiveness of the predictive model. Finally, we developed an interactive web-based tool to facilitate real-time individualized DVT risk assessment, providing a practical application to support clinical decision-making in routine care.
Despite these strengths, the study also has limitations that warrant consideration. As a single-center retrospective analysis, the patient population was relatively localized, which may introduce selection bias and limit the model's generalizability. In addition, we adopted broad inclusion criteria to capture a wide range of elderly inpatients, aiming to better reflect real-world clinical diversity. However, this heterogeneity may compromise internal comparability and introduce potential confounding factors, representing a key limitation of the study. Future research should refine the inclusion and exclusion criteria and conduct external validation using multicenter datasets to improve the model's robustness, generalizability, and clinical utility.
Conclusion
We developed and validated two ML-based models for predicting DVT risk in elderly patients and deployed them as a web-based tool to support early risk assessment and clinical decision-making.
Supplemental Material
sj-docx-1-cat-10.1177_10760296251375842 - Supplemental material for Predicting the Risk of Deep Venous Thrombosis in Elderly Patients: A Comparative Analysis of Seven Machine Learning Models
Supplemental material, sj-docx-1-cat-10.1177_10760296251375842 for Predicting the Risk of Deep Venous Thrombosis in Elderly Patients: A Comparative Analysis of Seven Machine Learning Models by Jianjie Ju, Jingjing Chen, Jingting Wang and Limei Yang in Clinical and Applied Thrombosis/Hemostasis
Footnotes
Abbreviations
Acknowledgements
The authors express their sincere gratitude to all the patients included in this study, whose participation made this research possible.
Ethical Considerations
This study was approved by the Ethics Committee of Fuzhou University Affiliated Provincial Hospital (Approval No. K2022-01-020). All patient data were anonymized and obtained from the hospital's big data research platform. Given the retrospective design and use of de-identified data, the requirement for informed consent was waived by the Ethics Committee.
Author Contributions
Jianjie Ju contributed to conceptualization, methodology, data curation, formal analysis, and drafting of the original manuscript. Jingjing Chen participated in data collection, resource management, visualization, and contributed to drafting the manuscript. Jingting Wang contributed to conceptualization, data collection, and validation. Limei Yang, as the corresponding author, provided overall supervision, funding acquisition, project administration, and was responsible for reviewing and editing the final manuscript.
Funding
The authors disclosed receipt of the following financial support for the research, authorship, and/or publication of this article: This study was supported by the Medical Quality (Evidence-Based) Management Research Project of the National Institute of Hospital Administration, National Health Commission of the People's Republic of China (Grant No. YLZLXZ24G112), and the Natural Science Foundation of Fujian Province (Grant No. 2022J011011), China.
Declaration of Conflicting Interests
The authors declared no potential conflicts of interest with respect to the research, authorship, and/or publication of this article.
Data Availability
All data will be available from the corresponding author upon reasonable request.
Supplemental Material
Supplemental material for this article is available online.
References
Supplementary Material
Please find the following supplemental material available below.
For Open Access articles published under a Creative Commons License, all supplemental material carries the same license as the article it is associated with.
For non-Open Access articles published, all supplemental material carries a non-exclusive license, and permission requests for re-use of supplemental material or any part of supplemental material shall be sent directly to the copyright owner as specified in the copyright notice associated with the article.