
Abstract
Background
The lactate-to-albumin ratio (LAR) has prognostic value in various clinical conditions, but its association with mortality in pulmonary embolism (PE) remains unclear. This study aims to investigate the relationship between LAR and 28-day all-cause mortality in PE patients.
Methods
This retrospective observational study used MIMIC-IV database, with 28-day mortality as the primary endpoint. Adjusted Cox models were used to assessed the LAR-mortality association, with subgroup analyses for stability. Kaplan-Meier curves estimated mortality across LAR tertiles. Restricted cubic spline(RCS) analysis evaluated nonlinearity. Receiver operating characteristic curves(ROC) and reclassification metrics were used to compare the predictive performance of LAR with the Pulmonary Embolism Severity Index (PESI).
Results
Among the 319 included patients, 72 (22.6%) died within 28 days of admission. Non-survivors had significantly higher LAR levels. In adjusted Cox models, elevated LAR was independently associated with increased 28-day mortality risk. Kaplan-Meier curves showed significant survival differences across LAR tertiles. RCS analysis revealed a dose-response relationship with an inflection point around LAR 0.67. The ROC curve's C-statistic, validated by the DeLong test, highlights the superior performance of the LAR model, while the positive Integrated Discrimination Improvement and Net Reclassification Improvement values demonstrate its additional prognostic value over the PESI model. Subgroup analysis confirmed consistent findings across different patient groups.
Conclusion
Elevated LAR was positively correlated with 28-day all-cause mortality in PE patients, maintaining prognostic value across subgroups. LAR showed potential as a practical prognostic indicator for PE risk stratification, warranting prospective validation and exploration of its clinical utility in PE management.
Introduction
Pulmonary embolism (PE), the third leading cause of cardiovascular death, is often regarded as a critical medical emergency. 1 Statistics show that there are approximately 39 to 115 new cases of PE per 100,000 people each year. 2 Although the overall mortality rate is declining, the mortality rate for high-risk PE patients with hemodynamic instability remains as high as 14%.3-5 Given the severe life-threatening nature of PE, rapid and accurate risk assessment is crucial. Typically, doctors classify patients based on a series of parameters, including the Pulmonary Embolism Severity Index (PESI) score, blood pressure measurements, changes in right ventricular pressure as shown by echocardiography, computed tomography pulmonary angiography, lower limb venous Doppler ultrasound, and biomarkers indicating right ventricular ischemia. 6 Nevertheless, these assessment methods can be labor-intensive or costly in clinical practice, posing certain difficulties. 7 A series of studies have revealed some unique laboratory markers in acute pulmonary embolism, which appear to have considerable value in diagnosis and prognostic evaluation.8-11 These laboratory tools, derived from routine tests, can instantly reflect the systemic inflammatory state, providing valuable insights for medical decision-making.
Right heart failure typically reduces left ventricular filling and cardiac output, resulting in systemic hypotension and hypoperfusion, which is the primary cause of mortality in acute PE. 1 Ventilation/perfusion scan mismatch-induced hypoxemia further exacerbates cellular hypoxia. Both mechanisms contribute to lactate accumulation. Lactate, a product of anaerobic metabolism, indicates the severity of tissue hypoperfusion and cellular hypoxia. Elevated lactate levels predict increased risks of organ dysfunction and mortality in critically ill patients.12,13 A meta-analysis indicated that elevated blood lactate levels in patients with acute PE are an effective indicator of overall mortality risk. 14 However, lactate levels can also be influenced by factors such as liver dysfunction, abnormal protein catabolism, and the intake of medications like metformin.15,16 Therefore, relying solely on lactate levels for prediction may not accurately assess the stability of clinical outcomes.
Albumin exerts physiological effects including platelet aggregation inhibition, endothelial integrity maintenance, and anti-inflammatory activity.17,18 Hypoalbuminemia compromises these protective functions. Previous research demonstrated higher restenosis rates after coronary stent implantation in low albumin level patients. 19 Consequently, the prothrombotic state associated with hypoalbuminemia may contribute to increased mortality. Research suggested baseline hypoalbuminemia serves as an independent predictor of mortality following acute PE, conveying significant prognostic value. 20 In addition, thrombosis is associated with inflammatory responses in pulmonary arterial and deep venous walls. 21 During inflammation, albumin facilitates the production of anti-inflammatory substances, 22 which may consume albumin and lead to its reduction. However, a patient's nutritional status or persistent inflammatory conditions can also affect albumin levels. This implies that prognostic predictions based solely on albumin measurements also have inherent limitations.
In recent years, the lactate-to-albumin ratio (LAR) has emerged as a prognostic indicator demonstrating predictive value in conditions such as severe sepsis, septic shock, and cardiac arrest.23-25 However, the association of LAR with mortality outcomes in pulmonary embolism (PE) patients has not been adequately studied. To fill this knowledge gap, we utilized the Medical Information Mart for Intensive Care IV version 2.2 (MIMIC-IV v2.2) database, which includes records of all PE hospital admissions from 2008 to 2019. This study aims to explore the potential association between LAR and 28-day all-cause mortality after admission by analyzing these data.
Methods
Data Selection
A data-based study was conducted using the MIMIC-IV (v2.2) database, maintained by the MIT Laboratory for Computational Physiology, which is an openly accessible critical care dataset. This database includes detailed information on all hospital admissions at Beth Israel Deaconess Medical Center from 2008 to 2019, covering length of stay, laboratory test results, vital signs, and medication recommendations. 26 All patient identifiers have been de-identified and replaced with random codes to ensure anonymity. Given the nature of the data, obtaining informed consent or ethical approval was not necessary. One of the study's first authors, Junhao Xu, completed the Collaborative Institutional Training Initiative (CITI) courses and successfully passed the exams on “Data or Specimens Only Research” and “Conflict of Interest” (Certificate Number: 13056906), allowing access to and use of the data.
Population Selection Criteria
Inclusion Criteria
The study subjects include individuals who received treatment at medical institutions between 2008 and 2019.
The screening scope is limited to patients recorded in the MIMIC-IV v2.2 database who were admitted to the Intensive Care Unit (ICU).
PE diagnoses were identified based on the following International Classification of Diseases (ICD) codes:
ICD-9 Codes: 415.11, 415.12, 415.13, 415.19
ICD-10 Codes: I26.0, I26.01, I26.02, I26.09, I26.9, I26.90, I26.92, I26.93, I26.94, I26.99
All PE cases were identified through primary discharge diagnoses.
Exclusion Criteria
Patients aged below 18 years at the time of their initial hospital admission.
Patients with repeat ICU admissions.
Patients lacking recorded data for both blood lactate and serum albumin levels.
Final Study Cohort
Following the application of inclusion and exclusion criteria, 4846 patients diagnosed with PE were initially identified within the database. Further refinement led to the inclusion of 319 patients for analysis (refer to Figure 1 in the study).

Schematic Diagram of Study Sample Selection Steps. MIMIC, Medical Information Mart for Intensive Care; PE, Pulmonary Embolism; ICU, Intensive Care Unit.
Data Extraction
This study relies on advanced data mining techniques, particularly through SQL queries in collaboration with the state-of-the-art database system PostgreSQL (version 14.2), to extract detailed patient health information. The core analytical variable focuses on the performance of LAR. To minimize potential bias and the effects of subsequent interventions or complications on biomarker levels, we selected two key indicators early in the admission period: blood lactate concentration and serum albumin level. We recorded the first set of results within 24 h of ICU admission. Blood lactate was measured from arterial blood, and serum albumin was measured from venous blood.
Participants’ initial configurations include diverse background parameters, covering demographic aspects (such as age, gender, and race), as well as physiological indicators like heart rate (HR), mean arterial pressure (MBP), respiratory rate (RR), temperature, and oxygen saturation. In terms of clinical management, we documented the use of vasopressors, the need for mechanical ventilation, and renal replacement therapy. Regarding comorbidities, we detailed conditions such as myocardial infarction, congestive heart failure, atrial fibrillation, chronic pulmonary disease, diabetes, and malignant cancer.
The laboratory dataset is extremely comprehensive, including partial pressure of oxygen (PaO2), partial pressure of carbon dioxide (PaCO2), white blood cell count (WBC), red blood cell count (RBC), red blood cell distribution width (RDW), platelet count (PLT), liver function indicators (such as alanine aminotransferase [ALT] and aspartate aminotransferase [AST]), prothrombin time (PT), activated partial thromboplastin time (APTT), international normalized ratio (INR), renal function indicators (blood urea nitrogen [BUN] and anion gap [AG]), electrolyte balance (serum potassium and sodium), and acid-base balance parameters (bicarbonate). Additionally, we included the Simplified Acute Physiology Score II (SAPS II) and Sequential Organ Failure Assessment (SOFA) to comprehensively depict the overall health status of the patients. For better calculation of PESI, we defined the Glasgow Coma Scale <15 as altered mental status. Finally, we took into account the Charlson Comorbidity Index (CCI), an important indicator of overall health status. All the values used above were the initial measurements upon ICU admission.
In this study, to address missing values, we employed the missForest package in R language to perform multiple imputation. Firstly, we collected a complete subset of data containing variables such as blood lactate and serum albumin. For missing variable values, we marked them as missing values for subsequent processing. Next, we utilized the functions in the missForest package to establish a multiple imputation model. This model estimates missing values using other complete observed variables and gradually optimizes them based on observed patterns. The missForest method typically requires multiple iterations to obtain stable estimates. In each iteration, the model uses the currently estimated missing values to re-estimate other missing values and continuously updates until convergence. After completing multiple iterations, we assessed the imputed data to ensure good imputation performance. This includes examining the distribution of imputed data, the quality of missing value imputation, and consistency with the original data. Finally, we used the imputed data for subsequent statistical analysis and modeling. Since the imputed dataset has supplemented missing information, more accurate assessments of relationships between variables are possible, and predictive models can be constructed.
Endpoint Events
In this study, we considered 28-day all-cause mortality as the primary endpoint. Specifically, we defined the occurrence of patient death within 28 days after hospital admission as the endpoint event. The selection of this time window was based on the clinical importance of assessing patient prognosis and the typical occurrence of acute events related to pulmonary embolism shortly after hospital admission. We observed and tracked the survival status of patients within 28 days after admission using clinical records from the MIMIC-IV database. Any patient who died within this time frame was considered to have experienced the endpoint event. This definition was established to ensure consistency and comparability of study outcomes and took into full consideration the clinical characteristics and progression speed of events related to PE.
Statistical Analysis
To validate the non-normal distribution of continuous variables, we used the Kolmogorov-Smirnov test. Normally distributed data were presented as mean ± standard deviation, while non-normal data were described using median (interquartile range). Categorical variables were expressed as frequency percentages. In describing initial characteristics, continuous variables were compared using t-tests or one-way analysis of variance (ANOVA), while categorical variables were analyzed using Pearson's chi-square test or Fisher's exact test.
We categorized LAR into low, middle, and high levels based on the data distribution. Subsequently, we performed unadjusted survival analysis by plotting Kaplan-Meier survival curves and used log-rank tests to examine the significance of survival differences among the three groups.
To investigate the impact of LAR on acute all-cause mortality, we employed Cox proportional hazards models to calculate the hazard ratio (HR) and 95% confidence interval (CI) for 28-day in-hospital mortality in PE patients. Variance inflation factor (VIF) test was used to assess the degree of collinearity between the variables. VIF over 10 were eliminated to reduce the influence of collinearity on the results. This analysis was done for three models: unadjusted analysis (Crude model), adjustments for demographic factors (Model 1, including gender, age, and race), and adjustments for demographic and comprehensive clinical variables (Model 2, including gender, age, race, PaO2, WBC, APTT, BUN, AG, potassium, bicarbonate, diabetes, malignant cancer and CCI). In all models, the lowest LAR tertile was used as the reference group.
Additionally, we used Restricted cubic spline (RCS) to explore the dose-response relationship between LAR and mortality in PE patients, considering adjustments from the multivariable models.
To determine whether LAR model outperforms the PESI, receiver operating characteristiccurve (ROC) and the area under the cruve (AUC) were used to evaluate the discriminative ability of the model. In order to assess whether there are significant differences in the C statistics between the LAR and PESI models, the DeLong test was employed. Integrated Discrimination Improvement (IDI) and Net Reclassification Improvement (NRI) were calculated to estimate the incremental predictive value of the LAR model.
To verify the prognostic universality of LAR, we conducted a series of subgroup analyses. These subsets were stratified by age, gender, race, oxygen level, and comorbidities such as diabetes and malignancy. Likelihood ratio tests were used to assess the interaction between LAR and these stratification variables.
All statistical analyses were performed using R software version 4.2.2, with a two-sided P-value of less than .05 considered statistically significant.
Results
Baseline Characteristics
In Table S1 (see Supplemental Material), we detail the initial characteristics of patients based on 28-day viability. Of the 319 participants included in the study, women were slightly over-represented at 53.6%, or 171, compared to 46.4%, or 148 with men. Notably, the mean age of non-surviving patients was significantly higher than that of survivors (between 71 and 62 years, P < .001), and their blood markers, such as white blood cell count (P < .001), clotting time (including INR, PT, and APTT, all P values were less than .05), serum urea nitrogen level (P = .007), and arterial lactate level (P < .001), showed an abnormally elevated trend. In terms of laboratory data, the LAR index of the survival group was significantly lower than that of the non-survival group (0.6 (0.4, 1.0) versus 1.2 (0.6, 2.1), P < .001). In addition, non-viable patients had a higher incidence of sepsis (91.7% vs 72.1%, P = .001), an increased need for mechanical ventilation (83.3% vs 55.9%, P < .001), and vasoactive dependence was more prevalent (83.3% vs 53.8%, P < .001). They had a greater health burden in terms of diabetes mellitus (40.3% vs 21.1%, P = .002), history of malignancy (38.9% vs 21.5%, P = 0.005), and significantly higher combined Charlson Complication Index (CCI) scores (7.0 vs 4.0, P < .001).
We also explored the baseline characteristics when LAR was treated as variable categorized into tertiles(LAR0: 0.17-0.49, LAR1: 0.50-0.96, LAR2: 0.96-8.55). Results showed in Table S2 (see Supplemental Material). The median LAR of the three groups were 0.39 [0.32, 0.44], 0.66 [0.57, 0.79] and 1.66 [1.26, 2.82], respectively. There were no significant differences in age, gender, or ethnicity distributions among the three groups. However, the LAR2 group exhibited higher RR and lower MBP. Additionally, the LAR2 group demonstrated more profound organ dysfunction, as evidenced by higher WBC, RDW, liver enzyme levels (ALT; AST), coagulation parameters (INR, PT), BUN and higher illness severity scores (SAPSII, SOFA)(all P < 0.05). Moreover, a higher incidence of sepsis (88.8% vs 65.1% and 75.5%, P < 0.001) and increased vasopressor requirements (77.6% vs 42.5% and 61.3%, P < .001) were observed in LAR2 group, while there were no significant differences in mechanical ventilation or continuous renal replacement therapy dependence. With a higher LAR, there was a gradual increase in the the 28-day mortality rate of PE(39.3% vs 17.9% and 10.4%, P < .001).
Hospitalization Outcomes and the LAR
Table 1 reveals the in-depth analysis of the multivariate COX regression models, focusing particularly on the unique impact of LAR on 28-day all-cause mortality. The study found that elevated LAR levels are significantly associated with higher mortality rates, with all statistical tests supporting this trend (P-values all less than 0.05). The crude model indicated that each unit increase in LAR is associated with a 29% increase in 28-day mortality risk (hazard ratio HR 1.29, 95% confidence interval CI 1.15-1.45, P < 0.001).
Cox Proportional Hazards Models of LAR and 28-d all Course Mortality.

Notes: Model 1 adjusted for sex, age and races; Model 2 further adjusted for PaO2, WBC, APTT, BUN, AG, potassium, bicarbonate, diabetes, malignant cancer, sepsis and CCI.
In Model 1, after accounting for the effects of age, sex, and race, each unit increase in LAR was associated with a 29% increase in 28-day mortality risk (HR 1.29, 95% CI 1.14-1.45, P < .001). When we divided LAR into tertiles, the middle level had a 74% increased risk of mortality compared to the low level, although the difference was not statistically significant (HR 1.74, 95% CI 0.82-3.66, P = .146), while the high-risk group had a significantly higher risk by 4.35 times (HR 4.35, 95% CI 2.23-8.47, P < .001), indicating a clear dose-response relationship (trend test P < .001).
In Model 2, we further included variables such as PaO2, WBC, INR, PT, APTT, BUN, AG, and other indicators. The results showed that each unit increase in LAR still resulted in a 13% increase in 28-day mortality risk (HR 1.13, 95% CI 0.96-1.33, P = .141), but not significant. Compared to the lowest level, the middle level had a 42% increased risk (HR 1.42, 95% CI 0.66-3.06, P = .318), although not statistically significant. However, the high-risk group had a significantly elevated mortality risk by 2.63 times (HR 2.63, 95% CI1.23-5.60, P = .012), with the dose-related trend remaining clear, with a trend test result of P = .006.
RCS Curve Analysis and Kaplan–Meier Curve
Using Kaplan-Meier survival curves (as shown in Figure 2), we found that the mortality rate in the highest LAR tertile was significantly higher compared to the low and middle tertiles. Furthermore, we employed a RCS curve (Figure 3) to investigate the dose-response relationship between LAR and 28-day mortality in PE patients. The fully adjusted model revealed a nonlinear dynamic relationship (nonlinearity significance P = .0016). The RCS curve demonstrates that at lower LAR values (below approximately 0.67), there is no apparent association with 28-day mortality, with a HR less than 1. However, as the LAR value continues to increase, HR also significantly increases. Beyond the threshold of LAR > 0.67, HR values continuously exceeding 1, highlighting a progressively increasing risk of 28-day mortality. At higher LAR levels (above 1.5 approximately), the risk continues to escalate, albeit at a decelerating rate. For LAR values exceeding 2.18, the HR remains elevated but shows a slight decrease compared to the former. This phenomenon may be attributed the paucity of extreme values leading to increased uncertainty in estimation (wider 95% CI).

Kaplan-Meier Survival Analysis Curves for All-Cause Mortality Within 28-d of Hospitalization.

RCS Curves for the Relationship Between LAR and 28-d All Cause Mortality.
ROC Curve and Verification
The ROC curve demonstrates the discriminative ability of both the LAR and PESI models (Figure 4). From the visual inspection of the curves, the LAR model (represented in pink) exhibits superior performance compared to the PESI model (in green). The AUC (Area Under the Curve) values for the models provide a quantitative comparison of this performance. The P-value for the DeLong test between the C-statistics of the two models was less than 0.001, indicating a statistically significant difference. Additionally, the positive IDI and NRI values further confirm that the LAR model provides incremental predictive value over the PESI model (Table 2).
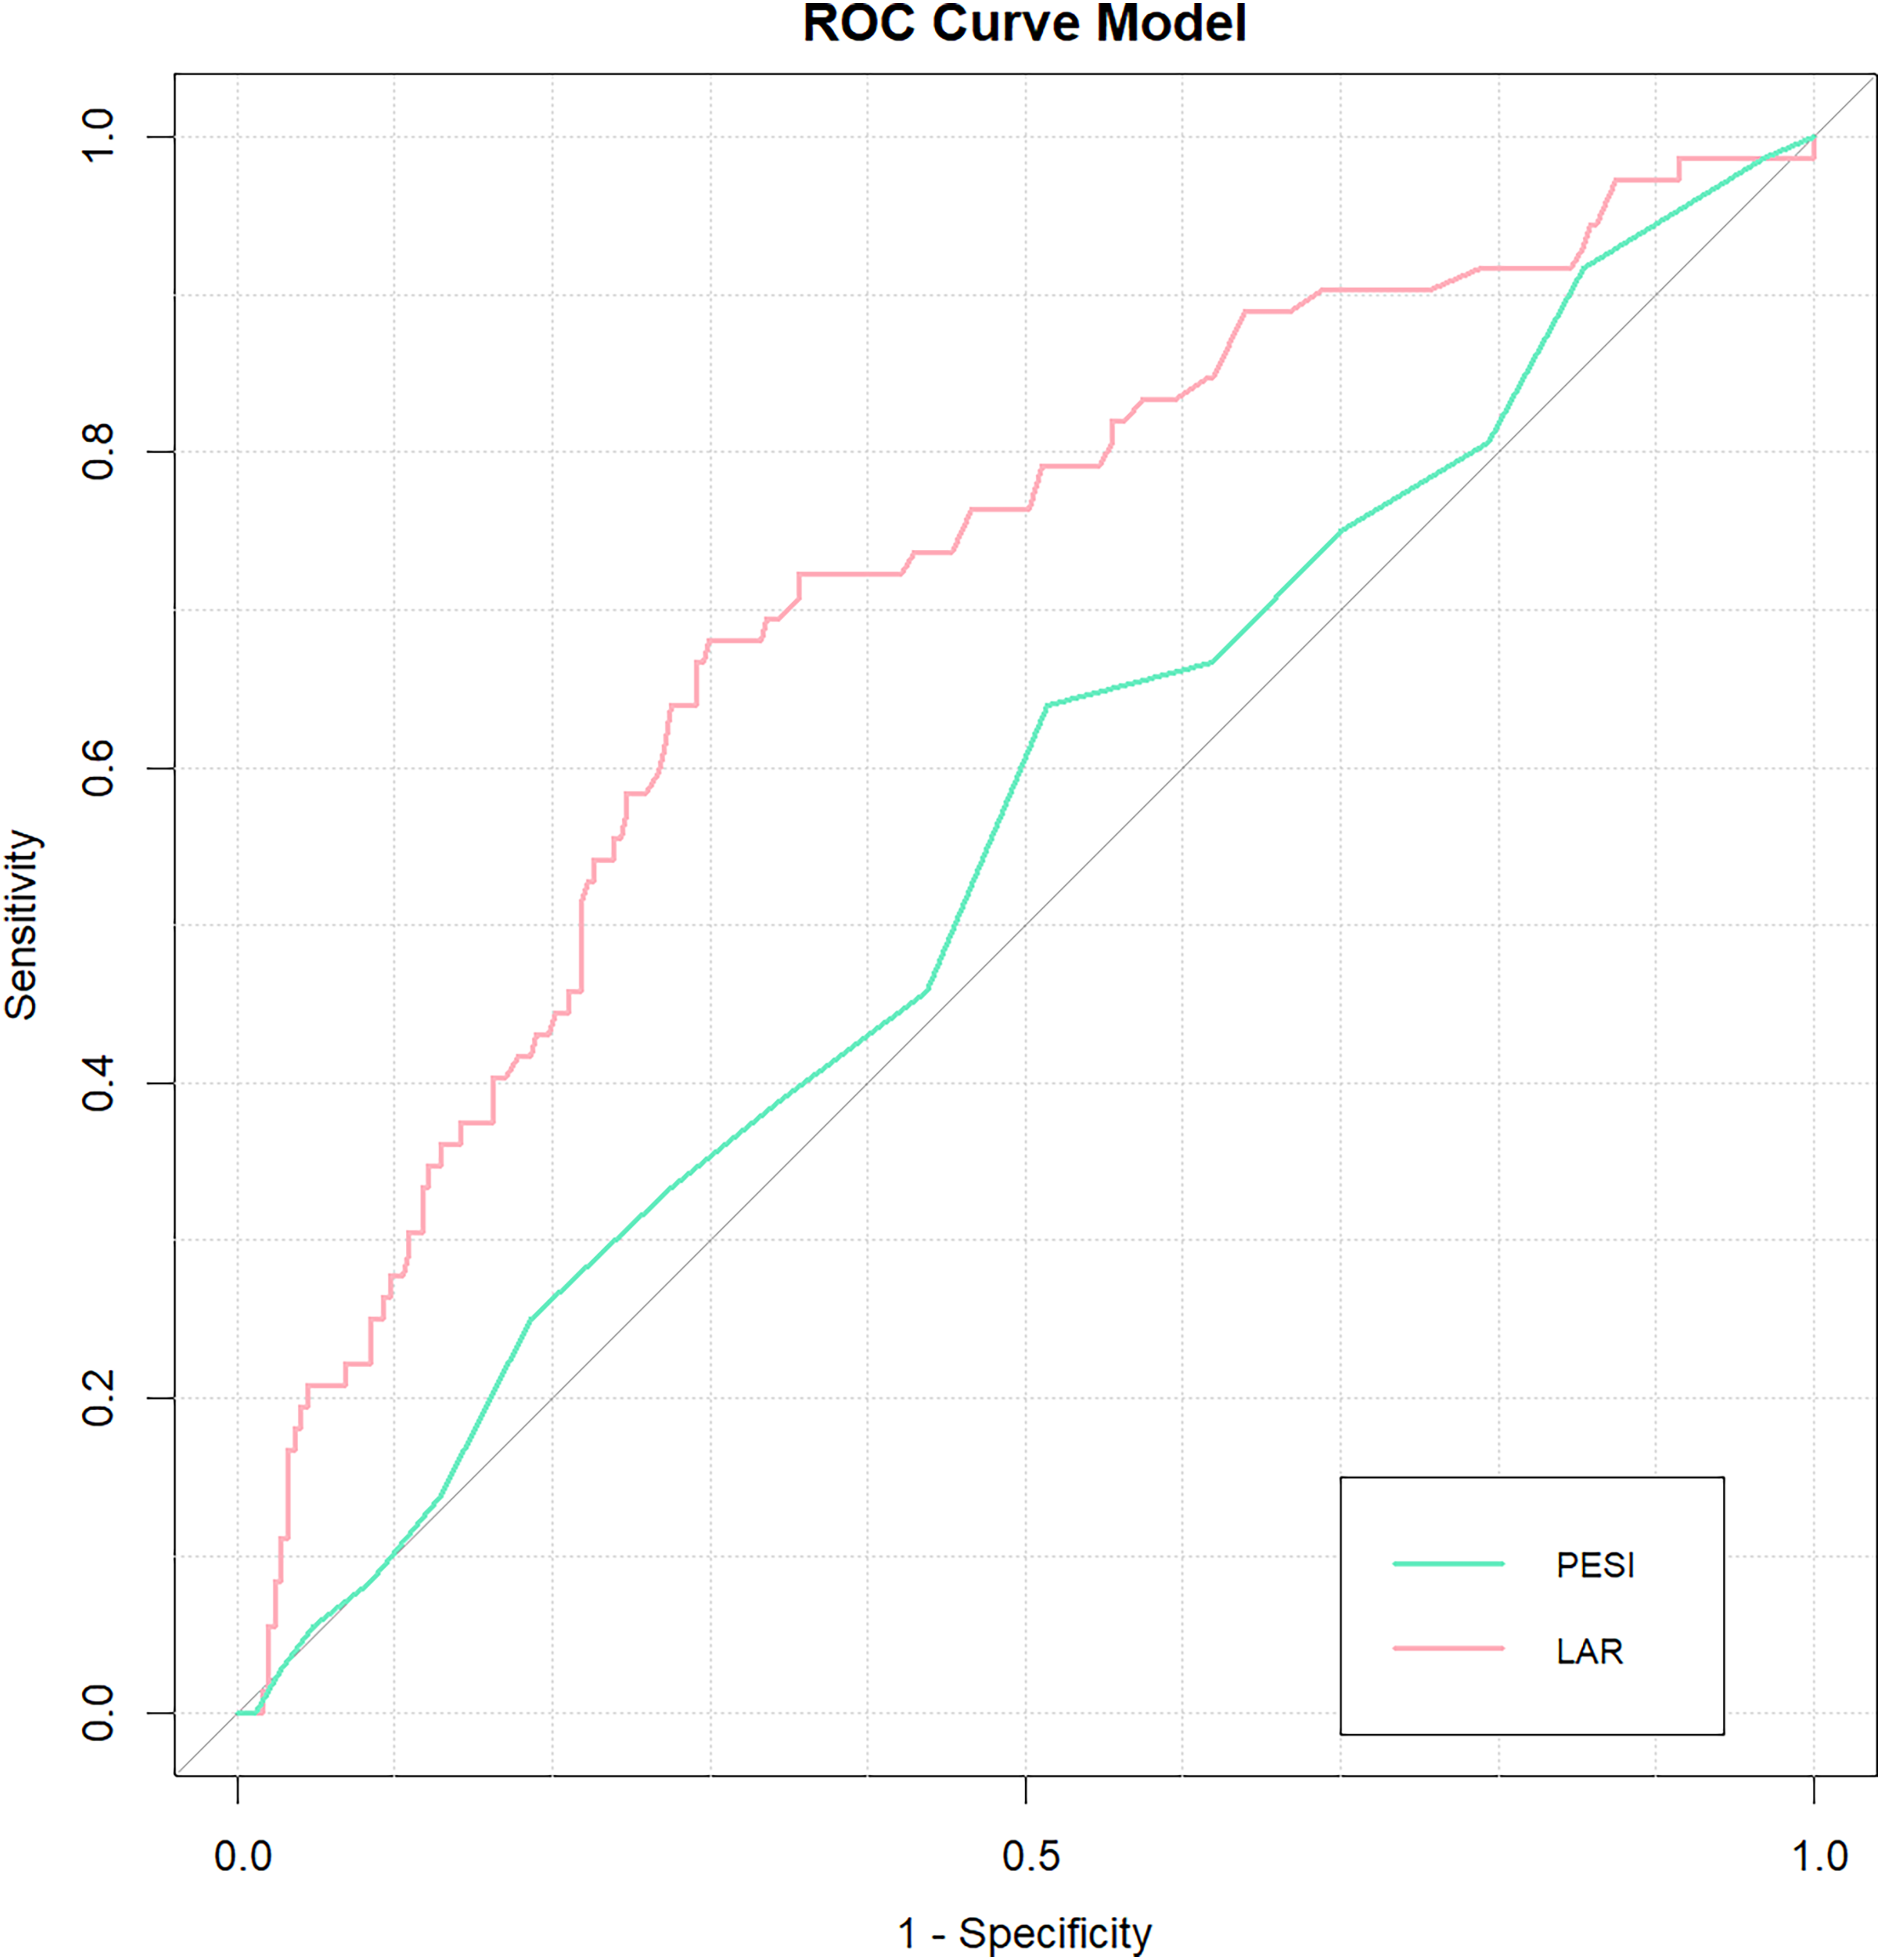
ROC Curve Comparison Between LAR and PESI Models.
Comparison of C-Statistic, IDI, and NRI Between LAR and PESI Models.

LAR models,
PESI models.
Subgroup Analysis
To examine in more detail, we used a forest plot (see Figure 5) to analyze the consistency of the association between LAR and 28-day all-cause mortality across different subgroups stratified by age (<60 years vs ≥ 60 years), sex, race, oxygen level (<60 mm Hg vs ≥ 60 mm Hg), and the presence of diabetes or malignancy. The results showed no significant interactions between LAR and any of the subgroups (all interaction P-values > .05). This confirms the stability and consistency of LAR as a prognostic indicator across different patient groups, enhancing its reliability in predicting outcomes in acute PE patients.
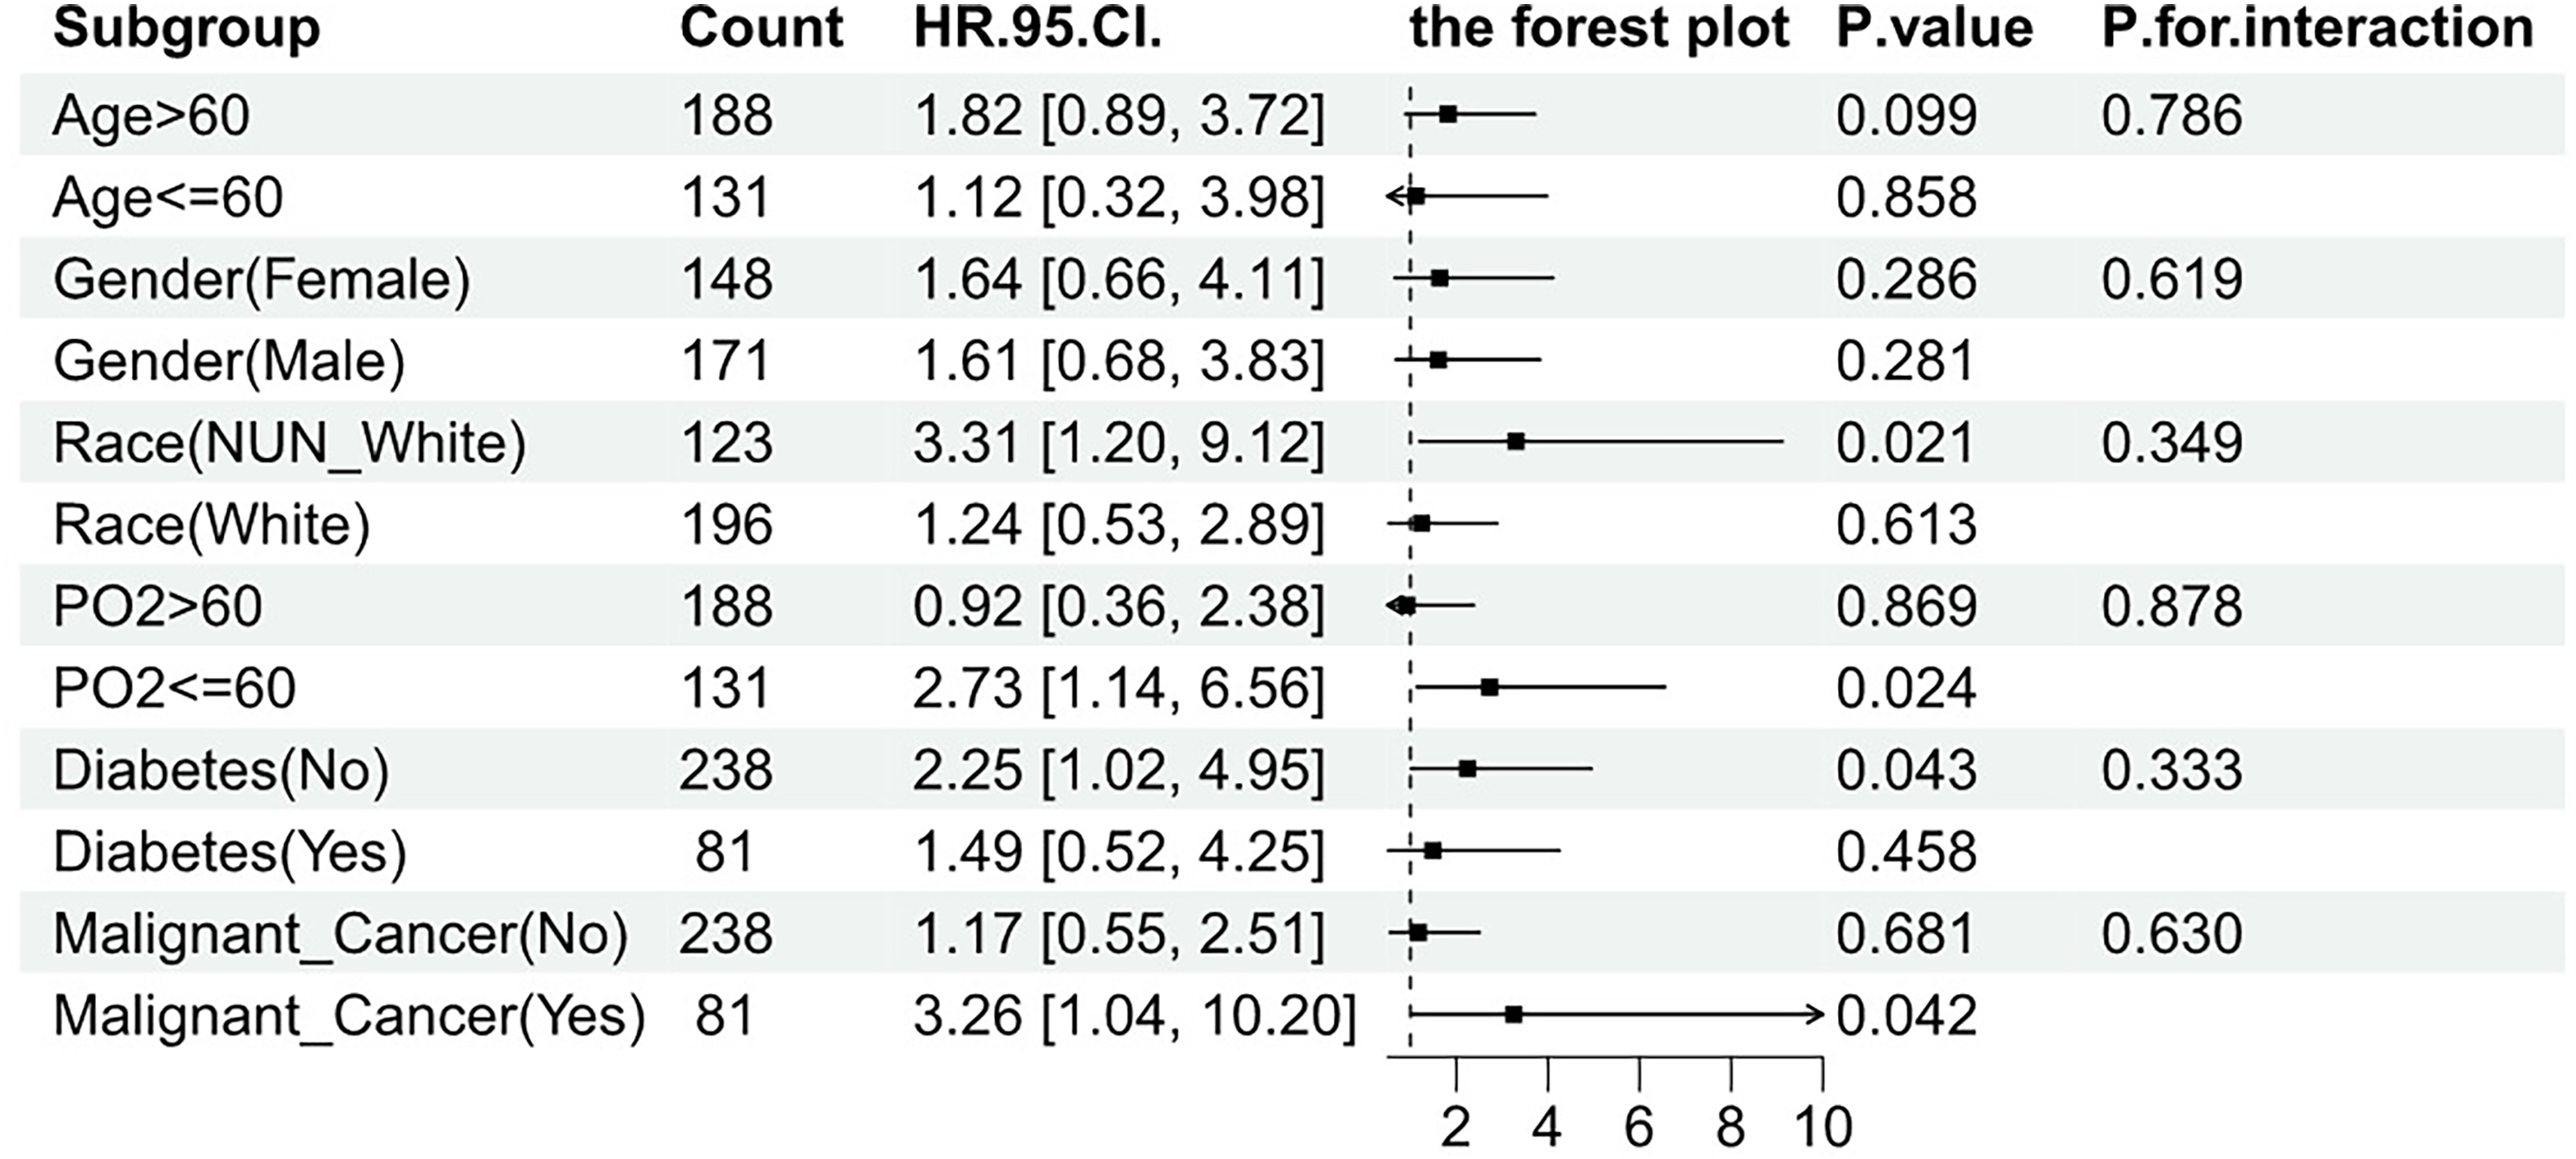
Forest Plot for Subgroup Analysis of the Relationship Between 28-d All Cause Mortality and LAR.
Discussion
In recent years, researchers has focus on investigating some novel laboratory parameters to predict the prognosis of patients with PE, such as copeptin, 27 neutrophil-to-lymphocyte ratio, platelet-to-lymphocyte ratio, 10 heart-type fatty acid binding protein, 28 serum sodium, 29 calcium, 30 as well as lactate 14 and albumin. 20 Elevated plasma lactate levels are commonly observed in acute PE patients 13 and are positively correlated with mortality.14,31 Albumin, as a negative acute-phase reactant, is associated with the severity of inflammation, disease prognosis, and mortality rates. The LAR, as a ratio of these two markers, involves the interplay of their opposing regulatory mechanisms, thereby mitigating the limitations of a single indicator. In Sepsis, Heart Failure, Acute Respiratory Failure, and Acute Pancreatitis, LAR has been used to predict mortality.22,32,33 However, LAR has not been applied to predict PE patients’ prognoses.
This study delved into the MIMIC-IV database to explore the close relationship between LAR and the short-term survival prospects of patients with acute pulmonary embolism (PE). We revealed that LAR is a key prognostic indicator in this specific patient population. The baseline analysis showed significant survival differences between survivors and non-survivors within 28 days after admission. Non-survivors were typically older and had more comorbidities, such as diabetes and malignant tumors. They exhibited stronger inflammatory responses, with elevated white blood cell counts and abnormal coagulation parameters as systemic markers. Notably, non-survivors had a significantly higher incidence of sepsis and a more urgent need for mechanical ventilation and vasopressor support, highlighting the severity of their condition. The emergence of negative results for LAR in the multifactorial Cox analysis may be linked to this observation. Sepsis itself stands as an independent risk factor influencing prognosis. Moreover, sepsis represents a clinical syndrome of severe infectious diseases intricately intertwined with the body's immune and inflammatory responses. Systemic inflammatory reactions and metabolic disturbances can lead to elevated lactate levels and protein consumption, with LAR potentially serving as a significant biological marker reflective of this immune-inflammatory state. Consequently, the correlation between LAR and prognosis may diminish following adjustment for sepsis.
Importantly, the rise in LAR values was positively correlated with mortality, suggesting the potential value of this biomarker in predicting adverse outcomes in PE patients. Our study clearly demonstrated the association pattern between LAR and mortality: the higher the LAR level, the sharply higher the risk of death. This relationship persisted even after adjusting for various confounding factors, suggesting that LAR may independently predict mortality in PE patients. Furthermore, the use of RCS analysis revealed a nonlinear association between LAR and mortality, with a distinct inflection point around an LAR value of 0.67. Beyond this threshold, the risk of mortality increased substantially, highlighting the importance of considering nonlinear relationships in prognostic models. More importantly, the C-statistic from the ROC curve, supported by the DeLong test, clearly indicates the superior performance of the LAR model. Additionally, the positive IDI and NRI values further confirm that the LAR model provides incremental predictive value over the PESI model. Subgroup analysis showed that the prognostic value of LAR remained consistent across different patient subgroups stratified by age, sex, race, oxygenation status, and medical history. This suggests that LAR serves as a robust prognostic indicator regardless of demographic or clinical characteristics, further supporting its utility in risk stratification and clinical decision-making for PE patients.
The findings of our research have several important clinical implications. LAR, as a readily available and easily calculable biomarker, shows promise as a prognostic tool complementing existing PE risk stratification methods. Elevated LAR values (eg, above 0.96 based on our data) help identify potentially high-risk patients, guiding intensified monitoring and early intervention. Its mortality predictive power, independent of other clinical factors, underscores its potential utility in informing treatment decisions and resource allocation—especially as an interim measure during delayed imaging availability. For patients with high LAR, clinicians might consider more aggressive treatment strategies(eg, thrombolysis or surgical embolectomy), and potential transfer to a higher level of care. Moreover, the nonlinear relationship observed between LAR and mortality highlights the importance of individualized risk assessment. Regular measurement of LAR may be useful to utilize to monitor changes in a patient's condition over time and adjust treatment plans accordingly. Lastly, the consistent prognostic value of LAR across various patient subgroups suggests its generalizability and applicability in diverse clinical settings. However, given the limitations of our sample size, further research is needed to determine the exact cut-off values for high-risk patients and how changes in LAR can guide clinical treatment.
Despite our significant findings, several limitations of the study must be acknowledged. Firstly, the relatively limited sample size (319 patients) restricted our statistical power. Additionally, the generalizability of our findings—derived from a single-center ICU cohort—to outpatients or individuals with milder forms of PE remains uncertain. Further prospective studies with larger and more diverse populations are warranted to validate the prognostic value of the lactate-to-albumin ratio in pulmonary embolism. Secondly, due to the absence of well-known prognostic factors associated with pulmonary embolism outcomes in the MIMIC-IV database, such as the PESI score, blood pressure measurements, echocardiography, computed tomography scans, and pulmonary angiography, this study is unable to elucidate the impact of these unmeasured confounders. Thirdly, retrospective nature of the study design prevents us from establishing causality. Additionally, we focused only on the relationship between LAR at a single time point after admission and outcomes, neglecting the impact of dynamic changes in LAR on prognosis, which is a crucial dimension. Lastly, due to the lack of specific information on the severity and anatomical location of PE, we could not comprehensively assess the predictive capability of LAR.
Conclusion
In summary, we observed a positive association and dose-response relationship between LAR and 28-day all-cause mortality in PE patients. The prognostic value of LAR was consistent across various subgroups. These preliminary findings suggest the potential of LAR as a prognostic indicator, aiding in risk assessment and clinical decision-making. However, prospective large-scale studies are essential to validate these findings and further explore the practical application of LAR in PE management.
Supplemental Material
sj-docx-1-cat-10.1177_10760296251366420 - Supplemental material for Relationship Between the Lactate-to-Albumin Ratio and 28-Day Overall Mortality in Critically Ill Patients with Pulmonary Embolism: A Retrospective Analysis of the MIMIC-IV Database
Supplemental material, sj-docx-1-cat-10.1177_10760296251366420 for Relationship Between the Lactate-to-Albumin Ratio and 28-Day Overall Mortality in Critically Ill Patients with Pulmonary Embolism: A Retrospective Analysis of the MIMIC-IV Database by Junhao Xu, Shaoxing Wu, Haipeng Li, Xinming Chen, You Zhou and Yinji Xu in Clinical and Applied Thrombosis/Hemostasis
Footnotes
Ethics Approval and Consent to Participate
Our institution does not require ethical approval for reporting individual cases or case series. The study is based on MIMIC-IV(v2.2) database.
Author Contributions
Junhao Xu, Shaoxing Wu and Xinming Chen were jointly responsible for the conception, design, data collection, data analysis, and editing of the manuscript. Shaoxing Wu performed the data processing and data code review. Junhao Xu and Haipeng Li drafted the manuscript. Junhao Xu and You Zhou reviewed the statistical analysis and literature search. Yinji Xu and You Zhou revised the manuscript and double-checked the statistical analysis results. All authors made substantial contributions and approved the content of the manuscript.
Funding
The authors disclosed receipt of the following financial support for the research, authorship, and/or publication of this article: This work was supported by the Major National Science and technology projects, (grant number 2023ZD0506600).
Declaration of Conflicting Interest
The authors declare that the research was conducted in the absence of any commercial or financial relationships that could be construed as a potential conflict of interest.
Data Availability Statement
Supplemental Material
Supplemental material for this article is available online.
References
Supplementary Material
Please find the following supplemental material available below.
For Open Access articles published under a Creative Commons License, all supplemental material carries the same license as the article it is associated with.
For non-Open Access articles published, all supplemental material carries a non-exclusive license, and permission requests for re-use of supplemental material or any part of supplemental material shall be sent directly to the copyright owner as specified in the copyright notice associated with the article.