
Abstract
Background
Percutaneous coronary intervention (PCI) improves outcomes in ST-segment elevation myocardial infarction (STEMI) by restoring myocardial perfusion. However, post-procedural malignant ventricular arrhythmias (MVA), as a serious complication, can cause hemodynamics instability and lead to in-hospital sudden cardiac death. Systemic inflammation indices serve as reliable biomarkers of inflammatory status and may predict arrhythmia risk. Current prediction models, however, frequently overlook key inflammatory markers and predominantly rely on traditional linear methods rather than advanced machine learning (ML) techniques. To address this limitation, our study developed an interpretable ML model using systemic inflammation indices to predict in-hospital MVA risk in STEMI patients following emergency PCI, thereby facilitating clinical decision-making.
Methods
We retrospectively analyzed 485 consecutive STEMI patients, dividing them into training and temporal validation cohorts. Based on clinical outcomes, patients were stratified into MVA and non-MVA groups. In the training cohort, we developed and internally validated multiple ML models using three predictor sets: (1) systemic inflammation indices alone, (2) traditional clinical indicators alone, and (3) their combination. The models’ performance was subsequently assessed in the temporal validation cohort. For the optimal model, we employed SHAP (Shapley Additive Explanations) values to evaluate feature importance and enhance model interpretability.
Results
Among the 485 enrolled patients, 88 (18.1%) developed MVA during hospitalization. Nine predictors, including systemic inflammation indices and traditional clinical markers, were significantly associated with MVA risk. The random forest (RF) model demonstrated superior predictive performance, achieving an area under the receiver operating characteristic (ROC) curve (AUC) of 0.925, outperforming logistic regression (Logit, AUC: 0.894), support vector machines (SVM, AUC: 0.898), and extreme gradient boosting (XGBoost, AUC: 0.915). SHAP analysis identified five key predictors—two systemic inflammation indices and three traditional clinical markers—as the most influential factors for assessing in-hospital MVA risk in STEMI patients after emergency PCI.
Conclusion
The RF model, integrating both systemic inflammation indices and traditional clinical indicators, provides an effective tool for predicting in-hospital MVA in STEMI patients following PCI. This ML approach enhances risk stratification accuracy, facilitating early clinical intervention to mitigate MVA occurrence.
Keywords
Introduction
In China, ischemic heart disease (IHD) remains a leading cause of mortality, accounting for substantial annual deaths and disability cases. 1 ST-segment elevation myocardial infarction (STEMI), the most severe manifestation of IHD, is associated with high mortality rates and frequent hospitalizations. 2 At present, percutaneous coronary intervention (PCI) stands as one of the most dependable approaches for managing STEMI. 3 While PCI rapidly restores blood flow to occluded arteries, the reperfusion process may paradoxically exacerbate myocardial injury and increase the risk of life-threatening arrhythmias, particularly malignant ventricular arrhythmias (MVA). As a critical post-STEMI complication, MVA causes severe hemodynamic instability, frequently resulting in syncope or sudden cardiac death. 4 Studies reveal that the majority of MVA cases occur within 48 h of STEMI symptom onset, establishing it as the predominant cause of in-hospital sudden cardiac death.5,6 The 30-day survival rate for MVA patients is significantly lower than non-MVA cases (69% vs 96%). 7 However, MVA-related mortality often occurs suddenly without warning signs, potentially leading to underestimation of its clinical impact. 8 Early identification of high-risk STEMI patients prone to MVA at admission, coupled with prompt preventive interventions, is crucial for improving clinical outcomes. Therefore, developing a clinically practical and efficient prediction model for assessing in-hospital MVA risk following emergency PCI in STEMI patients is imperative, as it would enable early risk stratification and timely intervention for high-risk individuals.
The development of MVA demonstrates significant associations with traditional clinical parameters including hypotension, hypokalemia, and elevated CK-MB levels.9-11 Emerging evidence further establishes correlations between systemic inflammation indices (such as neutrophil count, monocyte count, and neutrophil-to-lymphocyte ratio [NLR]) and arrhythmogenesis in IHD.12-14 Notably, composite indices including platelet-to-lymphocyte ratio (PLR), lymphocyte-to-monocyte ratio (LMR), and systemic immune-inflammation index (SII)—primarily calculated from peripheral neutrophil, lymphocyte, and monocyte counts—provide more robust assessments of systemic inflammatory status and disease progression, 15 suggesting their potential utility in predicting arrhythmic risk. These hematological indices offer distinct clinical advantages: they are cost-effective, readily available, and provide comprehensive cellular profiling. These characteristics position systemic inflammation indices as promising biomarkers for MVA risk stratification in STEMI patients. Nevertheless, the complex, nonlinear relationships between multidimensional clinical data and outcomes present significant analytical challenges that conventional linear models (eg, logistic regression [Logit]) cannot adequately address. Machine learning (ML), a branch of artificial intelligence renowned for its ability to uncover intricate patterns in large and complex datasets, is essential for building a robust predictive model in this context. 16 In model validation, three principal approaches generate prognostic accuracy metrics: (1) internal validation (typically a 20%–30% test set randomly sampled from the original dataset), (2) external validation using independent datasets, and (3) temporal validation—a specialized external validation employing chronologically distinct data (preferably later-period) from the same source as the training set. 17 While ML techniques have been widely applied in fields like oncology 18 and cardiology, 19 research on ML models using systemic inflammation indices to predict MVA in STEMI patients remains limited.
To address this gap, our study focuses on developing and validating an interpretable ML model using systemic inflammation indices to predict in-hospital MVA risk following emergency PCI in STEMI patients, thereby facilitating clinical decision-making.
Methods
Ethics Statement
This study was approved by the medical ethics committee of Shuyang Hospital of Traditional Chinese Medicine (No. 2025005) and conducted in accordance with the ethical principles of the Declaration of Helsinki. Written informed consent was obtained from patients.
Study Population
We retrospectively analyzed 995 consecutive STEMI patients admitted to Shuyang Hospital of Traditional Chinese Medicine between June 2020 and June 2024. The inclusion criteria were: (1) age ≥18 years, (2) meeting STEMI diagnostic criteria, and (3) undergoing emergency PCI within 24 h of symptom onset. Exclusion criteria included: (1) concurrent malignant tumors, active infections, or severe organ dysfunction; (2) current steroid therapy for autoimmune diseases; and (3) incomplete research data. Following screening based on these criteria, 485 eligible patients were enrolled in the final analysis. The study population was divided into two cohorts: a training cohort comprising 340 patients treated between June 2020 and December 2022, and a temporal validation cohort of 145 patients treated between January 2023 and June 2024 (Figure 1). Patients were categorized into the MVA group (n = 88) or non-MVA group (n = 397) based on the occurrence of MVA (ventricular tachycardia [VT] or ventricular fibrillation [VF]) post-PCI during hospitalization.
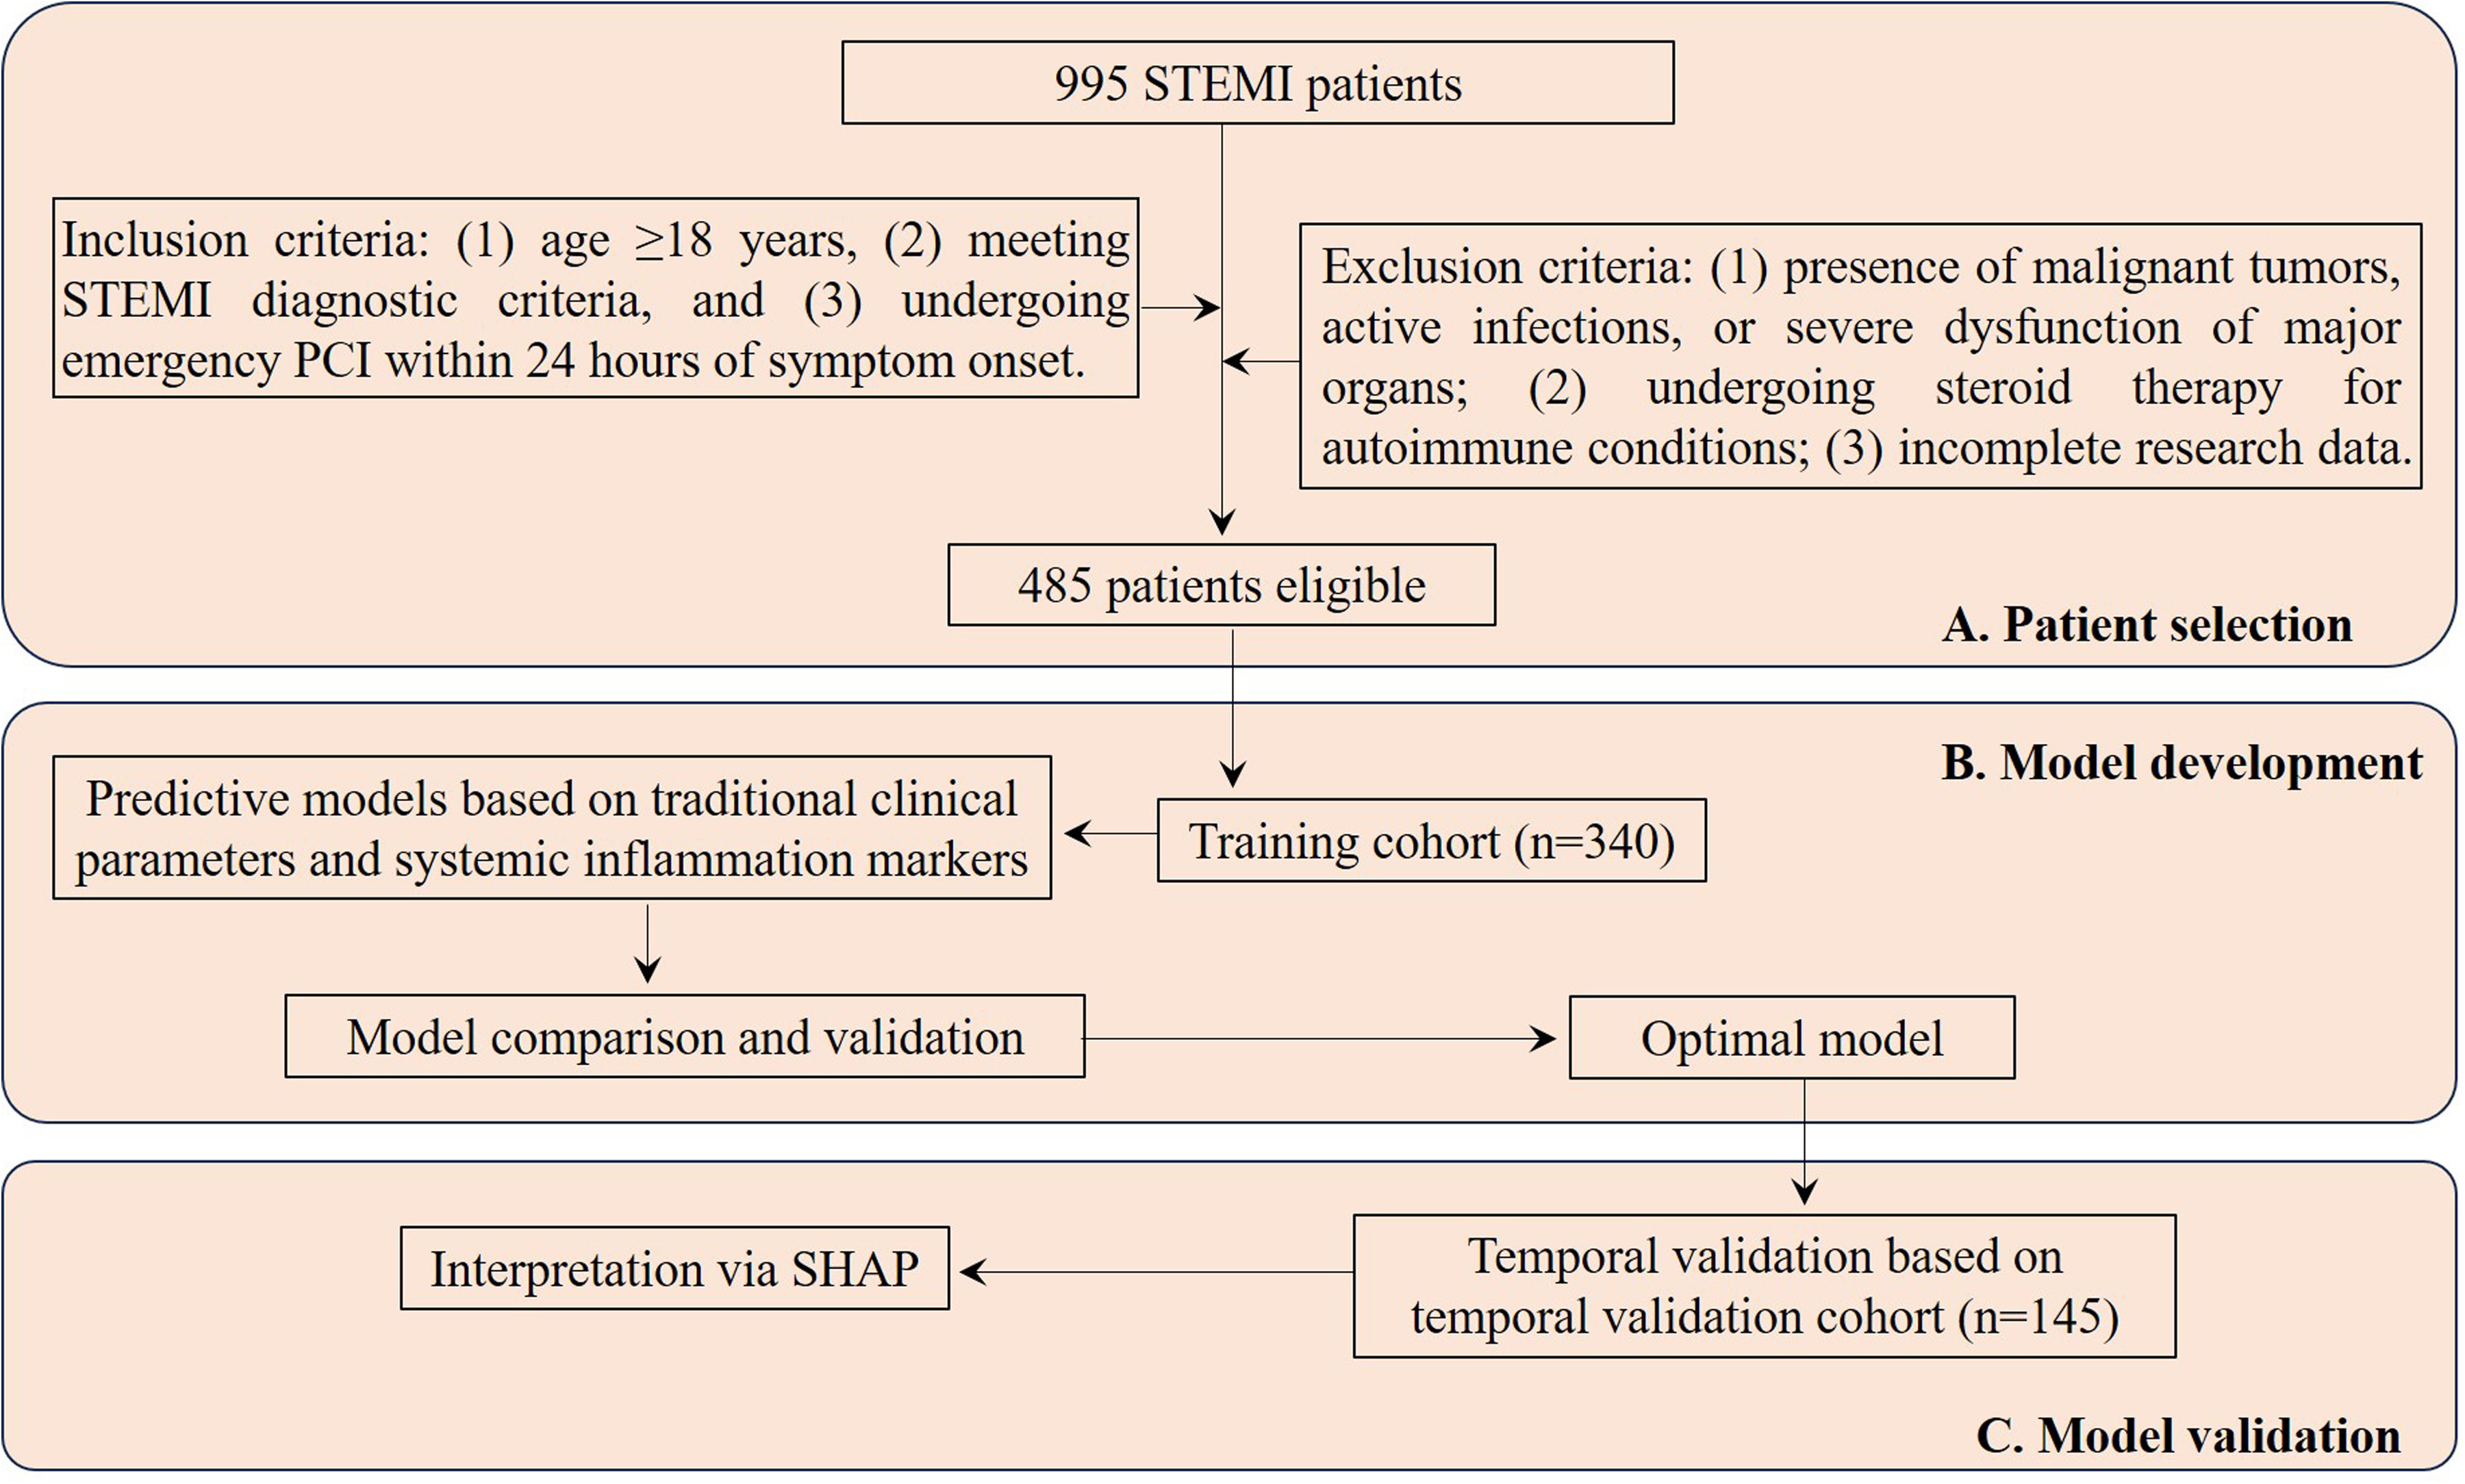
Flowchart Illustrating Patient Selection and Cohort Distribution for Developing and Validating Predictive Models in STEMI Patients. STEMI, ST-Segment Elevation Myocardial Infarction; PCI, Percutaneous Coronary Intervention; SHAP, Shapley Additive Explanations.
Data Collection
Comprehensive baseline characteristics were collected at admission, including: (1) traditional clinical parameters (such as age, gender, and body mass index [BMI]); and (2) systemic inflammation markers (such as neutrophil, lymphocyte, platelet, monocyte, NLR, PLR, LMR, and SII). The SII was calculated using the formula (platelets × neutrophils)/lymphocytes. Additional data collection included: (i) documentation of MVA events during hospitalization; and (ii) serum electrolyte levels (potassium and sodium) obtained both at admission and 24 h post-PCI. Peripheral blood inflammatory cells were analyzed using three different analyzers: the Sysmex XN-3000 (Japan), and the Mindray BC-5100 and BC-760CS (Shenzhen). The reference interval for these cells is provided in Supplementary Table 2.
Data Preprocessing
Prior to model development, we conducted essential data preprocessing to ensure fairness. All variables underwent normalization: continuous variables were standardized using Z-score normalization (mean = 0, standard deviation = 1), while categorical variables were binarized as “0” or “1.” This standardization process facilitated fair comparison across different measurement scales.
Features Selection
To optimize model parsimony, we employed a three-step feature selection process: (1) initial screening using Student's t-test (normally distributed variables), Mann-Whitney U test (non-normal distributions), and chi-square tests (categorical variables) to identify significant differences between MVA and non-MVA groups; (2) dimensionality reduction via LASSO regression with five-fold cross-validation; (3) final selection through multivariable logistic regression of variables with non-zero LASSO coefficients. Our study revealed significant MVA/non-MVA group imbalance—a common challenge in medical research where non-patient/patient disproportion often compromises predictive performance. Synthetic Minority Oversampling Technique (SMOTE), an effective class-imbalance solution, uses k-neighbor synthesis to balance datasets by generating minority-class samples.20,21 This technique has proven particularly valuable in disease detection. We applied SMOTE exclusively to our training cohort to address data imbalance and mitigate overfitting, while maintaining the natural distribution of temporal validation cohort.
Development and Internal Validation of Prediction Models
To assess in-hospital MVA risk in STEMI patients after emergency PCI, we employed four ML classifiers: Logit, random forest (RF), support vector machines (SVM), and extreme gradient boosting (XGBoost). Three distinct predictive frameworks were developed using: (1) traditional clinical parameters alone; (2) systemic inflammation markers alone, and (3) their combined. To avoid overfitting during training, we implemented a triple five-fold cross-validation scheme: (1) The dataset was partitioned into five equal folds; (2) Each fold served as the test set once while the remaining four were used for training; (3) This process was repeated three times with different random seeds; (4) Final performance metrics were averaged across all iterations. 22
Temporal Validation and Model Interpretation
The model's predictive ability was validated using discrimination and calibration metrics. Discrimination was assessed through the area under the receiver operating characteristic (ROC) curve (AUC), along with accuracy, sensitivity, specificity, and F1 score. Calibration was evaluated using the Brier score and calibration curves, where the Brier score measures the mean squared difference between predicted probabilities and actual outcomes, with lower scores indicating better performance. Additionally, clinical effectiveness and net benefit are evaluated through decision curve analysis (DCA).
For model interpretability, we employed SHAP (Shapley Additive Interpretation) values. Rooted in cooperative game theory, 23 SHAP has proven effective in explaining various machine learning models.24-26 It assigns a Shapley values to each feature based on its contribution to the model's output, thereby elucidating its influence on the outcome. These values not only measure the magnitude of each feature's impact across samples, clarifying its role as either a protective or risk factor. We employed three key SHAP visualization tools: (1) summary plots for overall feature importance ranking, (2) dependence plots to examine non-linear relationships between specific features and model outputs, and (3) force plots that deconstruct individual predictions by showing how each feature shifts the baseline value to the final output.
Web Application Development
To improve clinical applicability, we developed a Python-based web application integrating the final prediction model. The application enables clinicians to input patient characteristics and receive real-time MVA risk predictions.
Statistical Analysis
Statistical analyses were performed using IBM SPSS (v26.0), R (v4.2.3), and Python (v3.10.0). Data distribution was evaluated using the Shapiro-Wilk test. Normally distributed continuous data were reported as mean ± standard deviation (SD), while non-normally distributed data were expressed as median (interquartile range [IQR]). Student's t-test was used for normally distributed continuous data, while the Mann-Whitney U test was applied for non-normal data. Categorical data were expressed as frequency (percentage), with group comparisons performed using the χ2 test. A two-tailed p-value < 0.05 was deemed statistically significant.
Results
Patient Characteristics
The recruitment process is depicted in the flow diagram (Figure 1), with 485 out of 995 screened patients meeting inclusion criteria. The incidence of MVA showed no significant variation between cohorts (training: 18.2% [62/340] vs temporal validation: 17.9% [26/145]; χ²=0.001, p = 0.971). Table 1 demonstrates balanced baseline characteristics between cohorts (all p > 0.05), while Table 2 (training cohort) and Supplementary Table 1 (temporal validation cohort) present comparative analyses between Non-MVA and MVA groups.
Baseline Characteristics of Patients in the Training and Temporal Validation Cohorts.
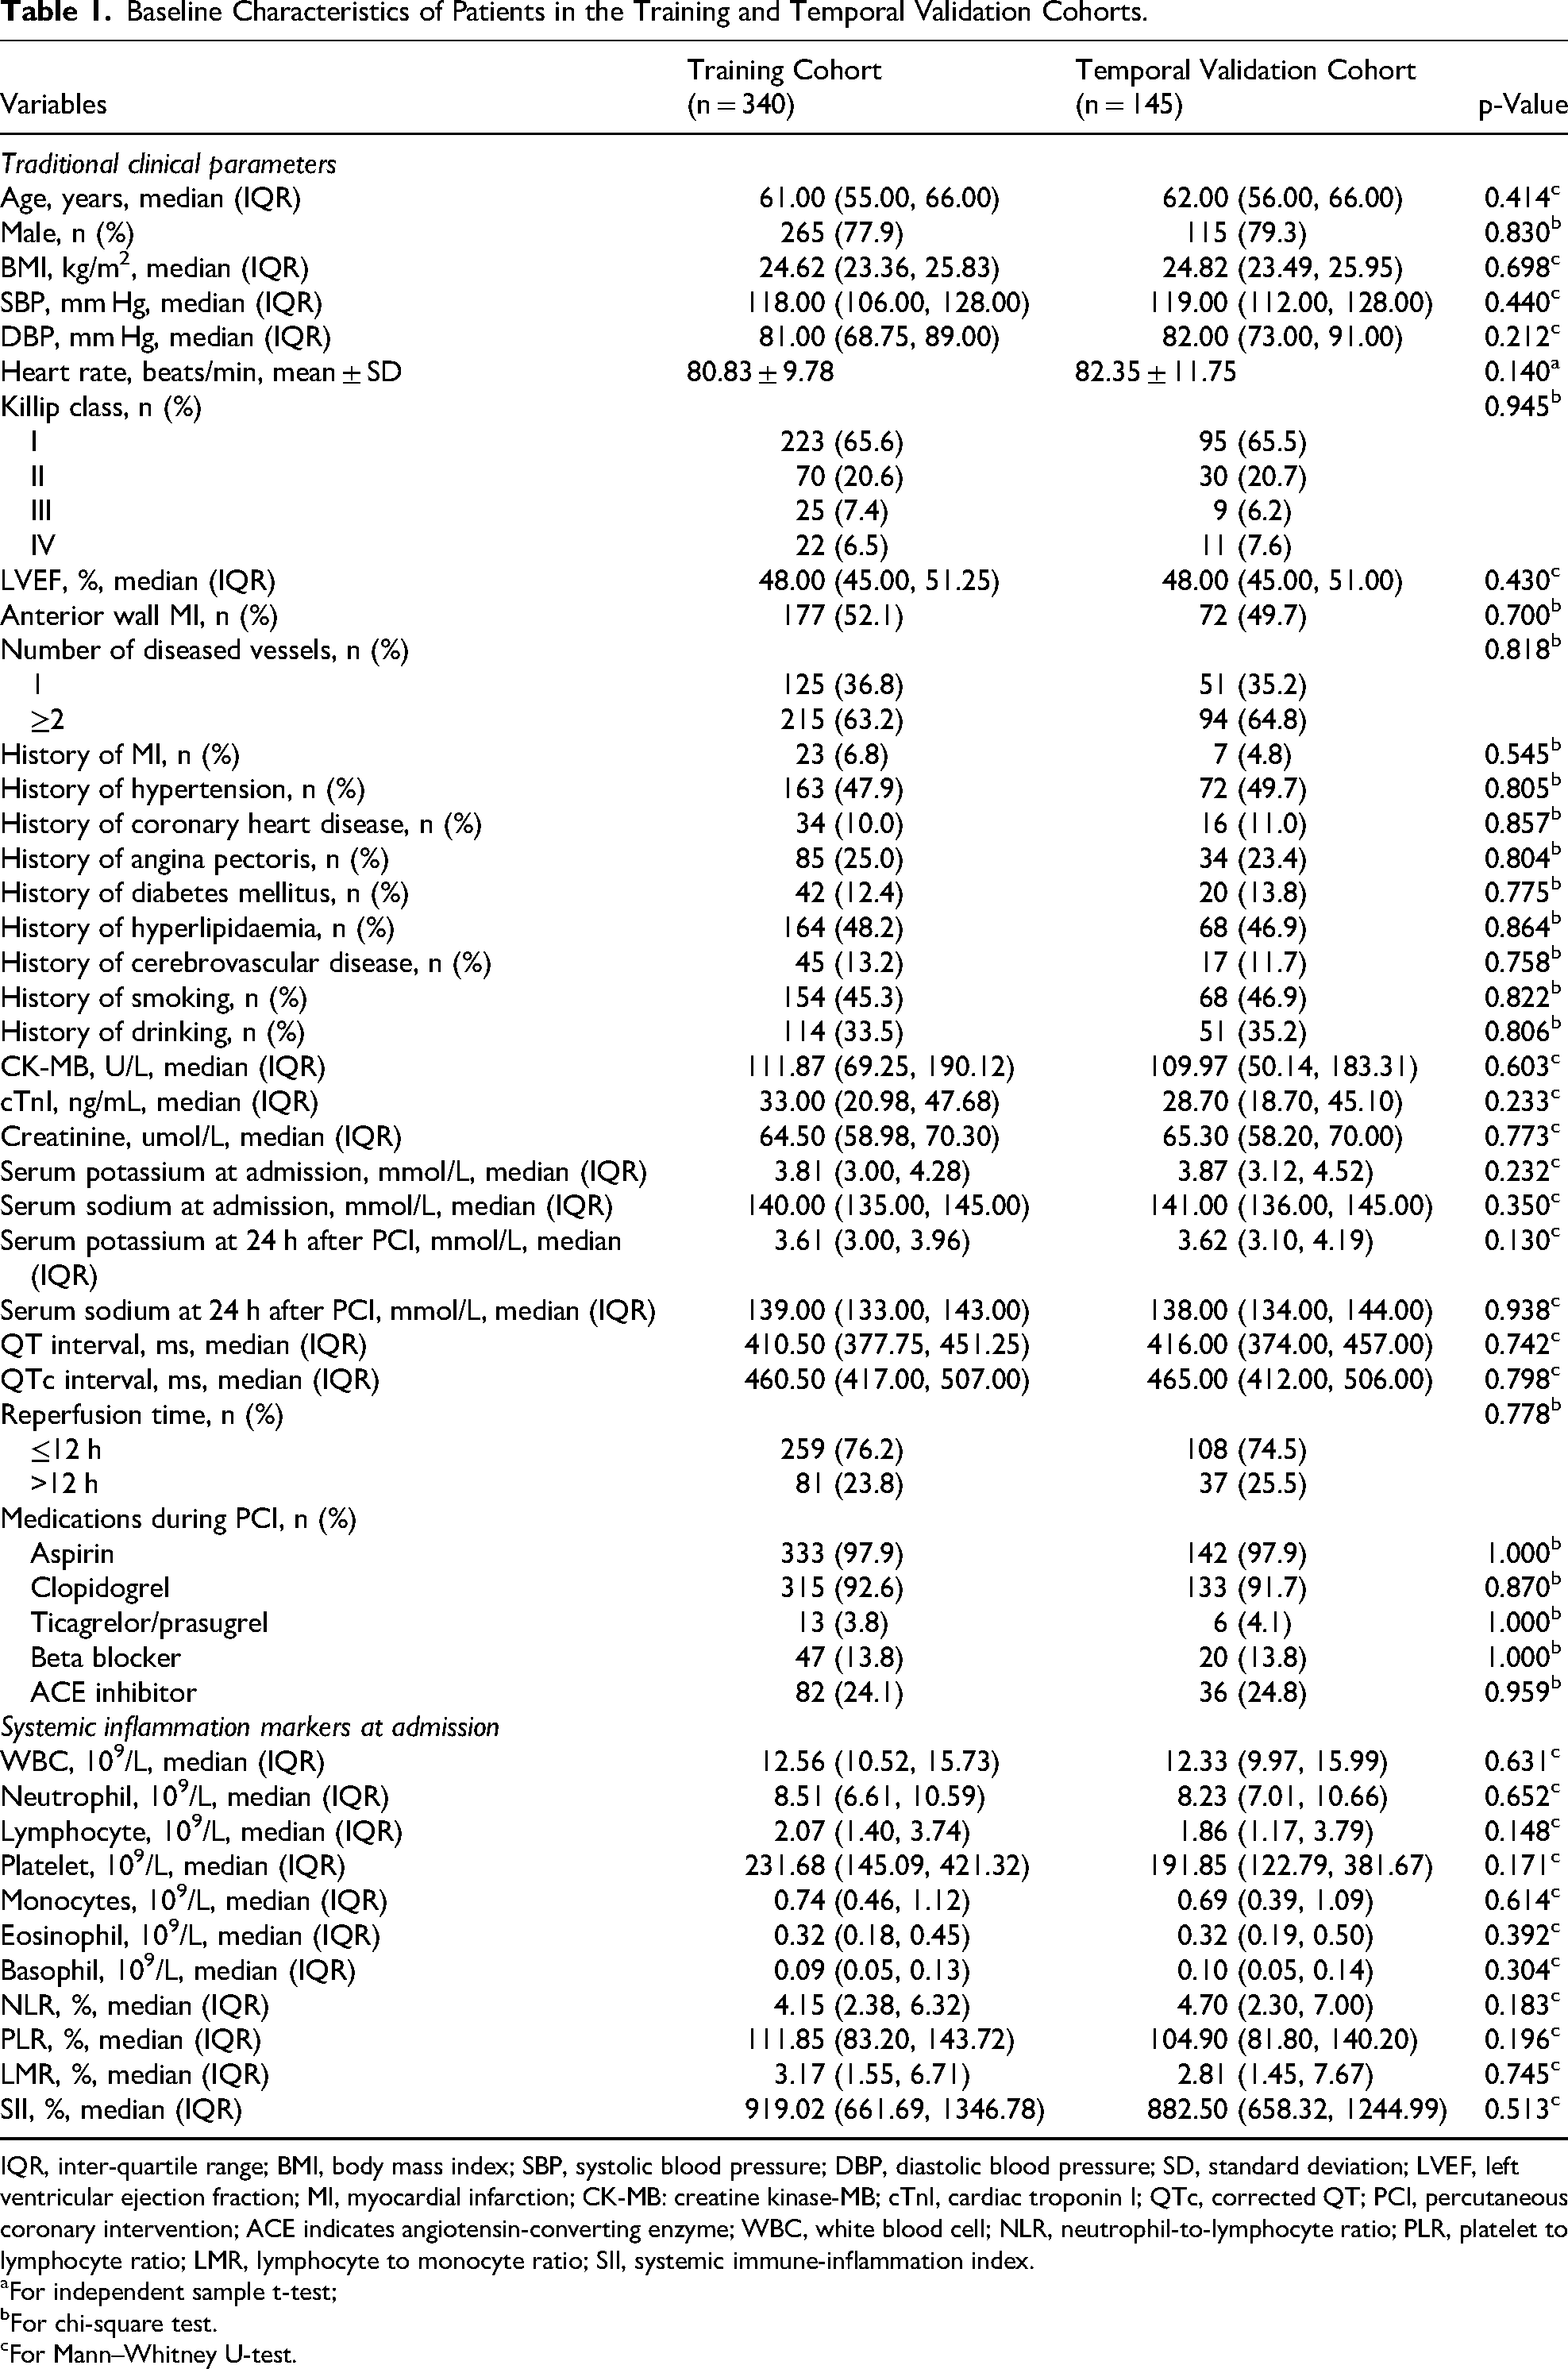
IQR, inter-quartile range; BMI, body mass index; SBP, systolic blood pressure; DBP, diastolic blood pressure; SD, standard deviation; LVEF, left ventricular ejection fraction; MI, myocardial infarction; CK-MB: creatine kinase-MB; cTnI, cardiac troponin I; QTc, corrected QT; PCI, percutaneous coronary intervention; ACE indicates angiotensin-converting enzyme; WBC, white blood cell; NLR, neutrophil-to-lymphocyte ratio; PLR, platelet to lymphocyte ratio; LMR, lymphocyte to monocyte ratio; SII, systemic immune-inflammation index.
For independent sample t-test;
For chi-square test.
For Mann–Whitney U-test.
Comparison of Traditional Clinical Parameters and Systemic Inflammation Markers Between MVA and Non-MVA Patients in the Training Cohort.

MVA, malignant ventricular arrhythmias; IQR, inter-quartile range; BMI, body mass index; SBP, systolic blood pressure; DBP, diastolic blood pressure; LVEF, left ventricular ejection fraction; MI, myocardial infarction; CK-MB: creatine kinase-MB; cTnI, cardiac troponin I; QTc, corrected QT; PCI, percutaneous coronary intervention; ACE indicates angiotensin-converting enzyme; WBC, white blood cell; NLR, neutrophil-to-lymphocyte ratio; PLR, platelet to lymphocyte ratio; LMR, lymphocyte to monocyte ratio; SII, systemic immune-inflammation index.
For chi-square test.
For Mann–Whitney U-test.
Feature Selection in the Training Cohort
Table 2 presents the comparative analysis of traditional clinical parameters and systemic inflammation indices between MVA and non-MVA groups in the training cohort, revealing significant associations (all p < 0.05) between MVA occurrence and several risk factors. These include hemodynamic compromise (lower systolic blood pressure [SBP]), impaired cardiac function (elevated Killip class, reduced left ventricular ejection fraction [LVEF]), coronary disease severity (greater number of diseased vessels), lifestyle factors (alcohol history), and biochemical abnormalities (elevated CK-MB, hypokalemia at admission and 24 h post-PCI). Additionally, systemic inflammation markers showed significant elevation in MVA patients, including WBC counts, neutrophil and monocyte levels, and derived indices (NLR, PLR, LMR, SII). Next, LASSO regression combined with 10-fold cross-validation was employed to optimize the variable selection. Using the lambda value at 1 standard error, 11 key variables were identified (Figure 2): SBP, Killip class, LVEF, history of drinking, CK-MB, serum potassium levels at admission and 24 h after PCI, monocytes, NLR, PLR, and SII. To minimize the influence of confounding factors, multivariate logistic regression was performed on the selected variables to identify independent predictors of in-hospital MVA risk in STEMI patients following emergency PCI (Table 3). The analysis confirmed all variables except LVEF and PLR as independent predictors (all p < 0.05). The correlation heatmap (Figure 3) further demonstrated that all variable correlations were below 0.3, indicating no significant multicollinearity. To address the substantial class imbalance (62 MVA and 278 non-MVA), SMOTE oversampling was applied, achieving balanced classes (n = 278 each). The final ML model incorporated nine optimized predictors: SBP, Killip class, history of drinking, CK-MB, serum potassium (admission/24 h after PCI), monocytes, NLR, and SII, all standardized via Z-score normalization (mean = 0, SD = 1) to enhance model performance and prediction accuracy.

LASSO Regression Analysis for Feature Selection. (A) Coefficient Profiles of 11 Variables. (B) Optimal Penalty Coefficient (Lambda) Selection Via Five-Fold Cross-Validation. The Plot Displays Partial Likelihood Deviance Versus log(lambda), with Lambda as the Tuning Parameter. Red Dots Indicate Mean Deviance Values per Model at Each Lambda, Accompanied by Error Bars for Standard Error. Dotted Vertical Lines Denote Optimal Lambda Values Based on Minimum Deviance and the 1-SE Rule.
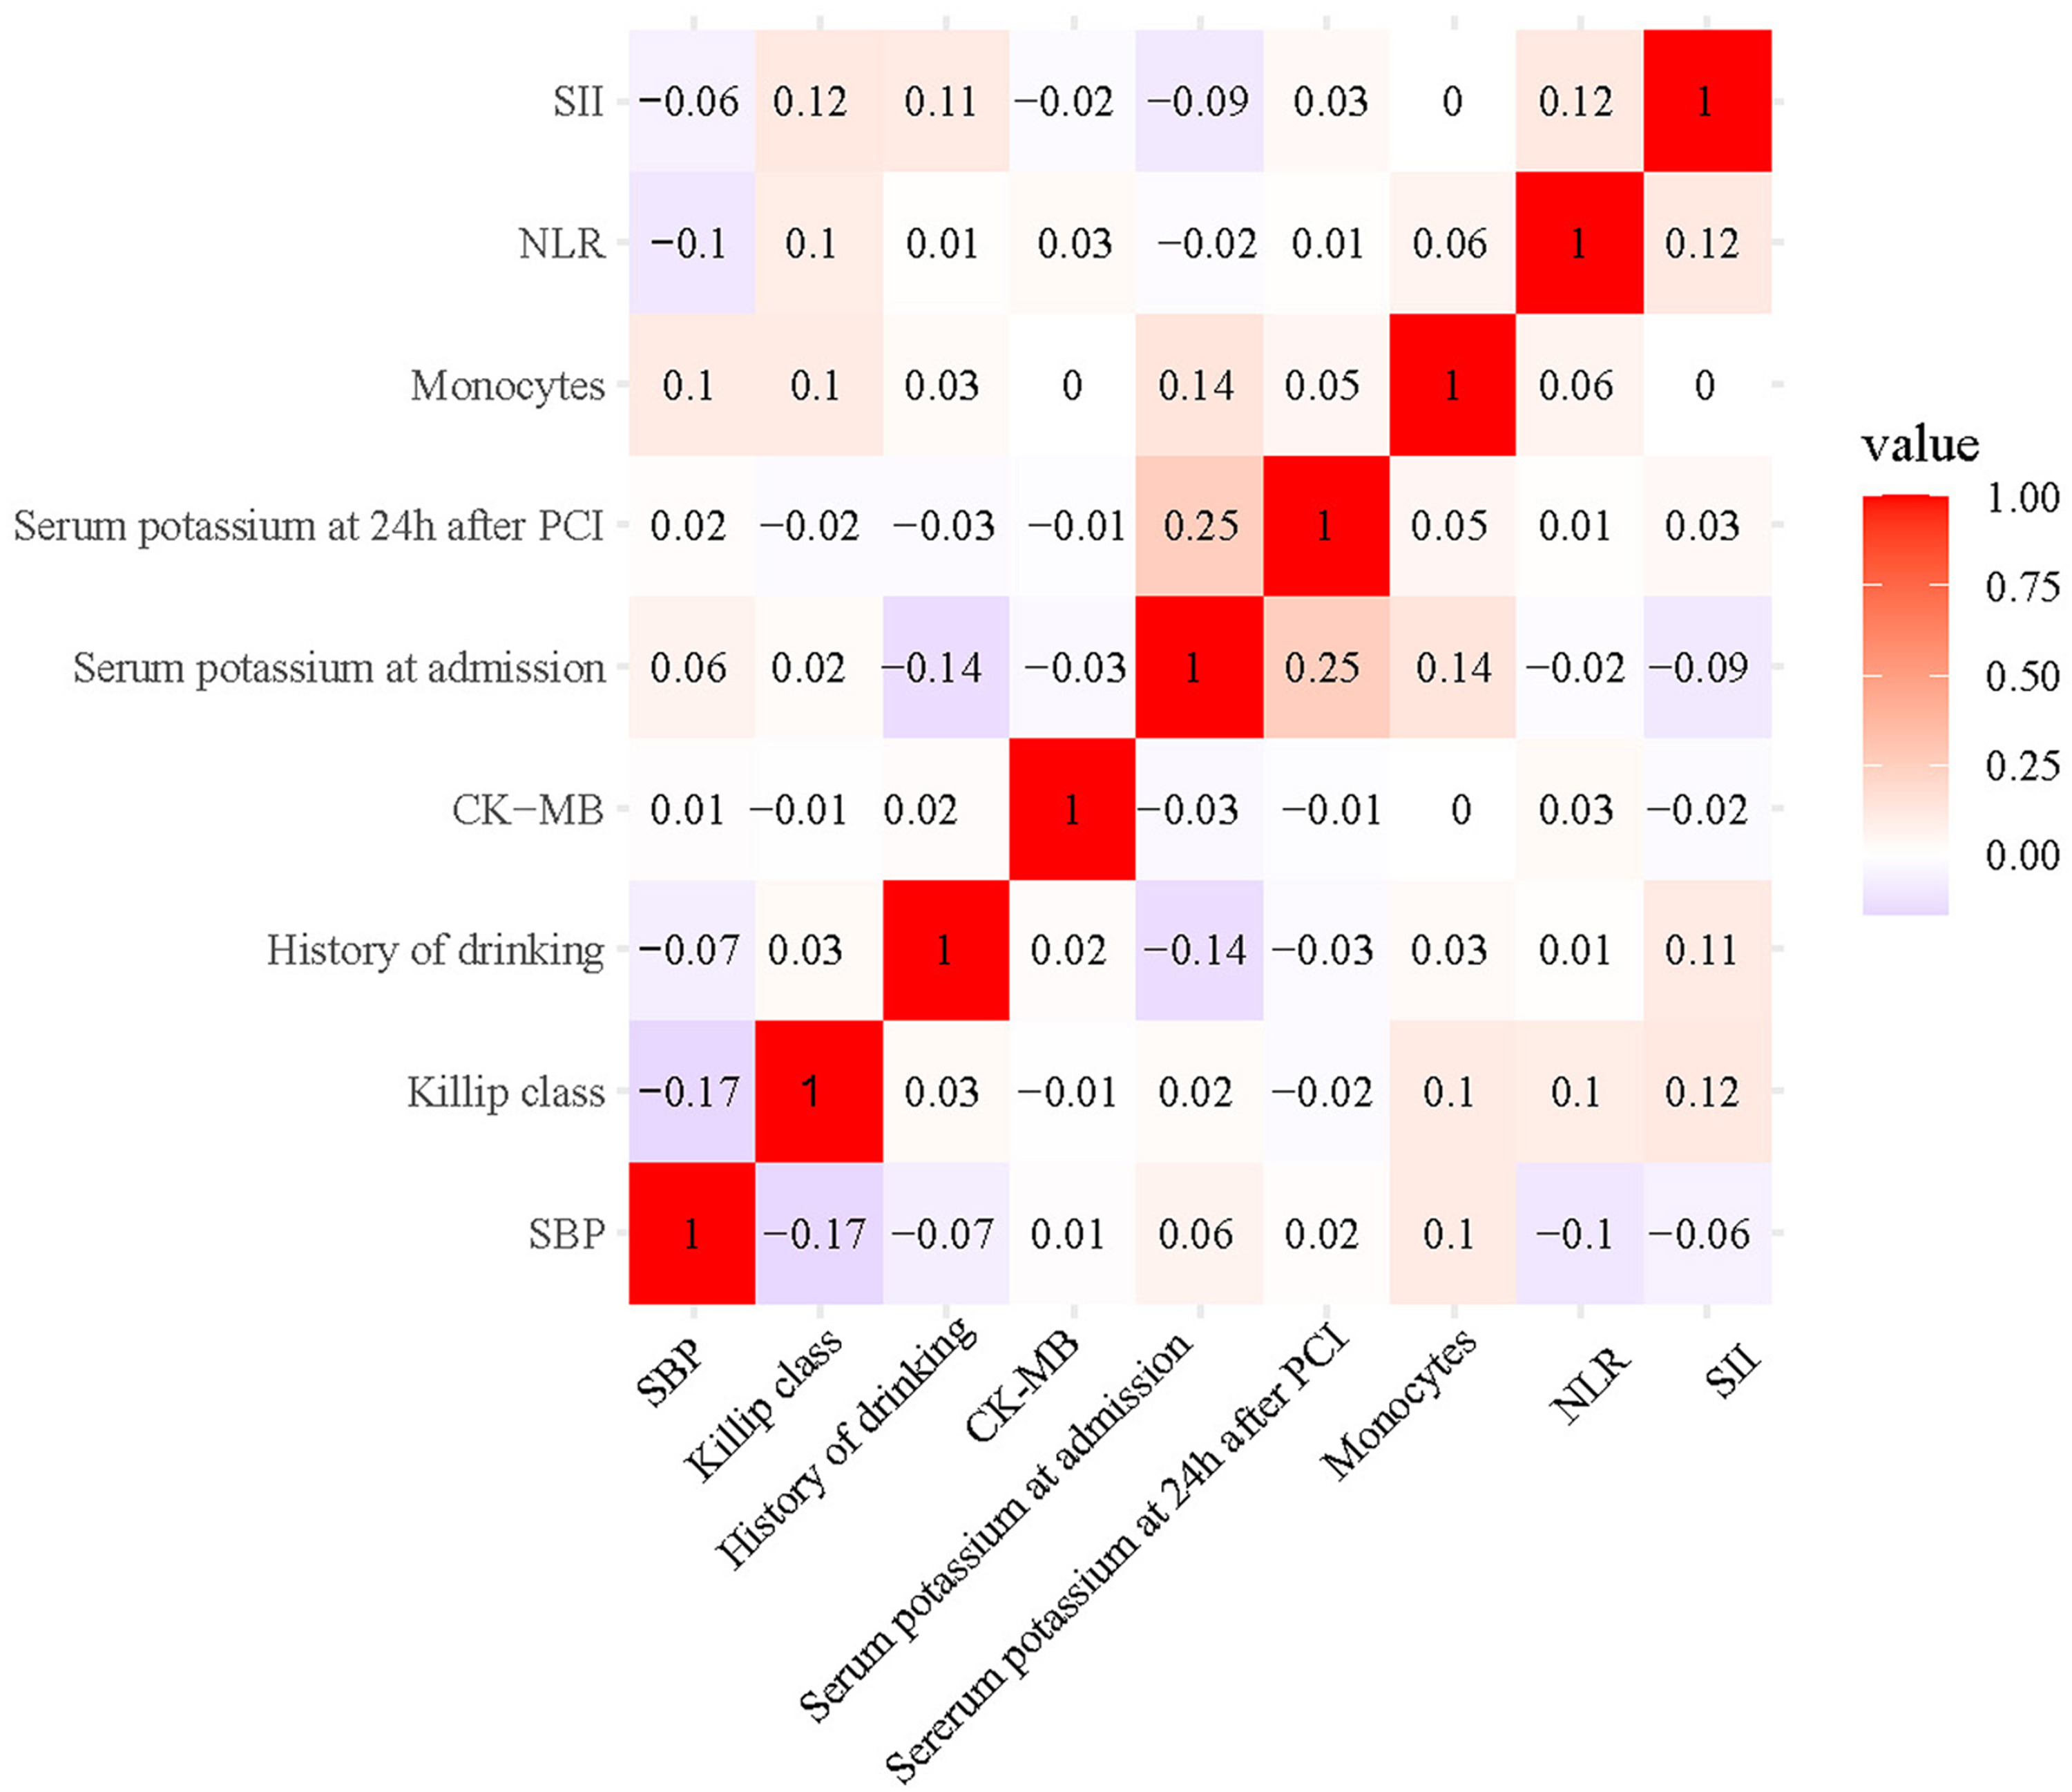
Correlation Heatmap of Variables.
Validation of Variables in LASSO Regression Using Multivariable Logistic Analysis.

Lambda.1se, among all lambda values, the lambda value of the simplest model within a variance of the mean value of the minimum target parameter is obtained; LASSO, least absolute shrinkage and selection operator; OR, odds ratio; CI; confidence interval; SBP, systolic blood pressure; LVEF, left ventricular ejection fraction; CK-MB: creatine kinase-MB; PCI, percutaneous coronary intervention; NLR, neutrophil-to-lymphocyte ratio; PLR, platelet to lymphocyte ratio; SII, systemic immune-inflammation index.
Model Performance Comparison for MVA Risk Prediction
In evaluating predictive models for in-hospital MVA risk in STEMI patients following emergency PCI, we analyzed four ML classifiers—Logit, SVM, RF, and XGBoost—using three predictor sets: (1) traditional clinical parameters alone, (2) systemic inflammation indices alone, and (3) their combination. Table 4 compares model performance, while Figures 4‐6 present ROC curves, calibration plots, and DCA. Results show that models combining both predictor sets demonstrated superior discriminative ability (AUC: 0.894-0.925) over those using only traditional clinical parameters (AUC: 0.713-0.869) or systemic inflammation indices (AUC: 0.841-0.898). DeLong's test confirmed statistical significance (p < 0.05).

Performance Comparison of ML Classifiers (Logit, SVM, RF, XGBoost) Using Traditional Clinical Data: (A) ROC Curves, (B) Calibration Plots, and (C) DCA. The ROC-AUC Values were 0.806, 0.713, 0.869, and 0.863, Respectively. ML, Machine Learning; ROC, Receiver Operating Characteristic; AUC, Area under the Curve; DCA, Decision Curve Analysis; Logit, Logistic Regression; SVM, Support Vector Machine; RF, Random Forest; XGBoost, Extreme Gradient Boosting.

Performance Evaluation of ML Classifiers (Logit, SVM, RF, XGBoost) Using Systemic Inflammation Indices: (A) ROC Curves, (B) Calibration Plots, and (C) DCA. The ROC-AUC Values Were 0.841, 0.857, 0.898, and 0.884, Respectively. ML, Machine Learning; ROC, Receiver Operating Characteristic; AUC, Area Under the Curve; DCA, Decision Curve Analysis; Logit, Logistic Regression; SVM, Support Vector Machine; RF, Random Forest; XGBoost, Extreme Gradient Boosting.
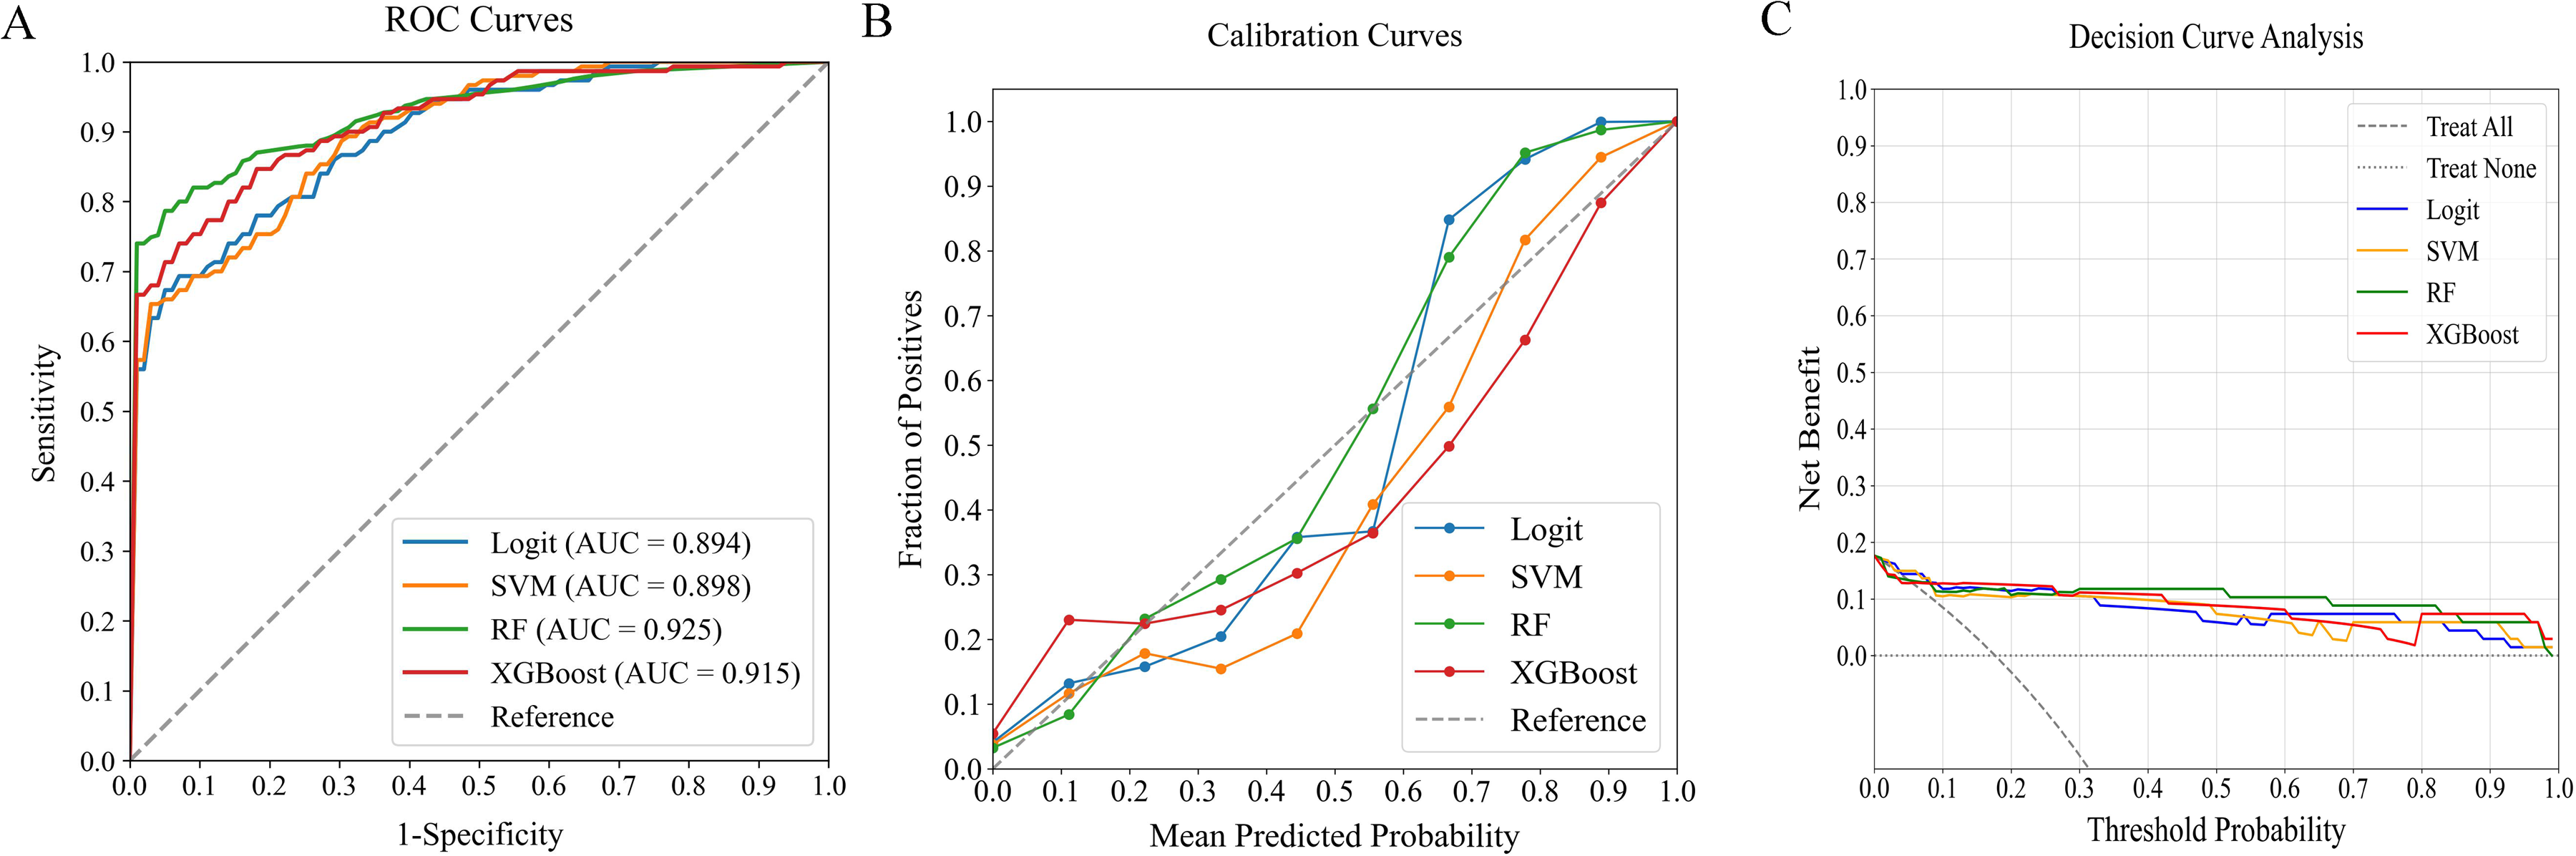
Performance Comparison of ML Classifiers (Logit, SVM, RF, XGBoost) Using Combined Traditional Clinical Data and Systemic Inflammation Indices: (A) ROC Curves, (B) Calibration Plots, and (C) DCA. The ROC-AUC Values Were 0.894, 0.898, 0.925, and 0.915, Respectively. ML, Machine Learning; ROC, Receiver Operating Characteristic; AUC, Area Under the Curve; DCA, Decision Curve Analysis; Logit, Logistic Regression; SVM, Support Vector Machine; RF, Random Forest; XGBoost, Extreme Gradient Boosting.
ML Model Performance in Predicting Post-PCI MVA Risk in STEMI Patients: Traditional Clinical Parameters Versus Systemic Inflammation Markers Versus Combined Datasets.

ML, machine learning; PCI, percutaneous coronary intervention; MVA, malignant ventricular arrhythmias; STEMI, ST-segment elevation myocardial infarction; AUC, area under the curve; Logit, logistic regression; SVM, support vector machine; RF, random forest; XGBoost, extreme gradient boosting.
Among the combined models, RF outperformed others, achieving the highest AUC of 0.925 and demonstrating excellent calibration, particularly near the 55% threshold. DCA further validated the consistent performance across all models. RF demonstrated robust performance across all critical metrics, such as precision, recall, F1 score, and Brier score, solidifying its position as the optimal model for predicting in-hospital MVA risk in STEMI patients after emergency PCI.
Temporal Validation of ML Model
The RF model's predictive performance for in-hospital MVA risk was rigorously evaluated in the temporal validation cohort using ROC, calibration, and DCA analyses (Figure 7). While performance slightly declined compared to the training cohort, the model retained strong discriminative ability, achieving an AUC of 0.899 (Figure 7A). The calibration curve revealed strong alignment between predicted risks and observed outcomes (Figure 7B). Additionally, the DCA curve highlighted significant net benefits, further validating the model's effectiveness (Figure 7C). These results emphasize the RF model's robustness and clinical utility for predicting in-hospital MVA risk.

Evaluating the Optimal ML Model's Predictive Performance with an External Validation Cohort: (A) ROC Curve (AUC = 0.899), (B) Calibration Curve, and (C) DCA. ML, Machine Learning; ROC, Receiver Operating Characteristic; AUC, Area Under the Curve; DCA, Decision Curve Analysis.
Interpretation of the Model
SHAP analysis was used to assess the influence of individual features in the RF model by computing their absolute mean SHAP values. This approach identified the top five predictive features: three clinical parameters and two systemic inflammation indices (Figure 8). The SHAP summary plot (Figure 8A) assigns a data point to each feature per patient, with yellow indicating higher values and blue representing lower ones. The horizontal axis represents SHAP values, with larger shapes indicating features of higher importance in predicting in-hospital MVA risk for STEMI patients following emergency PCI. The importance bar chart (Figure 8B) ranks the variables by their impact on prognosis prediction, with key features being: SII, CK-MB, NLR, Killip class, and serum potassium at admission.
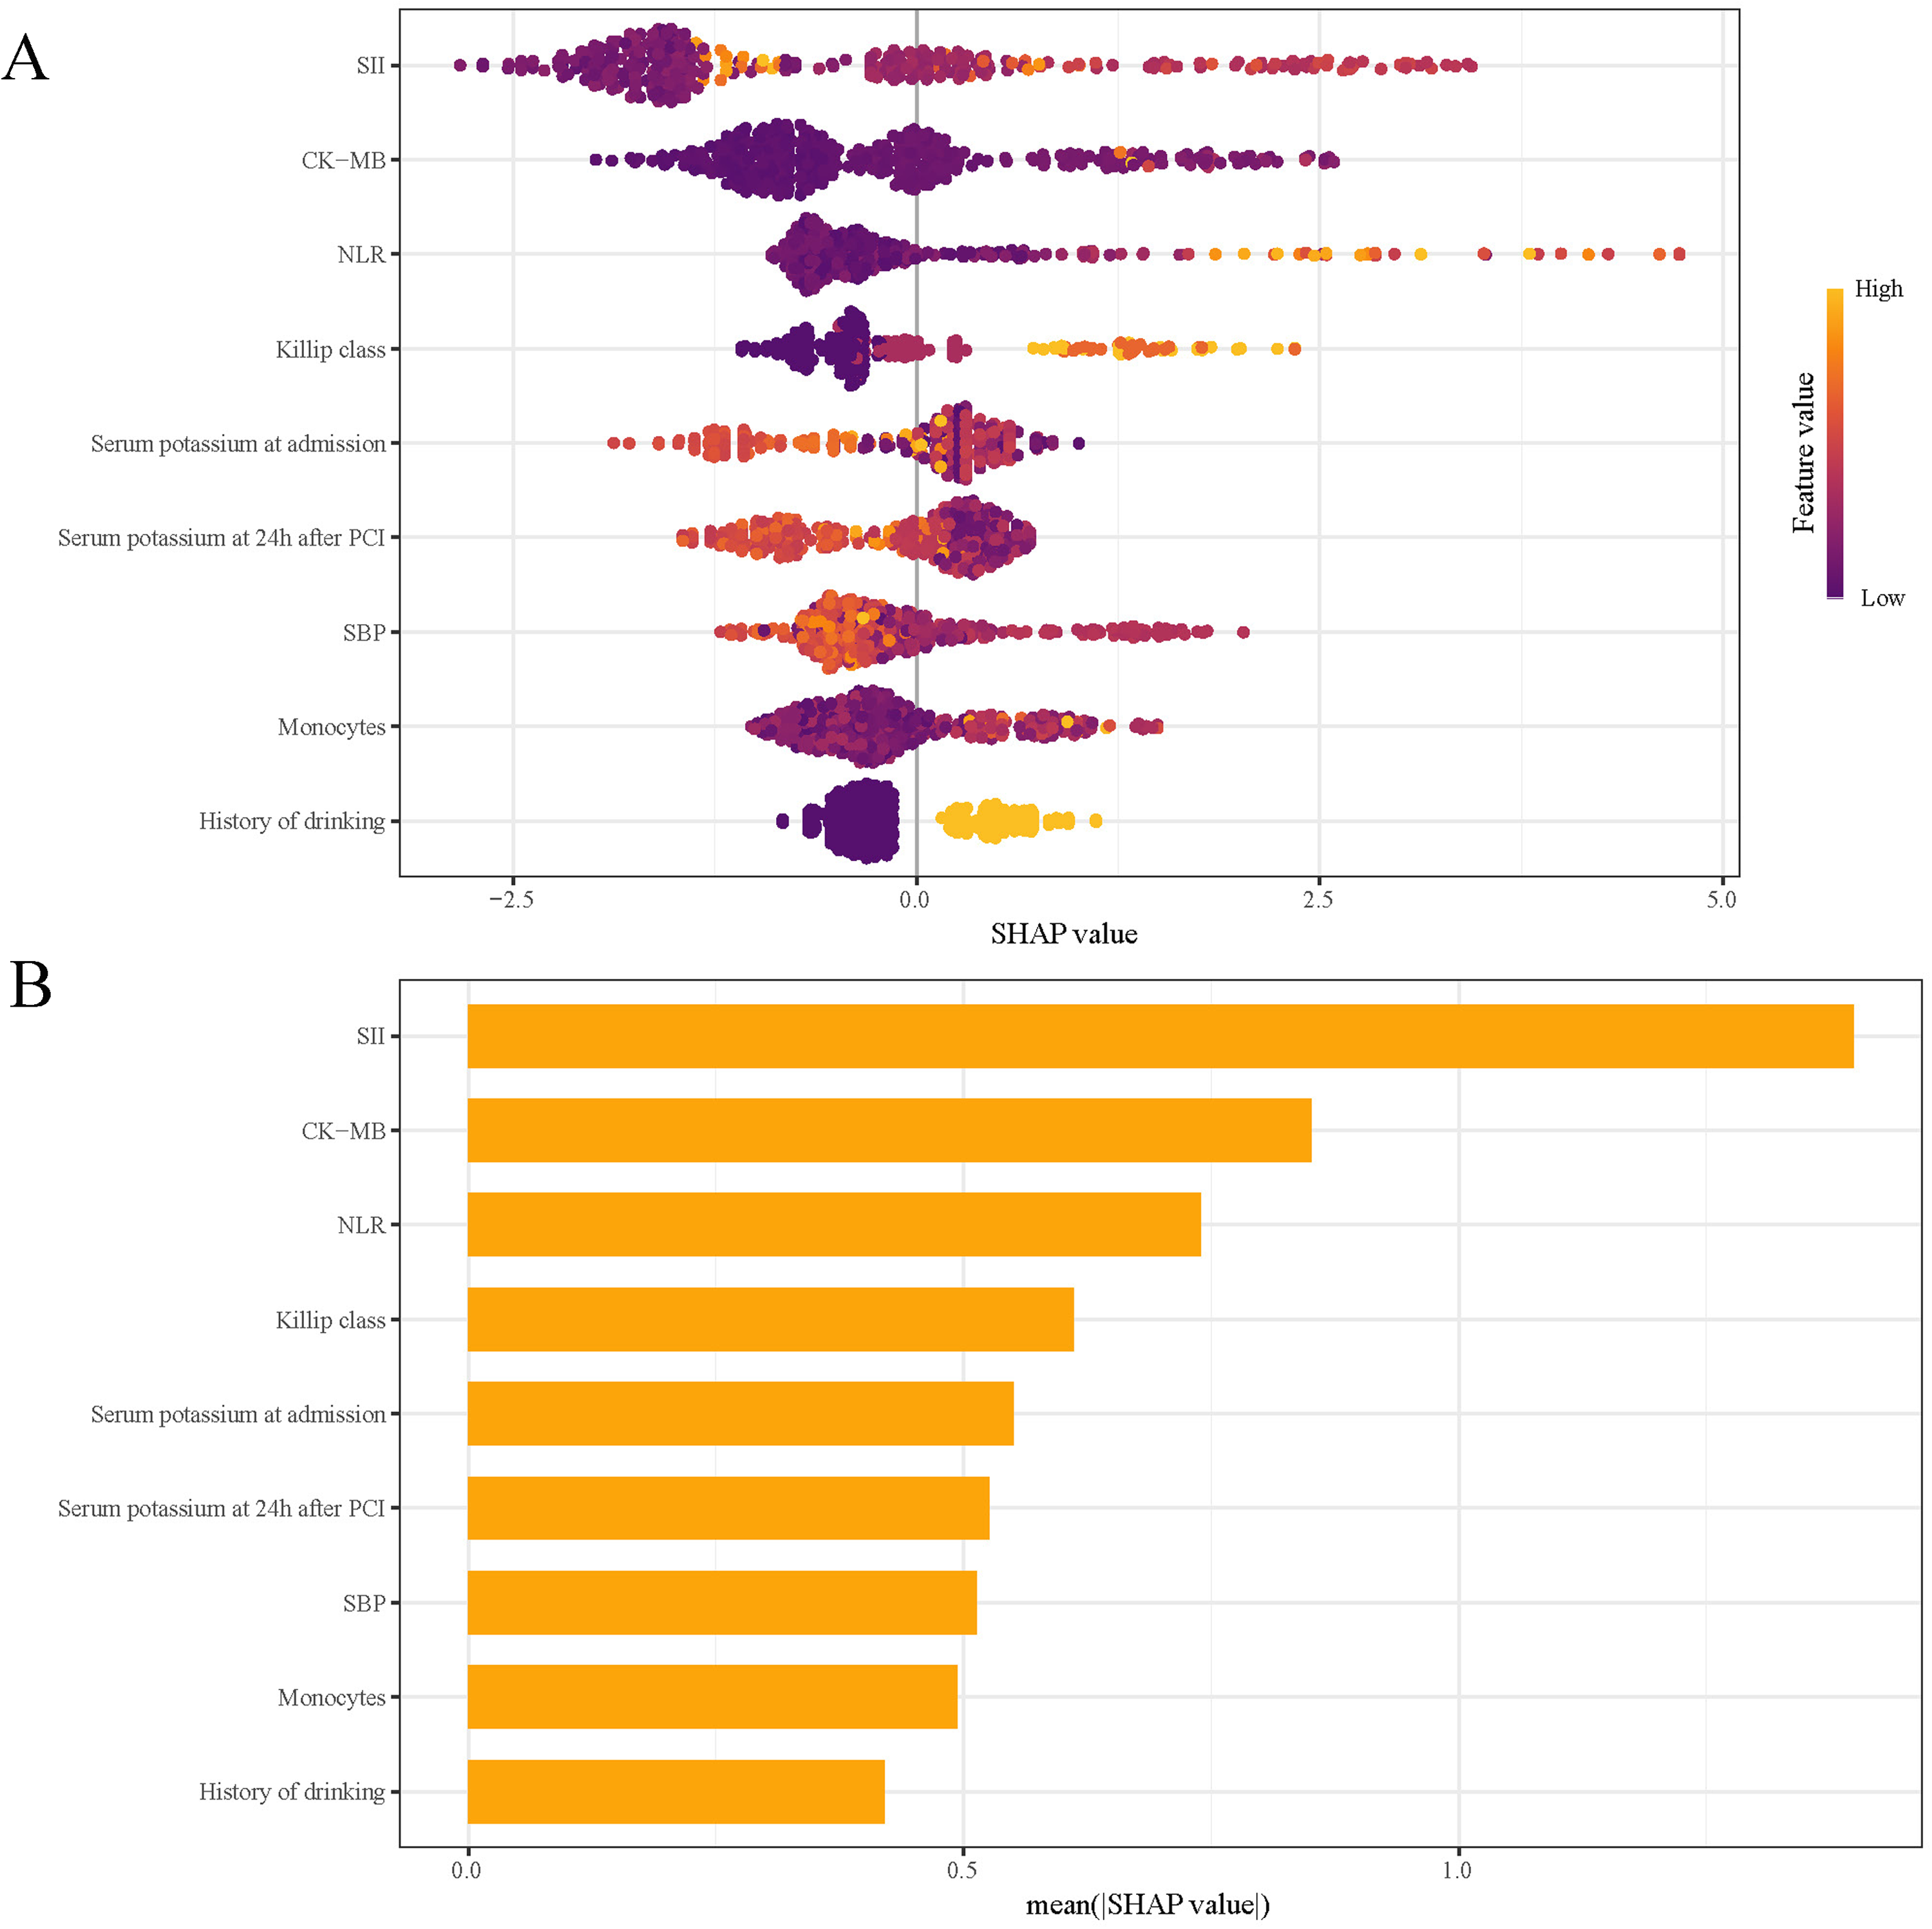
SHAP Analysis of the RF Model for MVA Prediction: (A) Summary Plot and (B) Feature Importance Ranking. SHAP, Shapley Additive Explanations; RF, Random Forest; MVA, Malignant Ventricular Arrhythmias; SII, Systemic immune-inflammation Index; CK-MB: Creatine Kinase-MB; NLR, Neutrophil to Lymphocyte Ratio; SBP, Systolic Blood Pressure.
To further investigate the most influential inflammatory markers, we analyzed SHAP dependence plots for SII and NLR (Figure 9A-B). These plots demonstrate their predictive influence on outcomes, where positive SHAP values correlate with increased in-hospital MVA risk in post-PCI STEMI patients. The analysis identified high-risk thresholds of 1015.52 for SII and 5.20 for NLR. Univariable logistic regression revealed that SII≥1015.52 and NLR ≥ 5.20 were statistically significant in the overall cohort (Table 5).
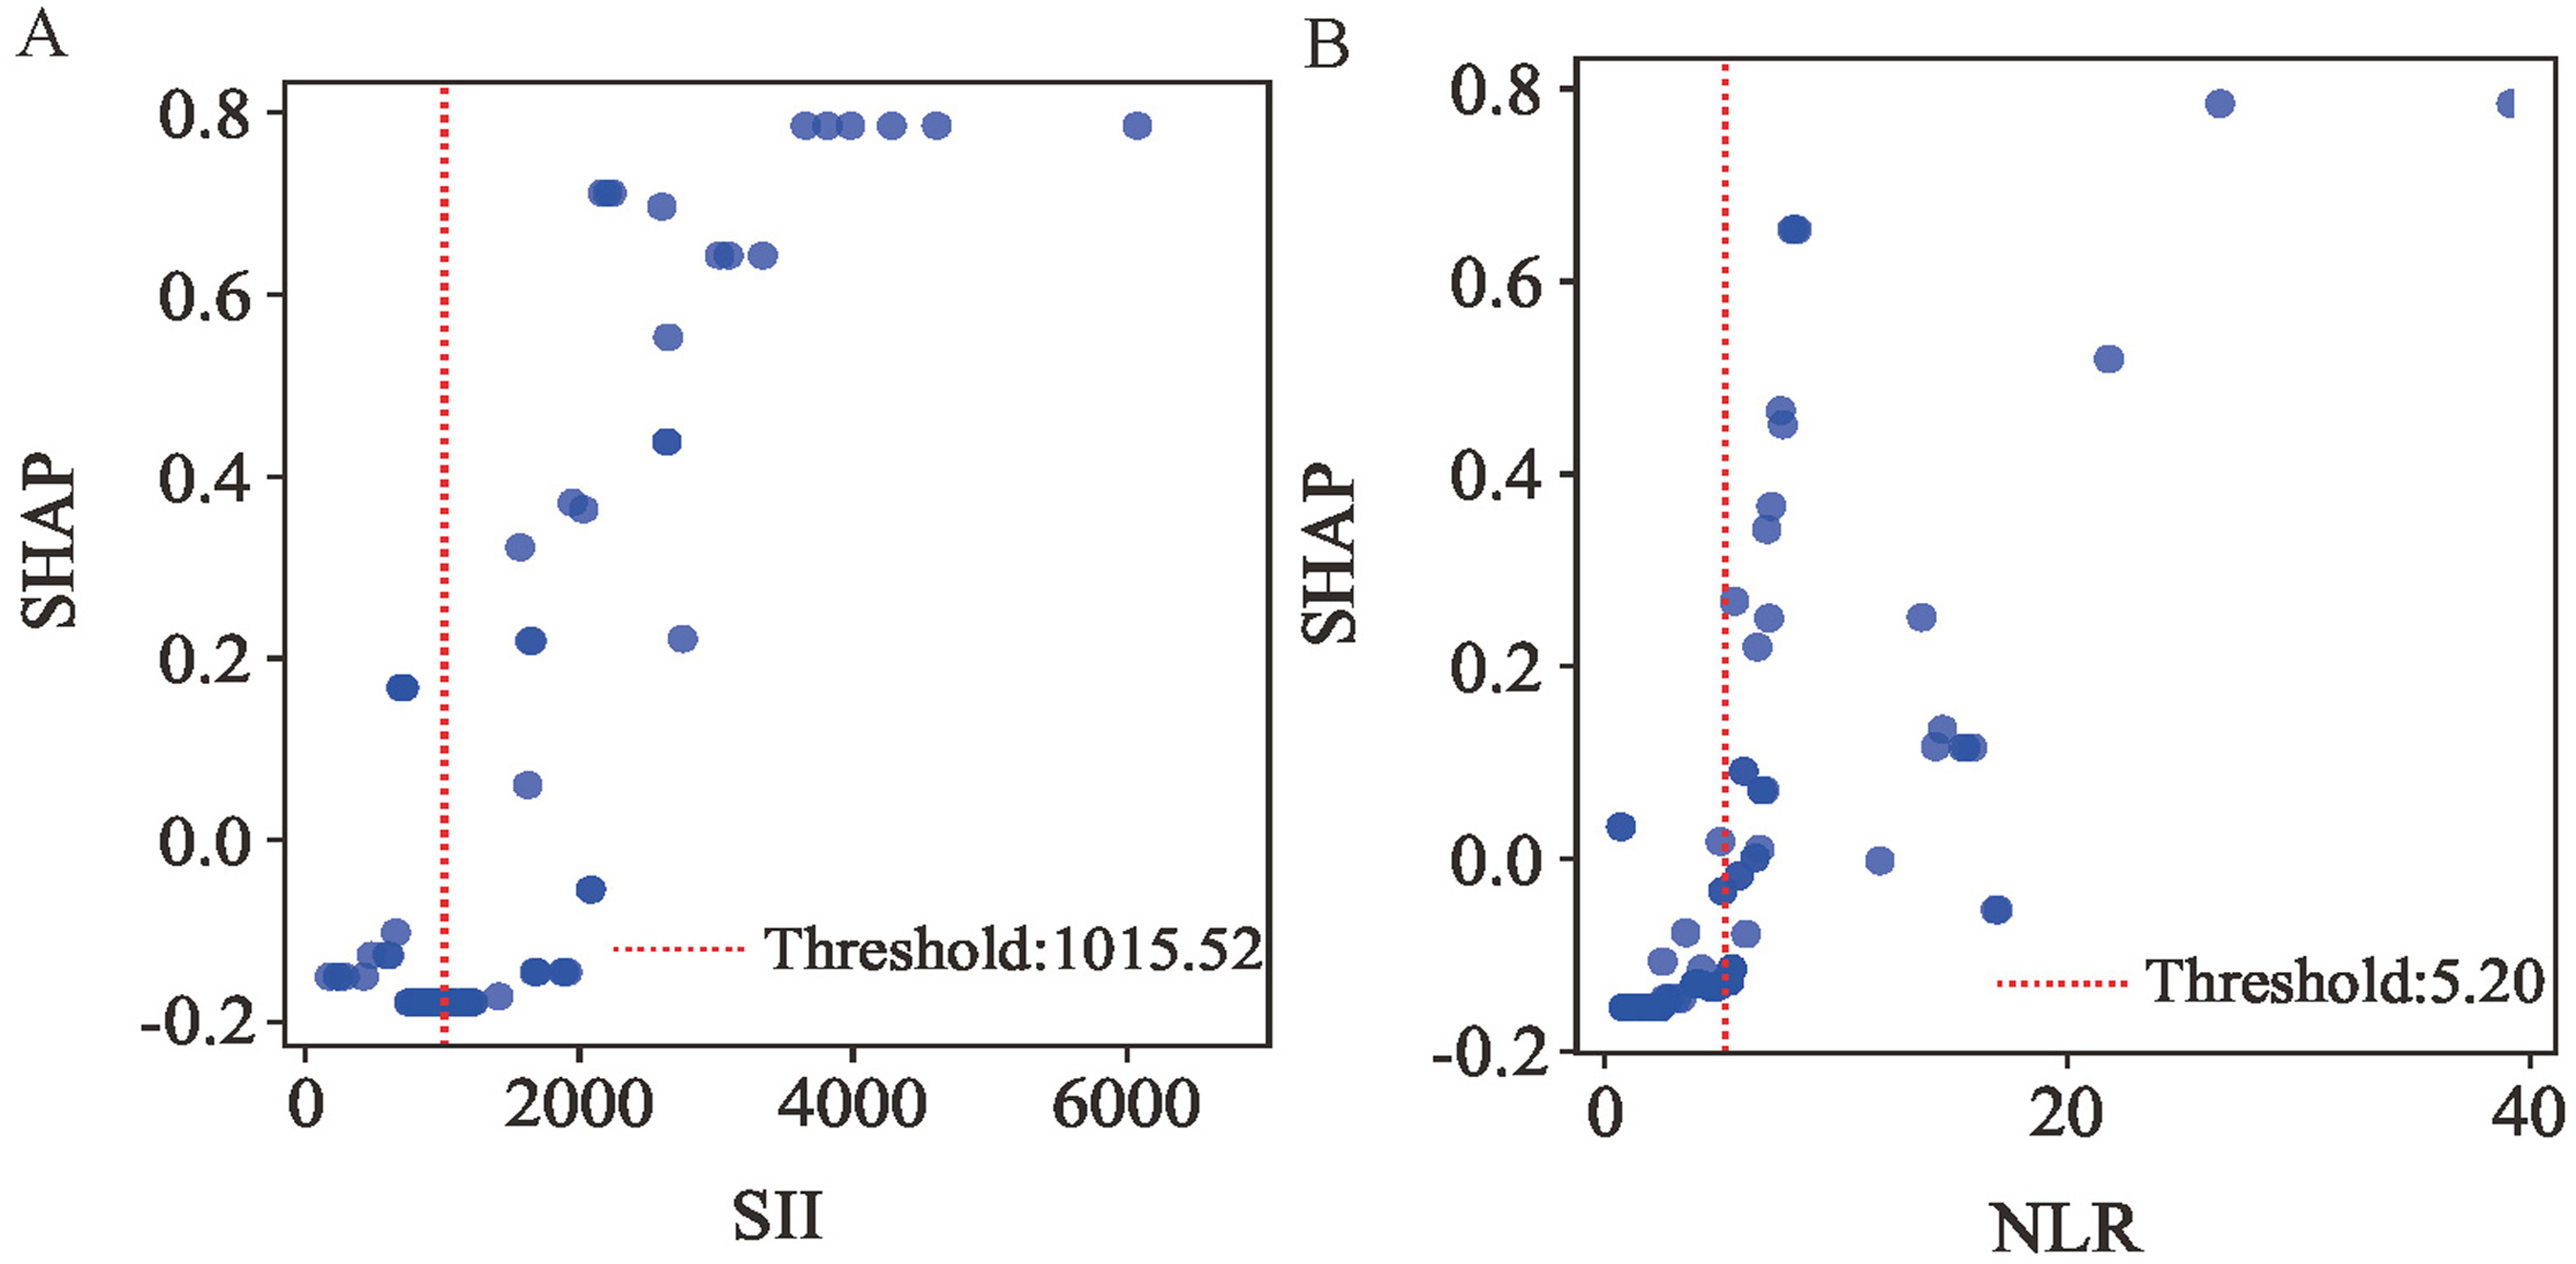
SHAP Dependency Plot of the RF Model. SHAP, Shapley Additive Explanations; RF, Random Forest; SII, Systemic Immune-Inflammation index; NLR, Neutrophil to Lymphocyte Ratio.
Univariable Logistic Regression Based on High-Risk Thresholds.
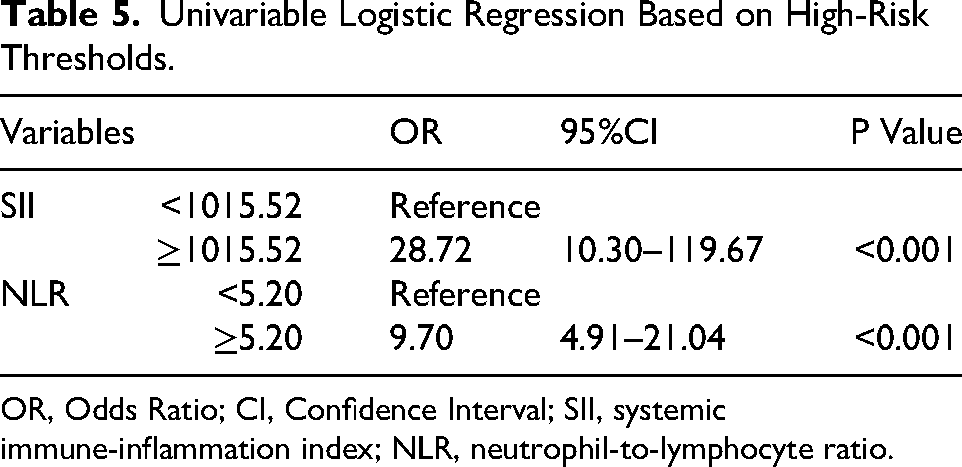
OR, Odds Ratio; CI, Confidence Interval; SII, systemic immune-inflammation index; NLR, neutrophil-to-lymphocyte ratio.
The SHAP force plot (Figure 10) illustrates how features impact individual patient outcomes. Risk-enhancing factors (yellow) and protective factors (red) are displayed proportionally to their impact magnitude, with wider bands indicating stronger effects. The function f(x) aggregates SHAP values per patient, with the base value reflecting the mean SHAP value across the entire cohort. The upper panel demonstrates a precise prediction of in-hospital MVA risk, driven by factors like elevated NLR and SII levels (Figure 10A). The lower panel, conversely, identifies a patient unlikely to face MVA risk, indicated by a lower NLR, lower Killip class, and other factors (Figure 10B). This method utilizes RF to effectively differentiate patients with MVA from those without, offering personalized risk assessments.
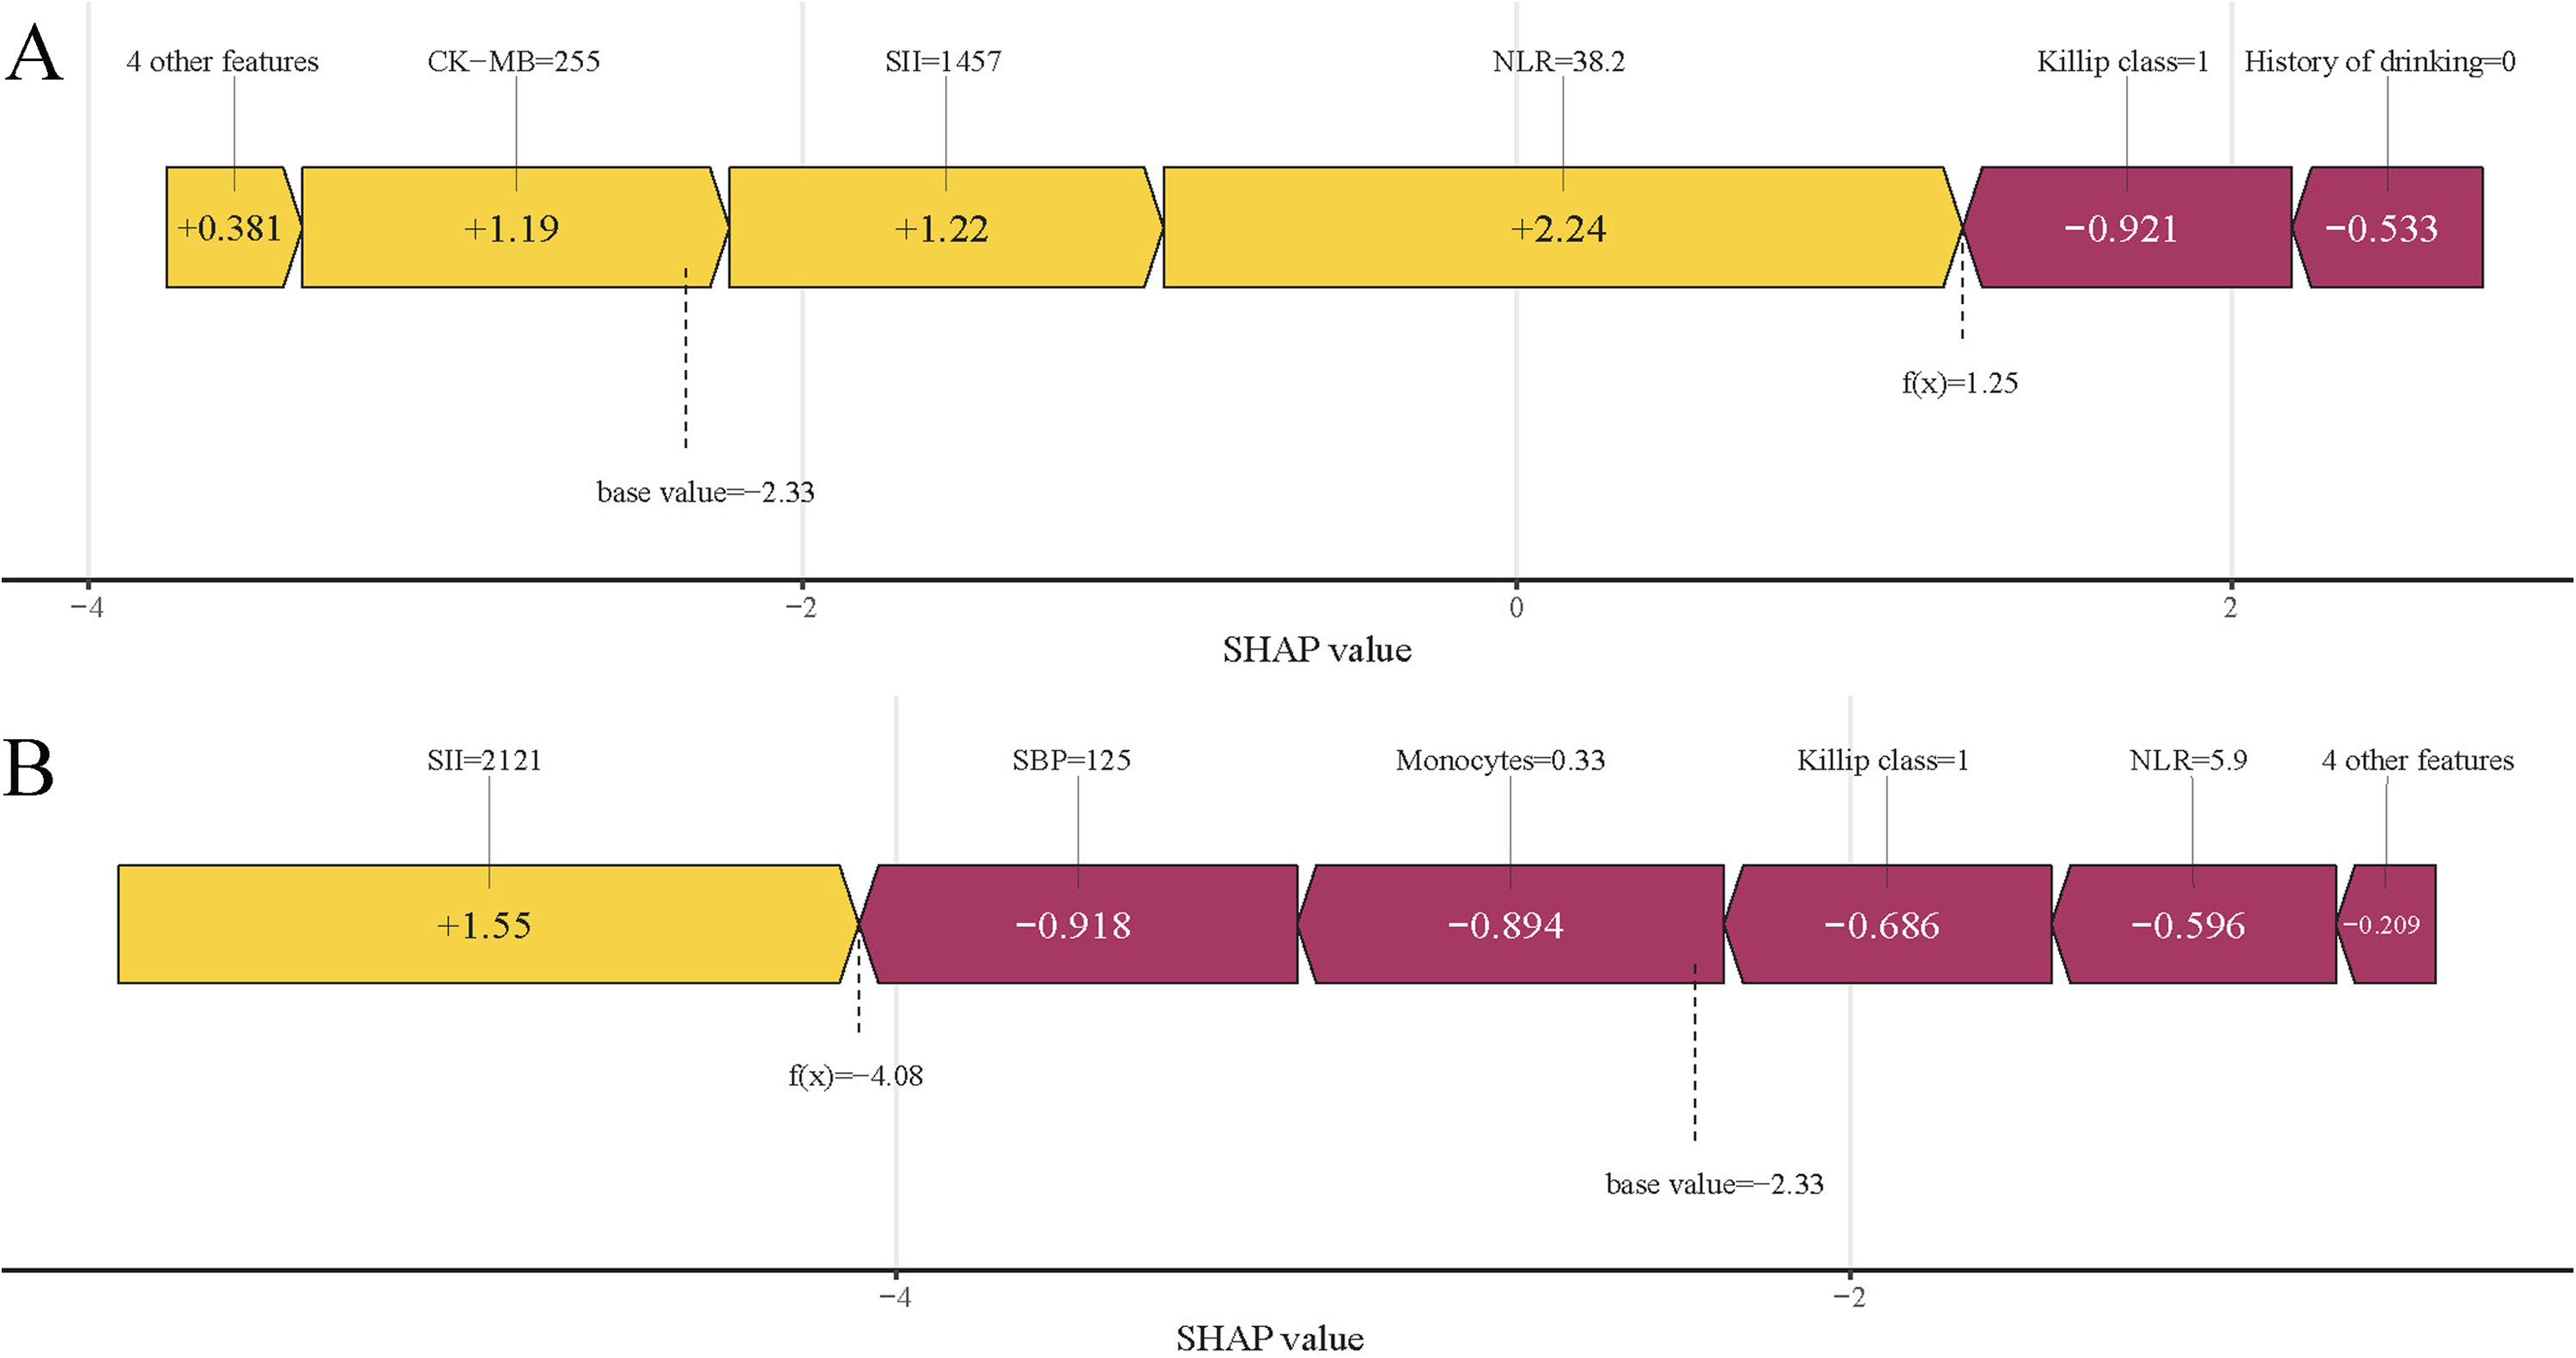
SHAP Force Plots Demonstrating Individual Prediction Outcomes: (A) MVA Patient and (B) non-MVA Patient. SHAP, Shapley Additive Explanations; MVA, Malignant Ventricular Arrhythmias; SBP, Systolic Blood Pressure; SII, Systemic Immune-inflammation Index; NLR, Neutrophil to Lymphocyte Ratio.
Clinical Application of A Predictive Model
The optimal prediction model was deployed as a web application for clinical use. Clinicians can input the nine key features to automatically obtain the predicted risk of in-hospital MVA in post-PCI STEMI patients (Figure 11). The web application's full source code and deployment documentation are provided in

Web Application for Predicting in-Hospital MVA post-PCI in STEMI Patients: User Interface and Prediction Display. MVA, Malignant Ventricular Arrhythmias; PCI, Percutaneous Coronary Intervention; STEMI, ST-Segment Elevation Myocardial Infarction; SBP, Systolic Blood Pressure; NLR, Neutrophil to Lymphocyte Ratio; SII, Systemic Immune-Inflammation index.
Discussion
PCI effectively restores myocardial perfusion and improves STEMI prognosis; however, post-procedural MVA remains a critical concern. As a severe complication of STEMI, MVA can severely disrupt hemodynamic stability and may ultimately lead to in-hospital sudden cardiac death in severe cases. 27 Systemic inflammation indices reliably reflect inflammatory status and disease activity, potentially correlating with arrhythmia development. 15 However, current predictive models often overlook key markers (eg, PLR, LMR, SII) and rely on traditional linear methods rather than advanced ML approaches. 28 To address this gap, we implemented four ML algorithms that integrate traditional clinical parameters with systemic inflammatory indices, either individually or in combination. Among these, the RF algorithm demonstrated optimal performance, effectively predicting in-hospital MVA risk in STEMI patients following primary PCI. SHAP analysis enhanced the interpretability of the model, particularly in elucidating the role of systemic inflammation in MVA development. Our study advances the use of ML by combining traditional clinical and systemic inflammatory biomarkers for early MVA risk prediction, facilitating timely clinical intervention.
We chose ML models for their ability to capture complex, non-linear relationships, which outperform traditional linear methods. 29 The integrated models, which incorporate both clinical indicators and systemic inflammation indices, were most effective in predicting in-hospital MVA risk, capturing a broader range of influential factors and significantly improving predictive accuracy.
Among the models, the RF algorithm demonstrated superior performance by combining clinical indicators and systemic inflammation indices, achieving high predictive accuracy, validated externally. This approach advances prior studies: (1) Liang Wang et al's linear model for post-PCI MVA prediction in STEMI patients using conventional and partial inflammatory markers 28 ; (2) Wei Wang et al's ventricular arrhythmia risk model based on cardiac parameters (systolic pressure, hypertension, LVEF) 30 ; and (3) Zhifang Qin et al's nomogram for predicting intraoperative reperfusion arrhythmia during PCI in elderly patients with acute coronary syndrome, incorporating independent factors like the number of vessels, pre-infarction angina, and time from onset to PCI. 31 In contrast, our study employs ML to analyze a comprehensive panel of systemic inflammation indices, such as PLR, LMR, and SII, significantly improving predictive precision. SHAP analysis further enhanced model interpretability. The SHAP feature importance plot visualizes each feature's contribution, highlighting its magnitude and direction (positive/negative impact). Higher SHAP values signify greater influence, aiding in identifying key predictors and optimizing feature selection.32-34 Our SHAP analysis identified the top five predictors of in-hospital MVA: two systemic inflammation indices (SII, NLR) and three clinical markers (CK-MB, serum potassium at admission, Killip class). Neutrophils mediate inflammation, 35 while lymphocytes regulate inflammatory responses and influence atherosclerosis. 36 Platelets contribute not only to thrombosis but also drive inflammation and atherosclerotic plaque formation, promoting lesion progression and atherothrombosis. 37 The NLR, derived from routine complete blood counts, serves as a cost-effective and readily available systemic inflammation marker. By integrating these two key inflammatory parameters, NLR provides a balanced measure of systemic inflammation that overcomes the limitations of individual cell counts. 38 As an established prognostic indicator for cardiovascular diseases (including ventricular arrhythmias, heart failure, and coronary artery disease), elevated NLR consistently predicts worse clinical outcomes.39,40 Notably, NLR independently associates with poor outcomes in myocardial infarction (MI) patients post-PCI.41,42 Similarly, the SII, calculated as (platelets × neutrophils)/lymphocytes, has emerged as a valuable tool for assessing inflammatory state. 43 Like NLR, SII is easily accessible and cost-effective, permitting serial measurements to monitor inflammatory trends. The SII has been applied in various clinical contexts, including cancer prognosis prediction44-47 and cardiovascular medicine, where it helps identify high-risk patients undergoing PCI, 48 assess the severity of coronary artery disease, predict clinical outcomes, and evaluate the risk of atrial fibrillation and arrhythmia in patients with implantable cardioverter-defibrillator. Our study demonstrated that elevated NLR and SII levels correlate with in-hospital MVA in STEMI patients post-PCI. These composite indices, being more resilient to physiological and pathological variations than individual cell counts (neutrophils, lymphocytes, monocytes, or platelets),49,50 offer superior predictive value. SII proves particularly advantageous by capturing the dynamic interplay among platelets, neutrophils, and lymphocytes, 51 providing a more robust measure of inflammation-MVA relationships than either NLR or PLR alone. SII ≥1015.52 and NLR ≥5.20 could identify patients at high risk of MVA, supporting targeted preventive strategies. These may include intensive monitoring, early electrolyte correction, and interventions to reduce systemic inflammation—such as anti-inflammatory therapy or lifestyle modification. Incorporating these markers into clinical practice could enable earlier, personalized management for high-risk patients. Our results also support Nienhuis et al's finding that CK-MB predicts myocardial injury severity and prognosis in MI patients. 52 Additionally, early MI is frequently associated with electrolyte imbalances, especially hypokalemia. Furthermore, early MI is often linked to electrolyte imbalances, especially hypokalemia. Serum potassium is vital for myocardial cell function, and hypokalemia disrupts membrane potentials, significantly increasing the risk of life-threatening arrhythmias.53-56 The Killip classification evaluates heart failure severity after acute MI. 57 Higher Killip classes are associated with more severe coronary artery disease, larger infarct areas, and extensive myocardial necrosis replaced by irreversible fibrotic scars. These pathological changes collectively impair cardiac contractility, disrupt electrical stability, and increase arrhythmia risk, ultimately worsening clinical outcomes.58,59 Our study found that STEMI patients with MVA had higher CK-MB levels, lower admission serum potassium, and higher Killip classes, consistent with previous findings. Furthermore, Wang et al 30 identified LVEF as an independent predictor of ventricular arrhythmias post-PCI in acute myocardial infarction patients, where lower LVEF reflects larger infarct size. Consistent with previous reports, STEMI patients with larger infarcts demonstrate increased ventricular arrhythmia risk, mediated by infarct-induced ventricular dilatation and remodeling that create arrhythmogenic substrates through mechanical and electromechanical effects.60-63 Although clinically relevant, LVEF did not reach statistical significance in our multivariate analysis (P = 0.10), a discrepancy potentially attributable to limited sample size reducing statistical power. Future models could incorporate echocardiographic data, for example through deep learning–based image analysis, to enhance predictive performance. SHAP analysis in the RF model clarified the influence of predictive factors, significantly enhancing MVA risk stratification. Integrating ML into this framework enables early interventions, improving outcomes for STEMI patients.
While our study demonstrated promising results, three key limitations warrant consideration. First, the single-center design and relatively small sample size may introduce ethnic and regional biases, potentially limiting the generalizability. Additionally, institutional variations in laboratory protocols and equipment may influence the absolute values of inflammatory indices (particularly NLR and SII). Moreover, the region-specific patient cohort with its distinct comorbidity patterns may further limit population-wide applicability. Second, the retrospective nature of the study and exclusion of patients lacking complete clinical records could introduce additional selection bias. Third, while temporal validation confirmed the model's time-stability, it could not evaluate generalizability across diverse geographic and demographic populations. Nonetheless, our work underscores the clinical potential of ML models that combine traditional clinical indicators with systemic inflammation indices for in-hospital MVA prediction. Future research should prioritize large-scale, multicenter prospective studies employing standardized laboratory protocols and encompassing diverse populations and geographic regions to enhance model reliability and generalizability. We strongly support validating our findings in various populations to strengthen and broaden the applicability of our results. These efforts are essential for a comprehensive understanding of the phenomenon across different ethnic and regional settings.
In conclusion, our RF model effectively predicts in-hospital MVA post-PCI in STEMI patients by integrating traditional clinical indicators and systemic inflammation indices. While the study's single-center retrospective design and limited small sample size may introduce potential ethnic, regional, and selection biases, the model nonetheless provides clinically valuable risk stratification. This enables timely identification of high-risk patients for preventive interventions. Although temporal validation offers a reasonable compromise, the lack of an external hospital dataset limits generalizability. Future work should pursue multicenter validation through larger prospective studies involving more diverse populations and regions to strengthen reliability and expand applicability.
Supplemental Material
sj-pdf-1-cat-10.1177_10760296251375795 - Supplemental material for Interpretable Machine Learning Models for Predicting Malignant Ventricular Arrhythmia in Patients with Acute ST-Segment Elevation Myocardial Infarction Based on Systemic Inflammation Index
Supplemental material, sj-pdf-1-cat-10.1177_10760296251375795 for Interpretable Machine Learning Models for Predicting Malignant Ventricular Arrhythmia in Patients with Acute ST-Segment Elevation Myocardial Infarction Based on Systemic Inflammation Index by Jiangchuan Han, Guoliang Yuan, Wei Li, Tao Li, Liting Yang and Junming Chen in Clinical and Applied Thrombosis/Hemostasis
Supplemental Material
sj-pdf-2-cat-10.1177_10760296251375795 - Supplemental material for Interpretable Machine Learning Models for Predicting Malignant Ventricular Arrhythmia in Patients with Acute ST-Segment Elevation Myocardial Infarction Based on Systemic Inflammation Index
Supplemental material, sj-pdf-2-cat-10.1177_10760296251375795 for Interpretable Machine Learning Models for Predicting Malignant Ventricular Arrhythmia in Patients with Acute ST-Segment Elevation Myocardial Infarction Based on Systemic Inflammation Index by Jiangchuan Han, Guoliang Yuan, Wei Li, Tao Li, Liting Yang and Junming Chen in Clinical and Applied Thrombosis/Hemostasis
Supplemental Material
sj-pdf-3-cat-10.1177_10760296251375795 - Supplemental material for Interpretable Machine Learning Models for Predicting Malignant Ventricular Arrhythmia in Patients with Acute ST-Segment Elevation Myocardial Infarction Based on Systemic Inflammation Index
Supplemental material, sj-pdf-3-cat-10.1177_10760296251375795 for Interpretable Machine Learning Models for Predicting Malignant Ventricular Arrhythmia in Patients with Acute ST-Segment Elevation Myocardial Infarction Based on Systemic Inflammation Index by Jiangchuan Han, Guoliang Yuan, Wei Li, Tao Li, Liting Yang and Junming Chen in Clinical and Applied Thrombosis/Hemostasis
Supplemental Material
sj-docx-4-cat-10.1177_10760296251375795 - Supplemental material for Interpretable Machine Learning Models for Predicting Malignant Ventricular Arrhythmia in Patients with Acute ST-Segment Elevation Myocardial Infarction Based on Systemic Inflammation Index
Supplemental material, sj-docx-4-cat-10.1177_10760296251375795 for Interpretable Machine Learning Models for Predicting Malignant Ventricular Arrhythmia in Patients with Acute ST-Segment Elevation Myocardial Infarction Based on Systemic Inflammation Index by Jiangchuan Han, Guoliang Yuan, Wei Li, Tao Li, Liting Yang and Junming Chen in Clinical and Applied Thrombosis/Hemostasis
Footnotes
Ethical Considerations
This study, approved by the medical ethics committee of Shuyang Hospital of Traditional Chinese Medicine (No. 2025005), adhered to the Declaration of Helsinki.
Informed Consent
Informed consent was obtained from all participants or their family members.
Author Contributions
Jiangchuan Han: Conception and design; Analysis and interpretation of data; Writing, review, and/or revision of the manuscript.
Guoliang Yuan: Study supervision.
Wei Li: Writing, review, and/or revision of the manuscript.
Tao Li: Analysis and interpretation of data.
Liting Yang: Development of methodology.
Junming Chen: Acquisition of data.
Funding
The authors received no financial support for the research, authorship, and/or publication of this article.
Declaration of Conflicting Interests
The authors declared no potential conflicts of interest with respect to the research, authorship, and/or publication of this article.
Data Availability Statement
All data supporting this study are included in the article, and additional inquiries can be addressed to the corresponding author.
Supplemental Material
Supplemental material for this article is available online.
References
Supplementary Material
Please find the following supplemental material available below.
For Open Access articles published under a Creative Commons License, all supplemental material carries the same license as the article it is associated with.
For non-Open Access articles published, all supplemental material carries a non-exclusive license, and permission requests for re-use of supplemental material or any part of supplemental material shall be sent directly to the copyright owner as specified in the copyright notice associated with the article.