
Abstract
Pulmonary embolism (PE) and deep vein thrombosis (DVT) are part of venous thromboembolism (VTE). Since PE can be fatal, early diagnosis in DVT patients is crucial. Diagnosing PE is often difficult due to non-specific symptoms. D-dimer testing is commonly used to exclude PE but is less effective in DVT patients because they generally have elevated D-dimer levels. Additionally, imaging, such as contrast-enhanced CT, may not be feasible for all patients. This study focused on soluble fibrin (SF), an early marker of thrombus formation that reflects thrombin generation, instead of D-dimer. Among 133 acute DVT patients who underwent imaging, 71 had PE (PE group), and 62 did not (no-PE group). All patients, except one patient in the no-PE group, exhibited elevated D-dimer levels, with no significant difference in the proportion of patients with normal D-dimer levels between the groups (P = .466). In contrast, 26 of 62 patients in the no-PE group had normal SF levels, while only 5 of 71 in the PE group showed normal SF levels. The proportion of patients with normal SF was significantly lower in the PE group (P < .0001). Multivariate analysis indicated that normal SF was the only independent factor in excluding PE (OR 8.86, 95%CI 2.94-26.7, P = .0001). These findings suggest that DVT patients with normal SF levels are unlikely to have PE. SF might be more useful than D-dimer in excluding PE and could help reduce unnecessary imaging in DVT patients when used alongside standard diagnostic methods.
Introduction
Pulmonary embolism (PE) and deep vein thrombosis (DVT) are interrelated conditions that form a continuous pathological spectrum, collectively referred to as venous thromboembolism (VTE). The annual incidence of VTE is estimated to range from approximately 1 to 2 cases per 1000 individuals. 1 In Western nations, VTE ranks as the third leading cause of vascular death, following ischemic heart disease and cerebrovascular disease. 2 The reported in-hospital mortality rate associated with PE exceeds 20%. Notably, mortality significantly increases with clinical severity, reaching 25% in PE patients presenting with acute right ventricular failure or shock, and escalating further to approximately 65% among cases requiring cardiopulmonary resuscitation. 3 In untreated patients, the mortality rate associated with PE remains markedly elevated at approximately 30%, whereas timely and appropriate therapeutic interventions have been shown to reduce the mortality rate to approximately 8%. 4 Therefore, early diagnosis and prompt initiation of treatment for PE are crucial.
Although symptoms such as dyspnea, chest pain, syncope, and hemoptysis may raise suspicion for PE, no single pathognomonic clinical feature exists, rendering its diagnosis generally difficult.5,6 Consequently, clinical probability scores that combine symptoms, physical findings, and patient history—such as the Wells score and the revised Geneva score—have been developed and validated in practice.7,8 According to these scores, patients with an intermediate likelihood of PE are estimated to have a probability of approximately 30%, whereas those with a high likelihood have a probability of around 65%. Furthermore, as an aid in the diagnosis of PE, a normal plasma D-dimer level is recognized as valuable in excluding PE, as outlined in the European Society of Cardiology's (ESC) guidelines for acute PE 9 ; since D-dimer reflects the activation of coagulation and fibrinolysis, a normal level effectively rules out the presence of acute thrombotic events. 10 In light of these considerations, when PE is suspected or needs to be excluded, imaging studies—such as contrast-enhanced computed tomography (CECT) (including perfusion CT), lung perfusion-ventilation scintigraphy (V/Q scintigraphy), or pulmonary angiography—are employed. 11
In clinical practice, it is not uncommon for patients presenting with leg edema or pain to be initially diagnosed with DVT via ultrasound examination or other diagnostic modalities. Because these patients have an acute thrombotic condition, their D-dimer levels are elevated, and thus, PE cannot be ruled out solely based on D-dimer levels. 12 When applying the Wells or revised Geneva scores, many cases are readily classified as having at least a moderate probability of PE, thereby necessitating further imaging studies to assess its presence.7,8 For these reasons, in real-world clinical practice, we have performed various imaging studies on most patients to determine the presence or absence of PE in patients with DVT.
As a result, we found that the majority of DVT patients with PE exhibited elevated plasma soluble fibrin (SF) levels. Therefore, we retrospectively examined whether the possibility of PE could be excluded in DVT patients who exhibited SF levels within the normal range.
Materials and Methods
Patient Selection
Between August 2012 and March 2022, patients newly diagnosed with DVT at the Department of General Medicine, Nara Medical University Hospital, were enrolled in this study. The presence of DVT in patients was diagnosed by venous ultrasonography (US) or CECT. The presence of PE was confirmed by CECT or V/Q scintigraphy. The following patients were excluded from the study because their coagulation test results: (1) patients whose imaging studies for PE evaluation were performed more than 5 days after DVT diagnosis, given the possibility that PE may have resolved as a result of treatment; (2) patients who were already receiving anticoagulant therapy at the time of DVT diagnosis for other indications, such as atrial fibrillation or a history of thromboembolic events; and (3) patients with missing D-dimer or SF values. The study protocol was approved by the Institutional Review Board of Nara Medical University (approval number: 2051).
Clinical Data
Clinical data including age, sex, body mass index (BMI), comorbidities, medications, D-dimer, SF, diagnostic methods for DVT and PE, and the interval between DVT diagnosis and PE assessment were retrospectively reviewed from the patients’ medical records. The normal ranges for D-dimer and SF were defined as <1.0 μg/mL and <7.0 μg/mL, respectively, according to our institution's laboratory criteria.
Statistical Analysis
Categorical variables were compared using Fisher's exact test and continuous variables with the Mann–Whitney U test. We first performed a univariable logistic regression to assess the association between normal D-dimer (<1.0 μg/mL) or SF (<7.0 μg/mL) levels and PE exclusion (Crude Model). We then built two multivariable logistic regression models: Model 1 adjusted for D-dimer and SF status, and Model 2 additionally adjusted for age, sex, obesity (BMI ≥ 25 kg/m²), cancer, autoimmune disease, and glucocorticoid use. There were no missing data for any of these variables. In all models, D-dimer and SF were treated as binary variables (normal vs elevated). All tests were two-sided, with P < .05 indicating statistical significance. Analyses were performed using EZR version 1.68.
Results
Patients
A total of 153 patients were diagnosed with DVT, and all patients with DVT underwent CECT or V/Q scintigraphy to assess the presence of PE; 20 patients were excluded according to the exclusion criteria, resulting in 133 patients ultimately included in the study (Figure 1). Among the 133 patients with DVT, 71 had PE, and these patients were classified as the PE group, while the remaining 62 patients without PE were classified as the no-PE group. An a priori power analysis was conducted to determine the sample size required to assess the ability for excluding PE using normal SF levels, assuming a power of 80% and α = 0.05. The analysis indicated that a minimum of 110 participants was needed. Ultimately, 133 patients were enrolled in the study, exceeding the required sample size.

Patients flow diagram of patients with DVT. 153 patients were diagnosed with DVT, and 20 patients following the exclusion criteria were excluded, resulting in 71 patients with PE were in the PE group and 62 patients without PE were in the no-PE group among a total of 133 patients analyzed. Patients who were already receiving anticoagulant therapy at the time of DVT diagnosis, including those on anticoagulants for reasons other than DVT—such as atrial fibrillation or a history of thromboembolic disease—were excluded from the study. Abbreviations: DVT, deep venous thrombosis; PE, pulmonary embolism; SF, soluble fibrin.
Baseline Characteristics
No enrolled patients had lower-limb paralysis or recent fractures. No significant differences were observed between the PE and no-PE groups regarding age, sex, BMI, the prevalence of cancer and autoimmune diseases, thrombotic risk factors (including protein C, protein S, and antithrombin deficiencies), or the usage rates of steroids and contraceptives (Table 1). In both groups, the proportion of male patients was low, with a median age of approximately 75 years and a BMI of around 22 kg/m². In the majority of cases in both groups, the presence or absence of PE was confirmed by CECT.
Patients’ Characteristics and Laboratory Data at the Time of DVT Diagnosis.

Abbreviations: DVT, deep vein thrombosis; PE, pulmonary embolism; BMI, body mass index; SF, soluble fibrin; NA, not applicable; PE group, DVT patients with concomitant PE; no-PE group, DVT patients without PE.
Note: * Mann-Whitney U test was used for continuous variables to compare the two groups, and the data are expressed as median (interquartile range, IQR). †Fisher's exact test was used for categorical variables to compare the two groups, and the data are expressed as number of cases (percentage in each group). The normal reference values were defined as D-dimer < 1.0 µg/mL and SF < 7.0 µg/mL.
Plasma Levels of D-dimer and SF
As shown in Table 1, the plasma D-dimer levels at the time of DVT diagnosis were significantly higher in the PE group, with a median of 7.5 μg/mL, compared to that of the no-PE group, which had a median of 5.8 μg/mL (P = .0156). Similarly, SF levels were significantly higher in the PE group, with a median of 28.8 μg/mL, than in the no-PE group, which had a median of 9.9 μg/mL (P < .0001).
Plasma D-dimer and SF Levels in the PE and No-PE Groups (Proportion of Normal vs Elevated Levels)
Table 2 presents the proportion of patients with normal versus elevated plasma D-dimer and SF levels in the PE and no-PE groups. With the exception of one case in the no-PE group, all patients exhibited elevated D-dimer levels. Concerning plasma SF levels, 26 of the 62 patients in the no-PE group had normal values, whereas only 5 of the 71 patients in the PE group demonstrated normal values. The proportion of patients with normal SF levels was significantly lower in the PE group compared to the no-PE group (P < .0001). Figure 2 illustrates the distribution of plasma D-dimer and SF levels in each group, clearly demonstrating that most patients in the PE group exhibited elevated plasma SF levels.

The distribution of plasma D-dimer and SF levels in patients with DVT. (A) The distribution of D-dimer values in the no-PE and the PE groups. The vertical axis is represented as an exponential function graph. The median of D-dimer was 5.8 μg/mL in the no-PE group and 7.6 μg/mL in the PE group. The horizontal line in the figure represents the upper limit of the normal range (1.0 μg/mL) for D-dimer. With the exception of one case in the no-PE group, all patients exhibited elevated D-dimer levels above the normal range. * indicates P < .05. (B) The distribution of SF values in the no-PE group and the PE groups. The vertical axis is represented as an exponential function graph. The median of SF was 9.9 μg/mL in the no-PE group and 28.8 μg/mL in the PE group. The horizontal line in the figure represents the upper limit of the normal range (7.0 μg/mL) for SF. 26 of the 62 patients in the no-PE group had normal values, whereas only 5 of the 71 patients in the PE group demonstrated normal values. ** indicates P < .0001. Abbreviations: PE, pulmonary embolism; SF, soluble fibrin; PE group, DVT patients with concomitant PE; no-PE group, DVT patients without PE.
Proportion of Normal D-Dimer or Normal SF in PE and no-PE Groups.

Abbreviations: SF, soluble fibrin; PE, pulmonary embolism; PE group, DVT (deep vein thrombosis) patients with concomitant PE; no-PE group, DVT patients without PE.
Note: Fisher's exact test was used for D-dimer and SF to compare the two groups. The normal reference values were defined as D-dimer < 1.0 µg/mL and SF < 7.0 µg/mL.
ORs for PE Exclusion by Normal Plasma Levels of D-dimer or SF
To examine the association between normal plasma D-dimer and SF levels at the time of DVT diagnosis and the absence of PE, ORs were calculated. As previously defined, normal D-dimer and SF levels were set at <1.0 μg/mL and <7.0 μg/mL, respectively. As shown in Table 3, the univariable binomial logistic regression analysis was first performed to estimate the ORs for excluding PE on normal D-dimer or SF levels, treating these variables as categorical. However, the OR for D-dimer could not be calculated due to the small number of patients with normal D-dimer levels. In contrast, the OR for excluding PE based on a normal plasma SF level was 9.53 in the univariable analysis (crude model, Table 3). We then constructed two multivariable logistic regression models. In Model 1—adjusted only for D-dimer and SF status—a normal SF level emerged as an independent predictor of PE exclusion (OR 9.17 as shown in Table 4). In Model 2, we additionally adjusted for age, sex, obesity, comorbidities (cancer, autoimmune disease), and medication (glucocorticoid use), along with D-dimer and SF status. Again, only a normal SF level remained independently associated with the absence of PE (adjusted OR 8.86) in the fully adjusted model (Table 4).
Univariable Odds Ratios (ORs) for PE Exclusion by Normal D-Dimer or SF Levels in DVT Patients.

Abbreviations: PE, pulmonary embolism; SF, soluble fibrin; DVT, deep vein thrombosis; CI, confidence interval; NA, not applicable.
Note: The normal reference values were defined as D-dimer < 1.0 µg/mL and SF < 7.0 µg/mL.
Multivariable Odds Ratios (ORs) for PE Exclusion by Normal D-Dimer or SF Levels in DVT Patients.
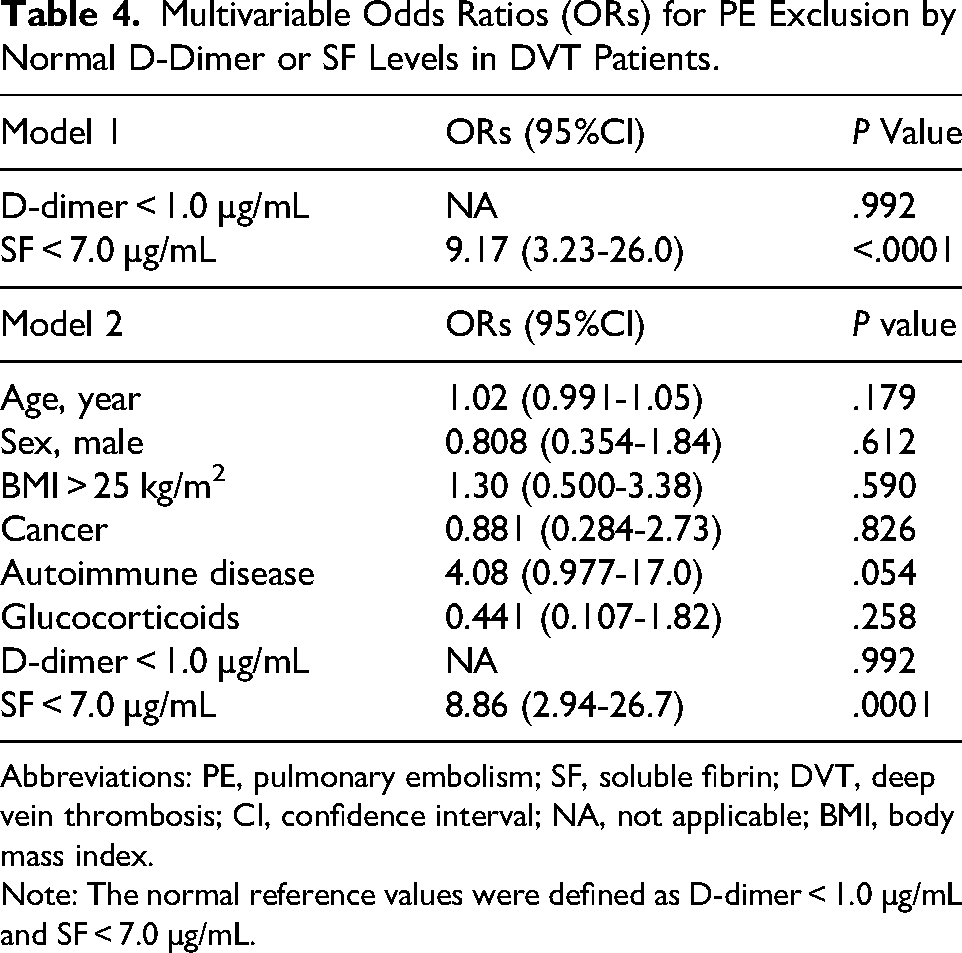
Abbreviations: PE, pulmonary embolism; SF, soluble fibrin; DVT, deep vein thrombosis; CI, confidence interval; NA, not applicable; BMI, body mass index.
Note: The normal reference values were defined as D-dimer < 1.0 µg/mL and SF < 7.0 µg/mL.
Discussion
In our study, 71 out of 133 DVT patients—more than half—had PE. The observation that thrombi in DVT patients migrate to the pulmonary arteries and form emboli in such a large number of cases is a crucial concern in real-world clinical practice. PE remains a condition with a high mortality rate, accounting for up to 300 000 deaths annually in the United States. 2 This highlights the critical need for early detection and treatment. In recognition of its significance, the ESC has updated its guidelines for the diagnosis and management of PE every 5-6 years.9,13 Notably, more than half of patients who experience sudden death are diagnosed with PE posthumously, underscoring the importance of maintaining a high index of clinical suspicion. Accordingly, clinical prediction tools such as the Wells score and the revised Geneva score have been developed.14,15 Plasma D-dimer levels are also used to detect acute thrombosis; however, their low positive predictive value, attributable to non-specific elevations in various conditions, limits their diagnostic utility.16,17 Nevertheless, their high negative predictive value renders a normal D-dimer level useful for excluding acute thrombotic events, including PE.18,19 By combining these prediction tools with D-dimer measurements, the ESC guidelines recommend that for patients classified as having a low or intermediate probability of PE, plasma D-dimer levels should be measured and, if within the normal range, used to exclude PE. 9 When PE is suspected, definitive diagnostic imaging—such as CECT, pulmonary angiography, or V/Q scintigraphy—is typically performed. 20 However, indiscriminate use of these imaging tests in every suspected case increases healthcare costs and the risk of complications. Therefore, avoiding unnecessary examinations is essential. In this regard, our study indicates that measuring SF levels in patients suspected of PE could potentially contribute to reducing the use of unnecessary imaging.
In clinical practice, many patients present with leg swelling and pain as their primary complaint and are subsequently diagnosed with DVT by ultrasound examination. In such cases, the revised Geneva score often categorizes the probability of PE as at least intermediate 15 ; moreover, due to the presence of DVT, plasma D-dimer levels are elevated,21,22 rendering it insufficient to rule out PE on the basis of D-dimer alone. As a result, all DVT cases may require imaging studies. To avoid unnecessary examinations, the Pulmonary Embolism Rule-out Criteria (PERC) were developed to minimize unnecessary testing in DVT patients. However, the presence of unilateral lower limb swelling, which is commonly observed in DVT patients, prevents the complete exclusion of PE even when using PERC. 23 In such cases, our study indicates that if SF levels remain within the normal range, it could be possible to consider foregoing advanced imaging examinations.
SF is a complex of fibrinogen and fibrin monomers formed when thrombin directly acts on fibrinogen. 24 As an intermediate product in fibrin formation, SF appears in the bloodstream earlier than D-dimer—a fibrin degradation product—in thrombotic diseases. 25 With a half-life of approximately two hours, it serves as a real-time indicator of thrombin generation and, consequently, of ongoing thrombosis. Elevated SF levels have been reported in various thrombotic conditions, including myocardial infarction, cerebral infarction, disseminated intravascular coagulation (DIC), COVID-19, and VTE.19,26–29 In our study, among 62 DVT patients without PE, 26 had normal SF levels, whereas among 71 DVT patients with PE, only 5 exhibited SF levels within the normal range. DVT patients with concomitant PE had a significantly higher proportion of elevated plasma SF levels compared to those without PE. Since elevated SF levels are considered to reflect real-time thrombin generation, this finding could indicate that thrombi in patients with PE might be more prone to enlargement, which could potentially contribute to the progression of the disease.
Clinically, untreated PE often progresses,3,4,30,31 whereas DVT—particularly distal DVT—tends to resolve spontaneously and rarely expands without treatment.32,33 This observation may be consistent with the notion that thrombin formation tends to be more pronounced in PE than in DVT, which could help explain the elevated SF levels in PE patients.
Considering the differences in thrombogenicity between DVT and PE, the pulmonary artery, compared to the slow blood flow in the lower extremity veins, is characterized by pulsatile and higher-pressure blood flow. When the pulmonary artery is occluded by an embolus, turbulence and subsequent stasis may occur, contributing to localized inflammation and endothelial cell damage due to rapid pressure change, which in turn could be associated with thrombus formation. Even in non-occlusive embolism, increased shear stress within the vessel may cause endothelial dysfunction, which could promote thrombus formation. 34 However, these phenomena might be less pronounced in the lower extremity veins due to their lower flow velocities. Given that thrombus formation in PE could be more sustained and progressed than in DVT, it is speculated that PE may be more likely to result in thrombin generation and an increase in SF.
Multivariate analysis revealed that, among patients with DVT, a normal SF level was significantly associated with a lower likelihood of concurrent PE, indicating that a normal SF level serves as an independent factor for excluding PE. Even if PE is present, it may reflect a less progressive condition with a potentially lower risk of deterioration when DVT patients showing normal level of SF. 29
This study has several limitations. (1) It was a single-center retrospective study and may therefore be subject to selection bias. As a result, the patients included in the study may not fully represent the general population with DVT. (2) Due to the retrospective nature of the data collection, information bias may exist, including misclassification of outcomes or incomplete documentation. (3) Residual confounding cannot be entirely ruled out, despite attempts to control for known covariates. Factors such as severity of DVT, patient comorbidities, and clinician decision-making may have influenced outcomes in ways that were not fully captured in our analysis. (4) The variability among institutions in assays used to measure SF could be another limitation. Different assays utilize different antibodies, which may lead to variability in results between institutions. To address this concern, we treated SF as a categorical variable (ie, normal or elevated) rather than as a continuous variable. Given these limitations, future prospective studies are needed to further investigate the measurement of SF levels in DVT patients and to clarify their relationship with PE and prognosis.
Conclusion
Our study demonstrated that DVT patients with normal plasma SF levels are less likely to have PE. SF may offer greater diagnostic utility than D-dimer for excluding PE in patients with DVT.
Footnotes
ORCID iDs
Ethical Considerations
Ethical approval to report this case series was obtained from ethical committee of Nara Medical University (Approval Number 2051).
Author Contributions
H.K., K.N., and N.Y. designed the study and wrote the manuscript. H.K., K.N., N.Y., and K.Y. interpreted the results. H.K., N.Y., and M.M. performed data analysis. H.K., N.Y., M.M., A.K., A.S., S.S., R.Y., S.O., and M.M. performed data collection. All authors approved the final version of the manuscript for submission.
Funding
The authors received no financial support for the research, authorship, and/or publication of this article.
Declaration of Conflicting Interests
The authors declared no potential conflicts of interest with respect to the research, authorship, and/or publication of this article.