
Abstract
Introduction
As a widespread chronic disease, hypertension poses a considerable threat to global health. Statistics reveal that around one billion people worldwide are living with hypertension, and its prevalence is steadily increasing. 1 Hypertension can lead to several critical complications, including heart disease, stroke, and kidney failure. It remains a key factor in causing mortality and disability in people. 2 Hormones are closely linked to hypertension. For instance, estrogen, progesterone, and adrenal corticosteroids can lead to water and sodium retention in the body, which subsequently increases circulating blood volume and elevates blood pressure. Additionally, these hormones may activate the sympathetic nervous system, thereby further increasing blood pressure levels.3–5
Thyroid hormones serve as important regulators of metabolism and physiological functions in humans. Abnormal levels of these hormones are strongly linked to the onset and progression of various conditions.6,7 A rising number of studies are analyzing the relationship between thyroid hormones and cardiovascular diseases (CVDs). Lakshmi Kannan et al have indicated that thyroid hormones are connected to adverse prognoses in CVDs like heart failure, atrial fibrillation, and myocardial infarction. 8 According to Gu et al, adults with normal thyroid function exhibit a positive link between thyroid hormones and hypertension. 9 Free thyroxine (FT4), a key active form of thyroid hormones, can notably impact the mortality risk for hypertensive patients when its levels fluctuate. 10 However, current study findings regarding the connection between FT4 levels and mortality in hypertensive patients are inconsistent. 11 Moreover, there is no large-scale, prospective study evidence. Therefore, a comprehensive exploration of the connection between FT4 levels and mortality in hypertensive patients holds considerable clinical significance.
Materials and Methods
Subjects
Utilizing the National Health and Nutrition Examination Survey (NHANES) database, this study executed a cross-sectional analysis. The NHANES database applies a stratified multistage sampling method to gather a sizable, nationally representative sample. The collected data includes demographic information, dietary habits, physical examinations, laboratory results, and questionnaire responses, intended to evaluate the nutritional health of adults and children in the United States. We extracted data from 18 578 participants between 2007 and 2012, excluding individuals aged 18 or younger, those without hypertension, and those with missing FT4 key variable data or missing covariate data. 3365 participants were finally included. The research protocol was scrutinized and received permission from the National Center for Health Statistics (NCHS) Research Ethics Review Board. Before their participation, all subjects gave informed consent. All NHANES data are publicly available at https://www.cdc.gov/nchs/nhanes/.
FT4 and Hypertension
From the NHANES data gathered between 2007 and 2012, the reference range for serum FT4 levels was defined as 0.6-1.6 ng/dL. A two-step enzyme-linked immunoassay was employed to detect serum FT4, involving the addition of monoclonal anti-T4 antibodies coupled to a biotin-coated solid phase, along with samples and a buffered protein solution, into a reaction container. During the first incubation phase, biotin-conjugated anti-T4 antibodies bound to the solid phase and FT4 within the sample. After this incubation, materials bound to the solid phase were retained in a magnetic field, allowing for the removal of unbound materials through washing. Following this, a buffered protein solution and triiodothyronine (T3)-alkaline phosphatase conjugate were added, where the conjugate occupied the vacant binding sites on the anti-T4 antibodies. After the second incubation, the bound materials were retained in the magnetic field, and unbound materials were removed through washing. More detailed quality control steps could be found in the laboratory procedures manual for the Mobile Examination Center on the NHANES website.12–14 Hypertension was identified through self-reported of the condition, reported use of antihypertensive drugs, and averaging three blood pressure readings where the systolic pressure exceeded 130 mm Hg and/or the diastolic pressure exceeded 80 mm Hg. 13
Survival status
The National Center for Health Statistics employed various identifiers, like Social Security numbers and birth dates, to probabilistically link data from the NHANES with the National Death Index (NDI) for determining participants’ survival status. The follow-up of participants concluded by December 31, 2019. If a mismatch with the NDI was detected, the participant was classified as alive. The study analyzed both survival outcomes and survival duration, with all-cause mortality being the outcome of interest. 15
Definition of Covariates
Information on age, gender, race, body mass index (BMI), drinking condition, smoking condition, hypertension, diabetes, and hyperlipidemia was obtained through questionnaires, laboratory tests, and demographic data. Drinking more than 12 drinks per year was defined as a drinker. Individuals who smoked more than 100 cigaretes in their lifetime and did not quit were classified as current smokers. Those who quit smoking were referred to as ex-smokers, while individuals who smoked fewer than 100 cigaretes in their lifetime were designated as never-smokers. Diabetes was recognized through self-reported information about the disease, self-reported use of drugs to reduce blood glucose levels, a fasting plasma glucose level exceeding 126 mg/dL, an oral glucose tolerance test result of 200 mg/dL or higher, or a hemoglobin A1c level of 6.5% or greater. 16 Hyperlipidemia was determined by self-reported use of lipid-lowering medications, triglyceride levels of 150 mg/dL or higher, total cholesterol levels of 200 mg/dL or above, LDL levels of 130 mg/dL or greater, or low HDL levels (where HDL <40 mg/dL for males and HDL <50 mg/dL for females). 14 The remaining covariates were extracted from the corresponding questionnaire data or demographic information.
Statistical Analysis
Considering the multi-stage complex sampling design employed by NHANES, we adopted new sample weights to ensure the reliability of our results. The new sample weights were derived by dividing the original basic examination weights from two years by three.
To assess the normality of the continuous variables, the Kolmogorov-Smirnov test was conducted. In the study, all variables were found to be non-normally distributed. Thus, the median (P25, P75) was used for descriptive statistics. For intergroup comparisons, the Kruskal-Wallis test was leveraged. Categorical variables were displayed in terms of frequencies and proportions, with intergroup comparisons conducted using the chi-square test. Additionally, log-rank tests and Kaplan-Meier (KM) survival analysis were utilized to explore differences in mortality outcomes among patients categorized by different FT4 levels.
Firstly, we established an unadjusted model (Model 1). The FT4 levels were segmented into four quartile subgroups and evaluated as continuous and categorical variables utilizing a weighted Cox proportional hazards model. Hazard ratios (HRs) and 95% confidence intervals (CIs) were leveraged to characterize the link between these variables and all-cause mortality in hypertensive patients. Adjustments were made for demographic characteristics in Model 2, including age, gender, race, educational attainment, marital status, and the poverty income ratio (PIR). Building on the foundation set by Model 2, Model 3 made additional adjustments for BMI, alcohol consumption, smoking status, hyperlipidemia, and diabetes. Secondly, based on Model 3, restricted cubic spline (RCS) was utilized to test the dose-response relationship between FT4 and all-cause mortality in hypertensive patients. A smooth curve was established using five nodes (0.05, 0.275, 0.5, 0.725, and 0.95) representing the distribution of FT4 levels. Furthermore, we executed a sensitivity analysis to examine the stability of the results obtained from the study. Considering the effects of cancer and other causes of death, a weighted Cox proportional hazards model analysis was conducted following the exclusion of patients who died within two years and those who succumbed to cancer. Finally, subgroup analyses were executed considering age, gender, alcohol consumption, BMI, smoking condition, diabetes, and hyperlipidemia. A multiplicative interaction analysis was employed to examine whether there were differences among the various subgroups.
The study was statistically analyzed using R 4.4.1, with all tests being two-sided. A significance level of P < .05 was used.
Results
Baseline Demographic and Clinical Characteristics
In total, 3365 participants were included. In the course of a median follow-up of 131 months, 757 patients died. The baseline table indicated that the characteristics of the population experiencing mortality may include older age, a higher proportion of non-Hispanic whites, lower educational attainment, reduced PIR, smoking, and a prevalence of diabetes (P < .05) (Table 1).
Baseline Characteristics of Hypertensive Patients.
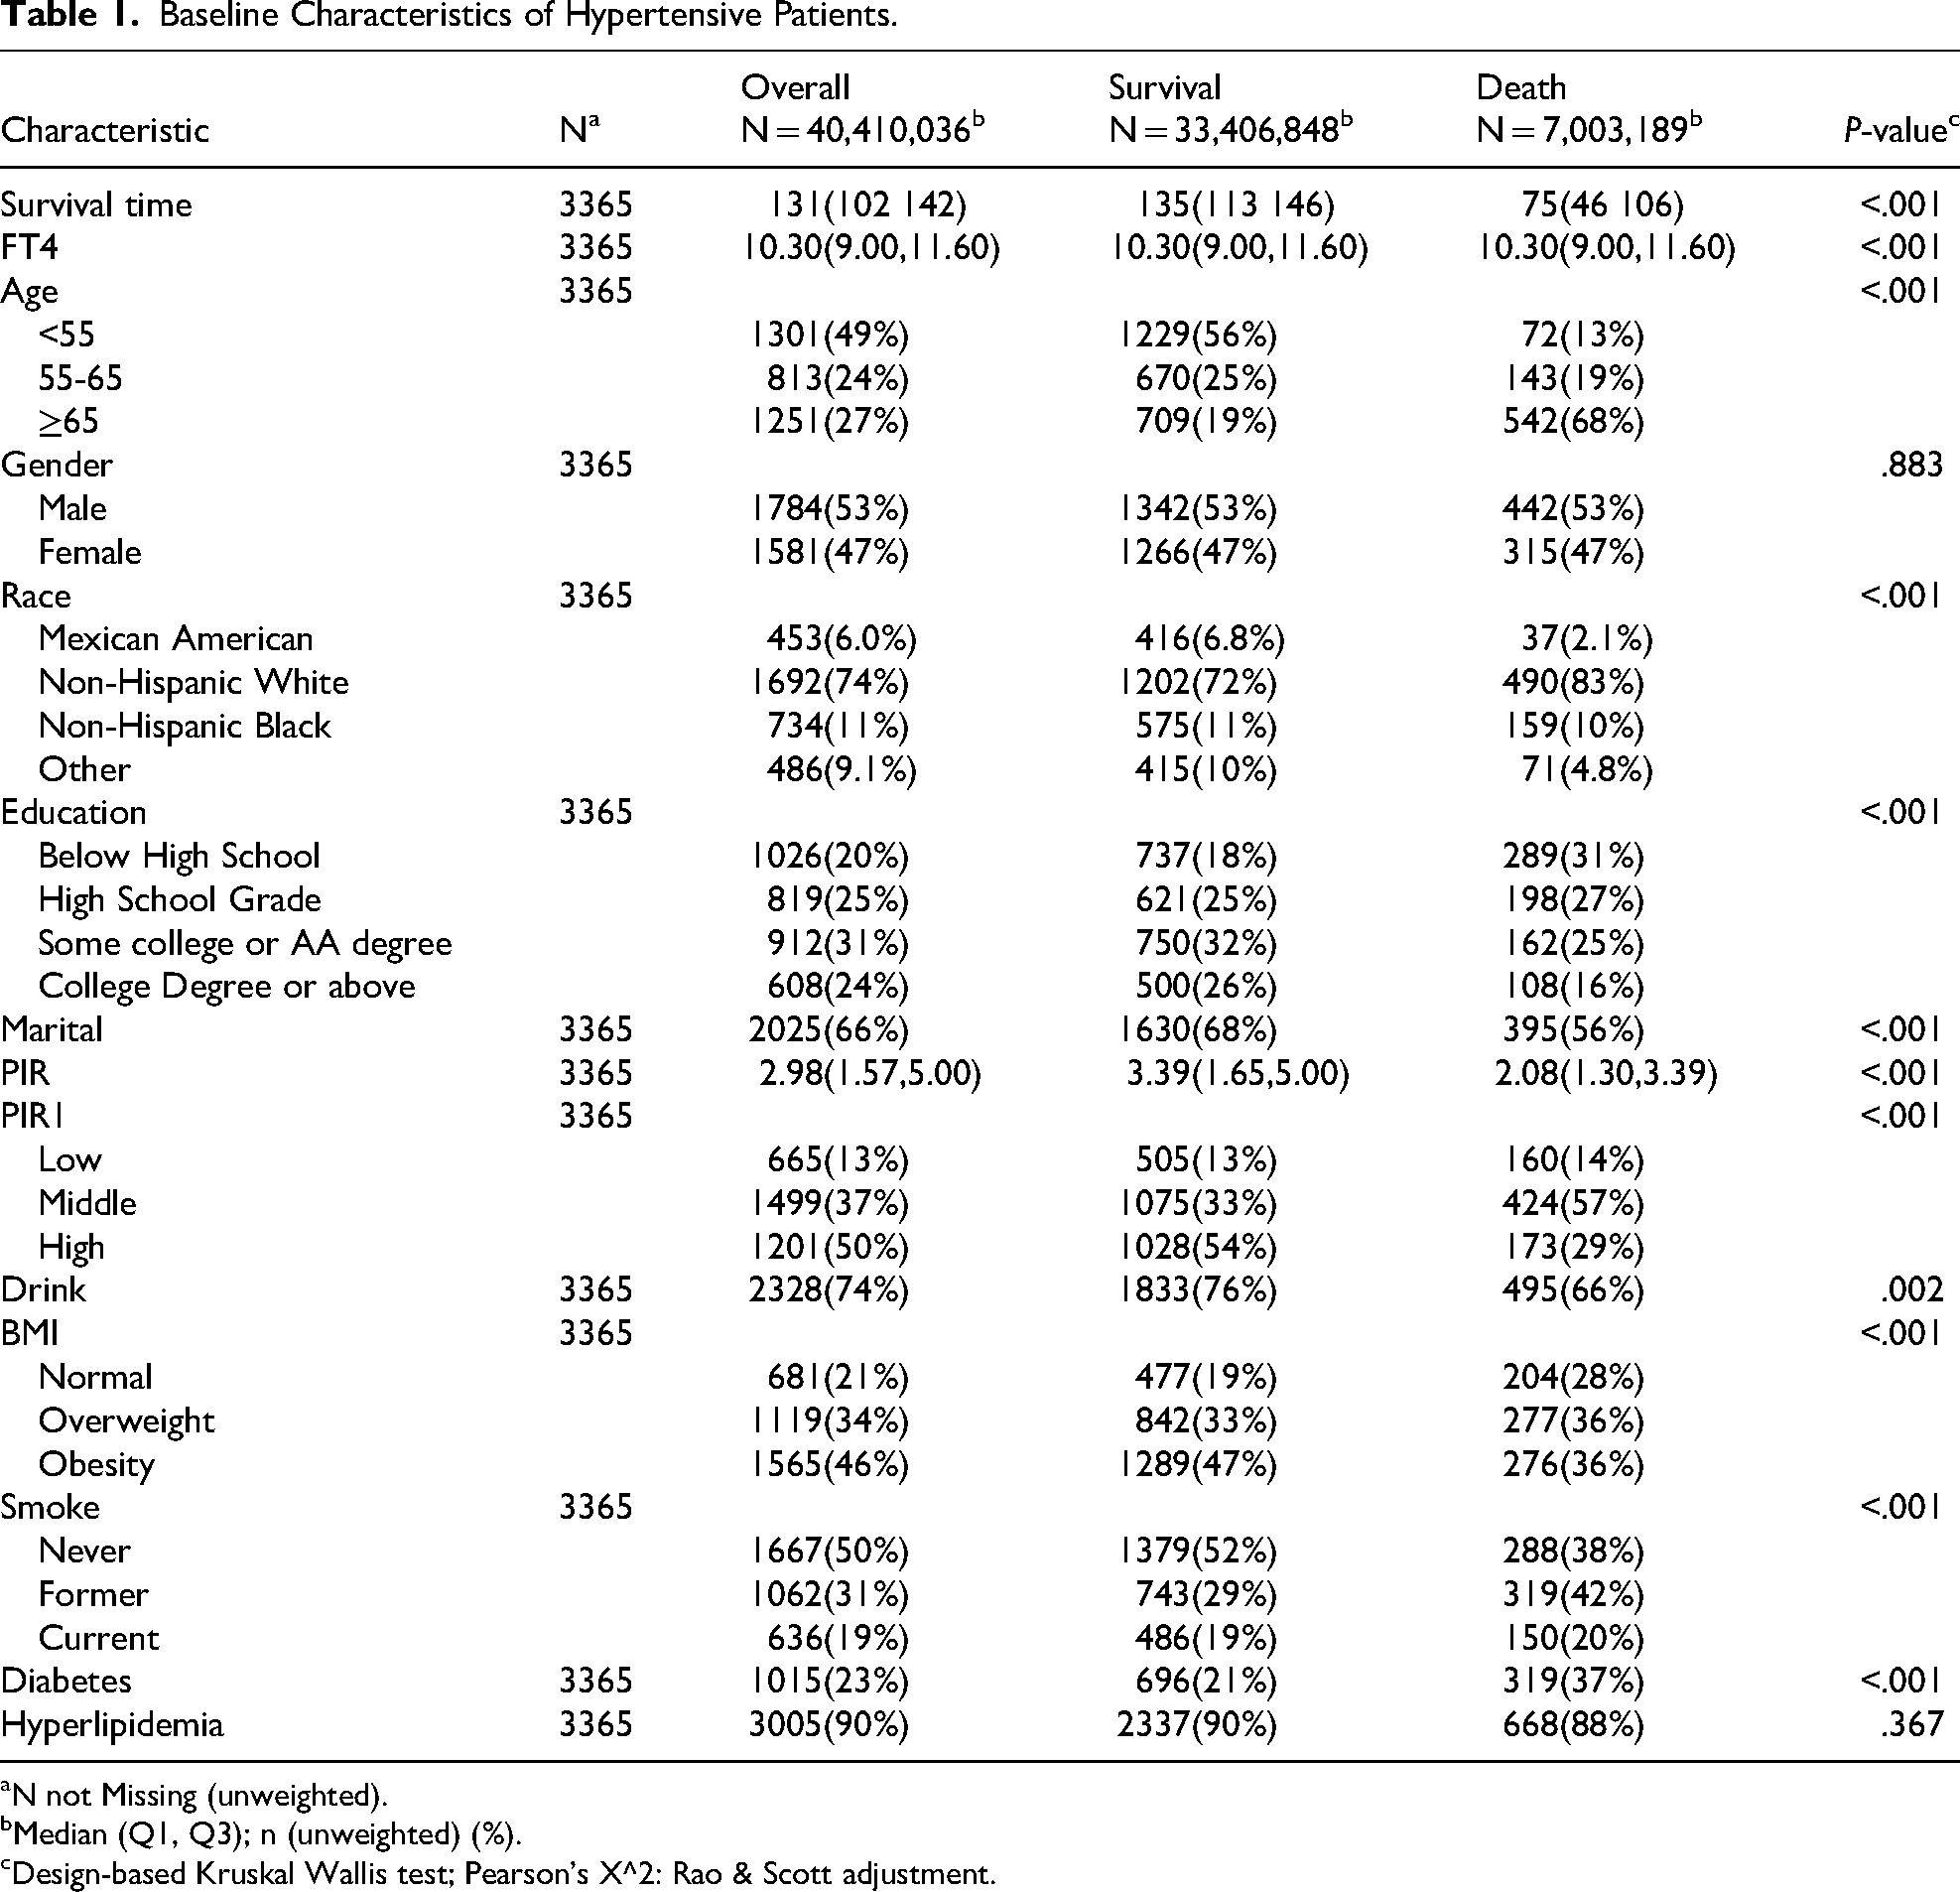
N not Missing (unweighted).
Median (Q1, Q3); n (unweighted) (%).
Design-based Kruskal Wallis test; Pearson's X^2: Rao & Scott adjustment.
Link Between FT4 Levels and All-Cause Mortality in Hypertensive Patients
The results of the weighted Cox regression model for FT4 and patients with hypertension are presented in Table 2. Model 1 revealed a notable link between FT4 levels and all-cause mortality risk when FT4 was considered a continuous variable. In Model 3, the all-cause mortality rate in hypertensive patients rose by 8.1% with each unit elevation in FT4 (HR = 1.081, 95% CI: 1.04-1.12, P < .001). In Model 3, treating FT4 as a categorical variable based on quartiles demonstrated that the highest quartile of FT4 increased the risk of all-cause mortality in hypertensive patients, compared to the lowest quartile (HR = 1.47, 95% CI: 1.01-2.15, P = .045).
Association Between FT4 and All-Cause Mortality of Hypertension.

Abbreviations: HR, Hazard Ratio; CI, confidence interval. Model 1 was crude model; Model 2 was adjusted for age, gender, race, educational level, marital status, poverty-income ratio; Model 3 was adjusted for age, gender, race, educational level, marital status, poverty-income ratio, BMI, drinking status, smoking status, hyperlipidemia status, diabetes status.
Dose-Response Relationship Between FT4 and All-Cause Mortality in Hypertensive Patients
In Model 3, the RCS curve implied a nonlinear elevation in all-cause mortality with increasing FT4 levels in patients with hypertension (P for nonlinear = .033), as illustrated in Figure 1A.
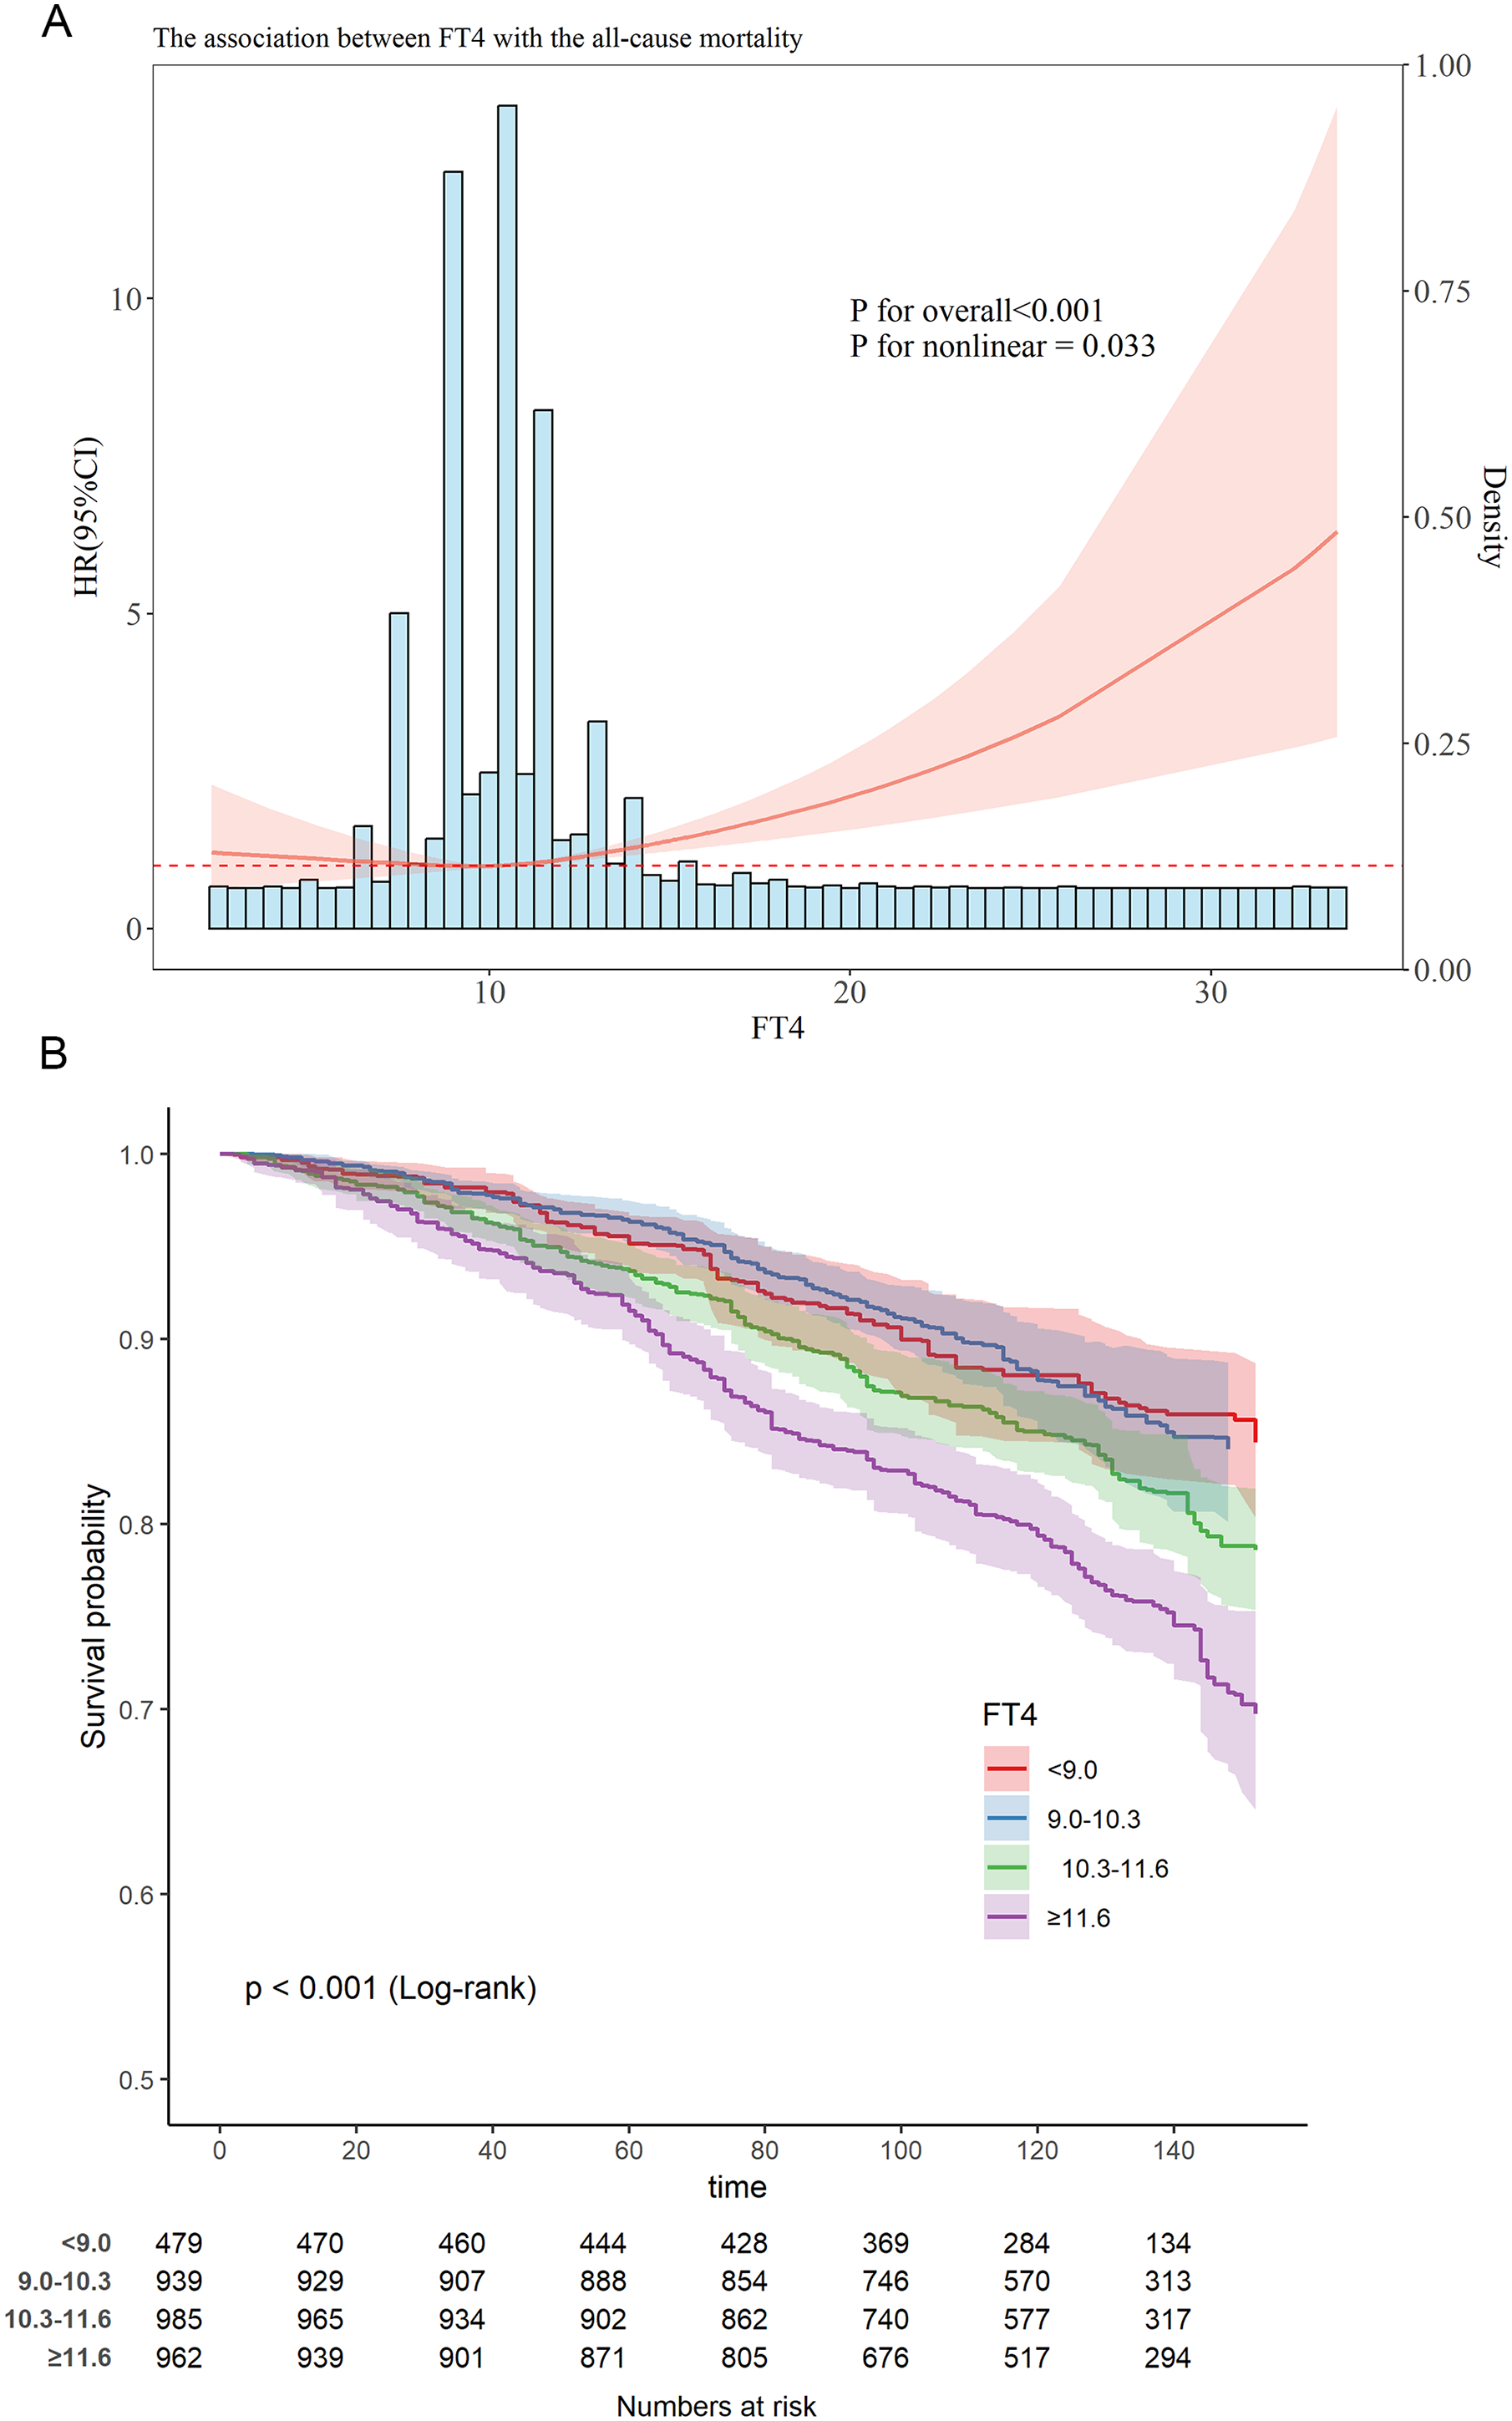
Analysis of the Relationship between FT4 and All-Cause Mortality in Hypertension Patients (A) Dose-Response Relationship (RCS); (B) KM Survival Curve.
KM Survival Curve of FT4 and Hypertensive Patients
The KM survival curve indicated that noticeable differences in all-cause mortality rates were observed among the four groups based on the quartiles of FT4. Compared to groups Q1 and Q2, the all-cause mortality rate in groups Q3 and Q4 was evidently higher (P < .001), as illustrated in Figure 1B.
Subgroup Analysis and Sensitivity Analysis
Subgroup analyses were undertaken considering age, gender, drinking status, smoking status, BMI, diabetes, and hyperlipidemia (Figure 2). The results were predominantly consistent with the overall results. Higher levels of FT4 were connected to all-cause mortality in hypertensive patients among populations aged ≥65 years, females, alcohol consumers, individuals with normal BMI, former smokers, never-smokers, those without diabetes, and individuals with hyperlipidemia (P < .05). The interaction between FT4 levels and BMI was remarkable, with the influence of FT4 on all-cause mortality in hypertensive patients being more pronounced in the subgroup with normal BMI (P for interaction = .010).

Forest Plot for Subgroup Analysis of the Association between FT4 and All-Cause Mortality of Hypertension.
The findings in the sensitivity analysis were largely consistent even, even after the exclusion of patients who died within two years and those who passed away from cancer. In Model 3, for each one-unit increase in FT4, the all-cause mortality rate among hypertensive patients increased by 6.8% (HR = 1.068, 95% CI: 1.029-1.110, P < .001). For hypertensive patients, the highest quartile of FT4 acted as a risk factor for all-cause mortality relative to the lowest quartile of FT4 (HR = 1.75, 95% CI: 1.12-2.75, P = .015) (Table 3).
Association Between FT4 and All-Cause Mortality of Hypertension After Excluding Patients Who Died Within Two Years and from Cancer.

Abbreviations: HR, Hazard Ratio; CI, confidence interval. Model 1 was crude model; Model 2 was adjusted for age, gender, race, educational level, marital status, poverty-income ratio; Model 3 was adjusted for age, gender, race, educational level, marital status, poverty-income ratio, BMI, drinking status, smoking status, hyperlipidemia status, diabetes status.
Discussion
This study reveals that FT4 levels are strongly correlated to all-cause mortality risk in hypertensive patients, with higher FT4 levels increasing the risk of all-cause mortality in this population. This correlation remains stable after accounting for confounding factors and excluding patients who passed away within two years or due to cancer. Moreover, it is also evident in subgroup analyses.
The principal hormones produced by the thyroid gland are T3 and thyroxine (T4). Thyroid hormone receptors are present in most tissues, including the heart and blood vessels. T4, the primary thyroid hormone in circulation, serves critical functions such as modulating basal metabolic rate, thermoregulation, and energy metabolism. 17 Increased FT4 concentrations, particularly in hypertensive patients, can enhance myocardial oxygen consumption,18,19 predisposing to cardiac complications including tachycardia and atrial fibrillation.20,21 Meanwhile, it is also linked to accelerated protein catabolism and muscle depletion, resulting in impaired nutritional status and metabolic dysfunction. 22 These mechanisms may explain the increased risk of all-cause mortality observed in hypertensive patients with high FT4 levels.
Hypertension is the most important contributor to CVDs. CVD progression may disrupt the thyroid feedback regulation, leading to a decline in serum FT3 concentrations, with FT4 and thyroid-stimulating hormone (TSH) levels remaining unaffected.23–25 This phenomenon may be attributed to a reduction in the deiodination of FT4 into FT3, resulting in an increased conversion of FT4 into more inactive FT3.26,27 Thus, Consequently, when the concentration of FT4 is excessively high, it can lead to decreased activity of deiodinases and subsequently lower levels of FT3. This alteration may contribute to dyslipidemia, atherosclerosis, heart failure, and other related conditions.28–30 These could provide an alternative explanation for the positive correlation between FT4 levels and all-cause mortality in patients with hypertension.
Thyroid hormones impact the cardiovascular system through multiple physiological effects. These effects are driven by mechanisms such as endothelial dysfunction, shifts in blood pressure, myocardial impairment, and dyslipidemia.31,32 Although existing studies suggest that reduced FT4 levels may lead to diminished myocardial contractility, 9 decreased heart rate, and reduced vascular tone,6,30,33 our findings predominantly highlight the association between elevated FT4 levels and increased cardiovascular disease risk. Cappola AR et al have conducted a study involving 2843 older community residents in the United States, following them over a period of 18 years. Their findings suggest that increased FT4 levels within the reference range correlate with an elevated risk of all-cause mortality,7,34 aligning with our findings. Lang et al have identified FT4 as an independent predictor for cardiovascular death and CVD risk in the broader population. 35 However, Liu et al demonstrate that FT3 is an independent predictor of all-cause mortality and cardiovascular mortality in patients with diabetes, whereas FT4 does not exhibit such an effect. 36 This implies that FT3 and FT4 might function differently in different populations. 37 In a community-based study, reduced TSH concentrations are independently tied to increased all-cause mortality in older participants with normal thyroid function. 38 Further research is essential to clarify the link between thyroid hormone levels and mortality risk and to uncover the biological pathways involved.
However, this study has several limitations. First, its retrospective nature may introduce biases related to recall and selection. Second, the small sample size may compromise the reliability of the results. Additionally, only a single measurement of thyroid hormone levels is conducted, which does not capture the dynamic fluctuations in these levels that could influence mortality risk in hypertensive patients. Therefore, further large-scale and prospective studies are required to verify our results and to explore in depth the specific mechanisms underlying the connection between thyroid hormone levels and mortality risk in hypertensive patients.
Conclusion
This study indicates a noticeable correlation between FT4 levels and the risk of all-cause mortality in hypertensive patients. This result suggests that FT4 levels might be a valuable predictor of all-cause mortality risk in hypertensive individuals, highlighting its important implications for assessing the mortality risk in this population.
Footnotes
Ethical Considerations
The research protocol was scrutinized and received permission from the National Center for Health Statistics (NCHS) Research Ethics Review Board. Before their participation, all subjects gave informed consent.
Consent to Participate
Not applicable.
Consent for Publication
Not applicable.
Author Contributions/CRediT
Funding
This work was supported by Special fund support for high-level talents in the medical and health industry of Jinan City (No.202412), TCM Science and Technology Project of Shandong Province (No. Q-2023033).
Conflicting Interests
The authors declare that they have no known competing financial interests or personal relationships that could have appeared to influence the work reported in this paper.