
Abstract
Background
Pulmonary embolism (PE) patients combined with heart failure (HF) have been reported to have a high short-term mortality. However, few studies have developed predictive tools of 30-day mortality for these patients in intensive care unit (ICU). This study aimed to construct and validate a machine learning (ML) model to predict 30-day mortality for PE patients combined with HF in ICU.
Methods
We enrolled patients with PE combined with HF in the Medical Information Mart for Intensive Care Database (MIMIC) and developed six ML models after feature selection. Further, eICU Collaborative Research Database (eICU-CRD) was utilized for external vali- dation. The area under curves (AUC), calibration curves, decision curve analysis (DCA), net reclassification improvement (NRI), and integrated discrimination improvement (IDI) were performed to evaluate the prediction performance. Shapley additive explanation (SHAP) was performed to enhance the interpretability of our models.
Results
A total of 472 PE patients combined with HF were included. We developed six ML models by the 13 selected features. After internal validation, the Support Vector Ma- chine (SVM) model performed best with an AUC of 0.835, a superior calibration degree, and a wider risk threshold (from 0% to 90%) for obtaining clinical benefit, which also outperformed traditional mortality risk evaluation systems,as evaluated by NRI and IDI. The SVM model was still reliable after external validation. SHAP was performed to explain the model. Moreover, an online application was developed for further clinical use.
Conclusion
This study developed a potential tool for identify short-term mortality risk to guide clinical decision making for PE patients combined with HF in the ICU. The SHAP method also helped clinicians to better understand the model.
Introduction
Pulmonary embolism (PE) is known as the third most fatal acute cardiovascular syndrome worldwide, ranking just behind myocardial infarction and stroke with a declined but still high mortality rate of 2%–7%, despite more advancements in treatment techniques.1,2 As for heart failure (HF), it has been demonstrated as a risk factor for mortality prediction and risk stratification of pulmonary embolism.3,4 Such elevated risk is considered to be associated with impaired left ventricular function and decreased ejection fraction, increased venous stasis, and chronic inflammatory state in the cardiovascular system.5,6 In addition, massive PE, which is more likely to occur among inpatients with underlying cardiopulmonary disease, can lead to impaired right ventricular (RV) function, dilatation of the right ventricle, myocardial ischemia, and ultimately further deteriorates left ventricular function and cardiac output. 7
Moreover, a retrospective single center study found an incidence of 9.1% of PE among patients with severe chronic heart failure(CHF), who were in a severity-dependently throm-boembolic risk. 8 Another multi-center study described a 12.2% all-cause in-hospital mortality rate of PE patients with CHF, where as the rate declined to 9.7% after receiving an inferior vena cava filter. 7 Thus, there calls a critical need to predict the risk of short-term mortal-ity for pulmonary embolism patients with heart failure (PEpHF) and reduce the death and disability by early detection and prevention. Several studies have identified the risk factors of clinical prognosis for PE patients and HF patients respectively. For PE patients, elevated heart rate, right ventricular longitudinal strain-related indices, white blood cell count (WBC) and systemic inflammation response index (SIRI) have been identified as risk factors associ-ated with adverse outcomes, besides previous surgery, cancer, immobilization and markers of thrombo-inflammation such as D-dimer, C-reactive protein (CRP), and blood cellular in- dices.9–11 For HF patients, lymphocyte to white blood cell count ratio (LWR), shock indexes (SI), triglycerides, N-terminal pro-b-type natriuretic peptide, and blood urea nitrogen levels were described as risk factors for all-cause mortality.12–14 In addition, the effort to develop prognostic models for the above groups has also been made. For example, Ding et al 15 developed a nomogram-based model to predict the short-term mortality for patients with PE and Shi et al 16 also constructed a nomogram-based model to predict the short-term mortality for patients with HF. Nevertheless, few studies have identified the risk factors of 30-day all-cause mortality for PEpHF from ICU cohort and developed a dynamic predictive and visual tool for clinical use.
Recently, ML, as a part of artificial intelligence, leverages data to fit high-dimensional and nonlinear relationships among clinical features, and thus could forecast clinical outcomes.8,17 Characterized by its powerful learning capabilities and predictive effectiveness, ML has been preferred by more clinicians to support clinical decision-making, with more accuracy compared with traditional statistical methods. 18 Meanwhile, there have been several studies aiming to construct the predictive models of prognosis for PE patients and HF patients respectively, based on machine learning (ML).19,20 In addition, the pulmonary embolism severity index(PESI) and simplified pulmonary embolism severity index(sPESI) score systems have also been used to classify the risk of developing prognostic adverse events for PE patients4,21 and been proved as excellent clinical indicators. However, it's still necessary to evaluate their efficiency for predicting the 30-day mortality of PEpHF in ICU due to the heterogeneity in different groups.
Above all, our research aimed at developing a ML predictive model that can accu- rately predict 30-day mortality for PEpHF in ICU, by using the free and open critical care database—Medical Information Mart for Intensive Care(MIMIC) IV, MIMIC III and eICU Collaborative Research Database (eICU-CRD). Furthermore, in order to fit the need of clinical application, we also intended to develop an online tool for clinicians to better identify the risk group to reduce the death rate among PEpHF in ICU. To enhance the interpretability of ML model, shapley additive explanation (SHAP) 22 was also carried out in our study.
Material and Methods
Data Source
We extracted derivation data from MIMIC-III and MIMIC-IV, which are known as open- sourced databases with medical health records for patients who have been admitted at Beth Israel Deaconess Medical Center. 23 We also extracted data from eICU-CRD, comprising 139 367 patients admitted between 2014 and 2015, for external validation. 24 Data were obtained by Structured Query Language (SQL) and pgAdmin4 PostgreSQL 9.6. Moreover, we have already completed an online course offered by the National Institutes of Health (NIH) and were granted access to the MIMIC database (certification number: 64322113). All methods were carried out in accordance with the “Declaration of Helsinki.” This retrospective study did not use personal identifying information and thus did not require informed patient consent or Institutional Ethics Committee Board approval.
Study Population
As shown in Figure 1, patients from the MIMIC database and eICU-CRD were fully retrieved, target PE patients with HF in MIMIC database were identified by the international classification of diseases (ICD)-9 or -10 version diagnostic code (Table S1). Patients that met exclusion criteria (age < 18 or age >95, not first ICU admission and < 24 h stay in ICU) were excluded.
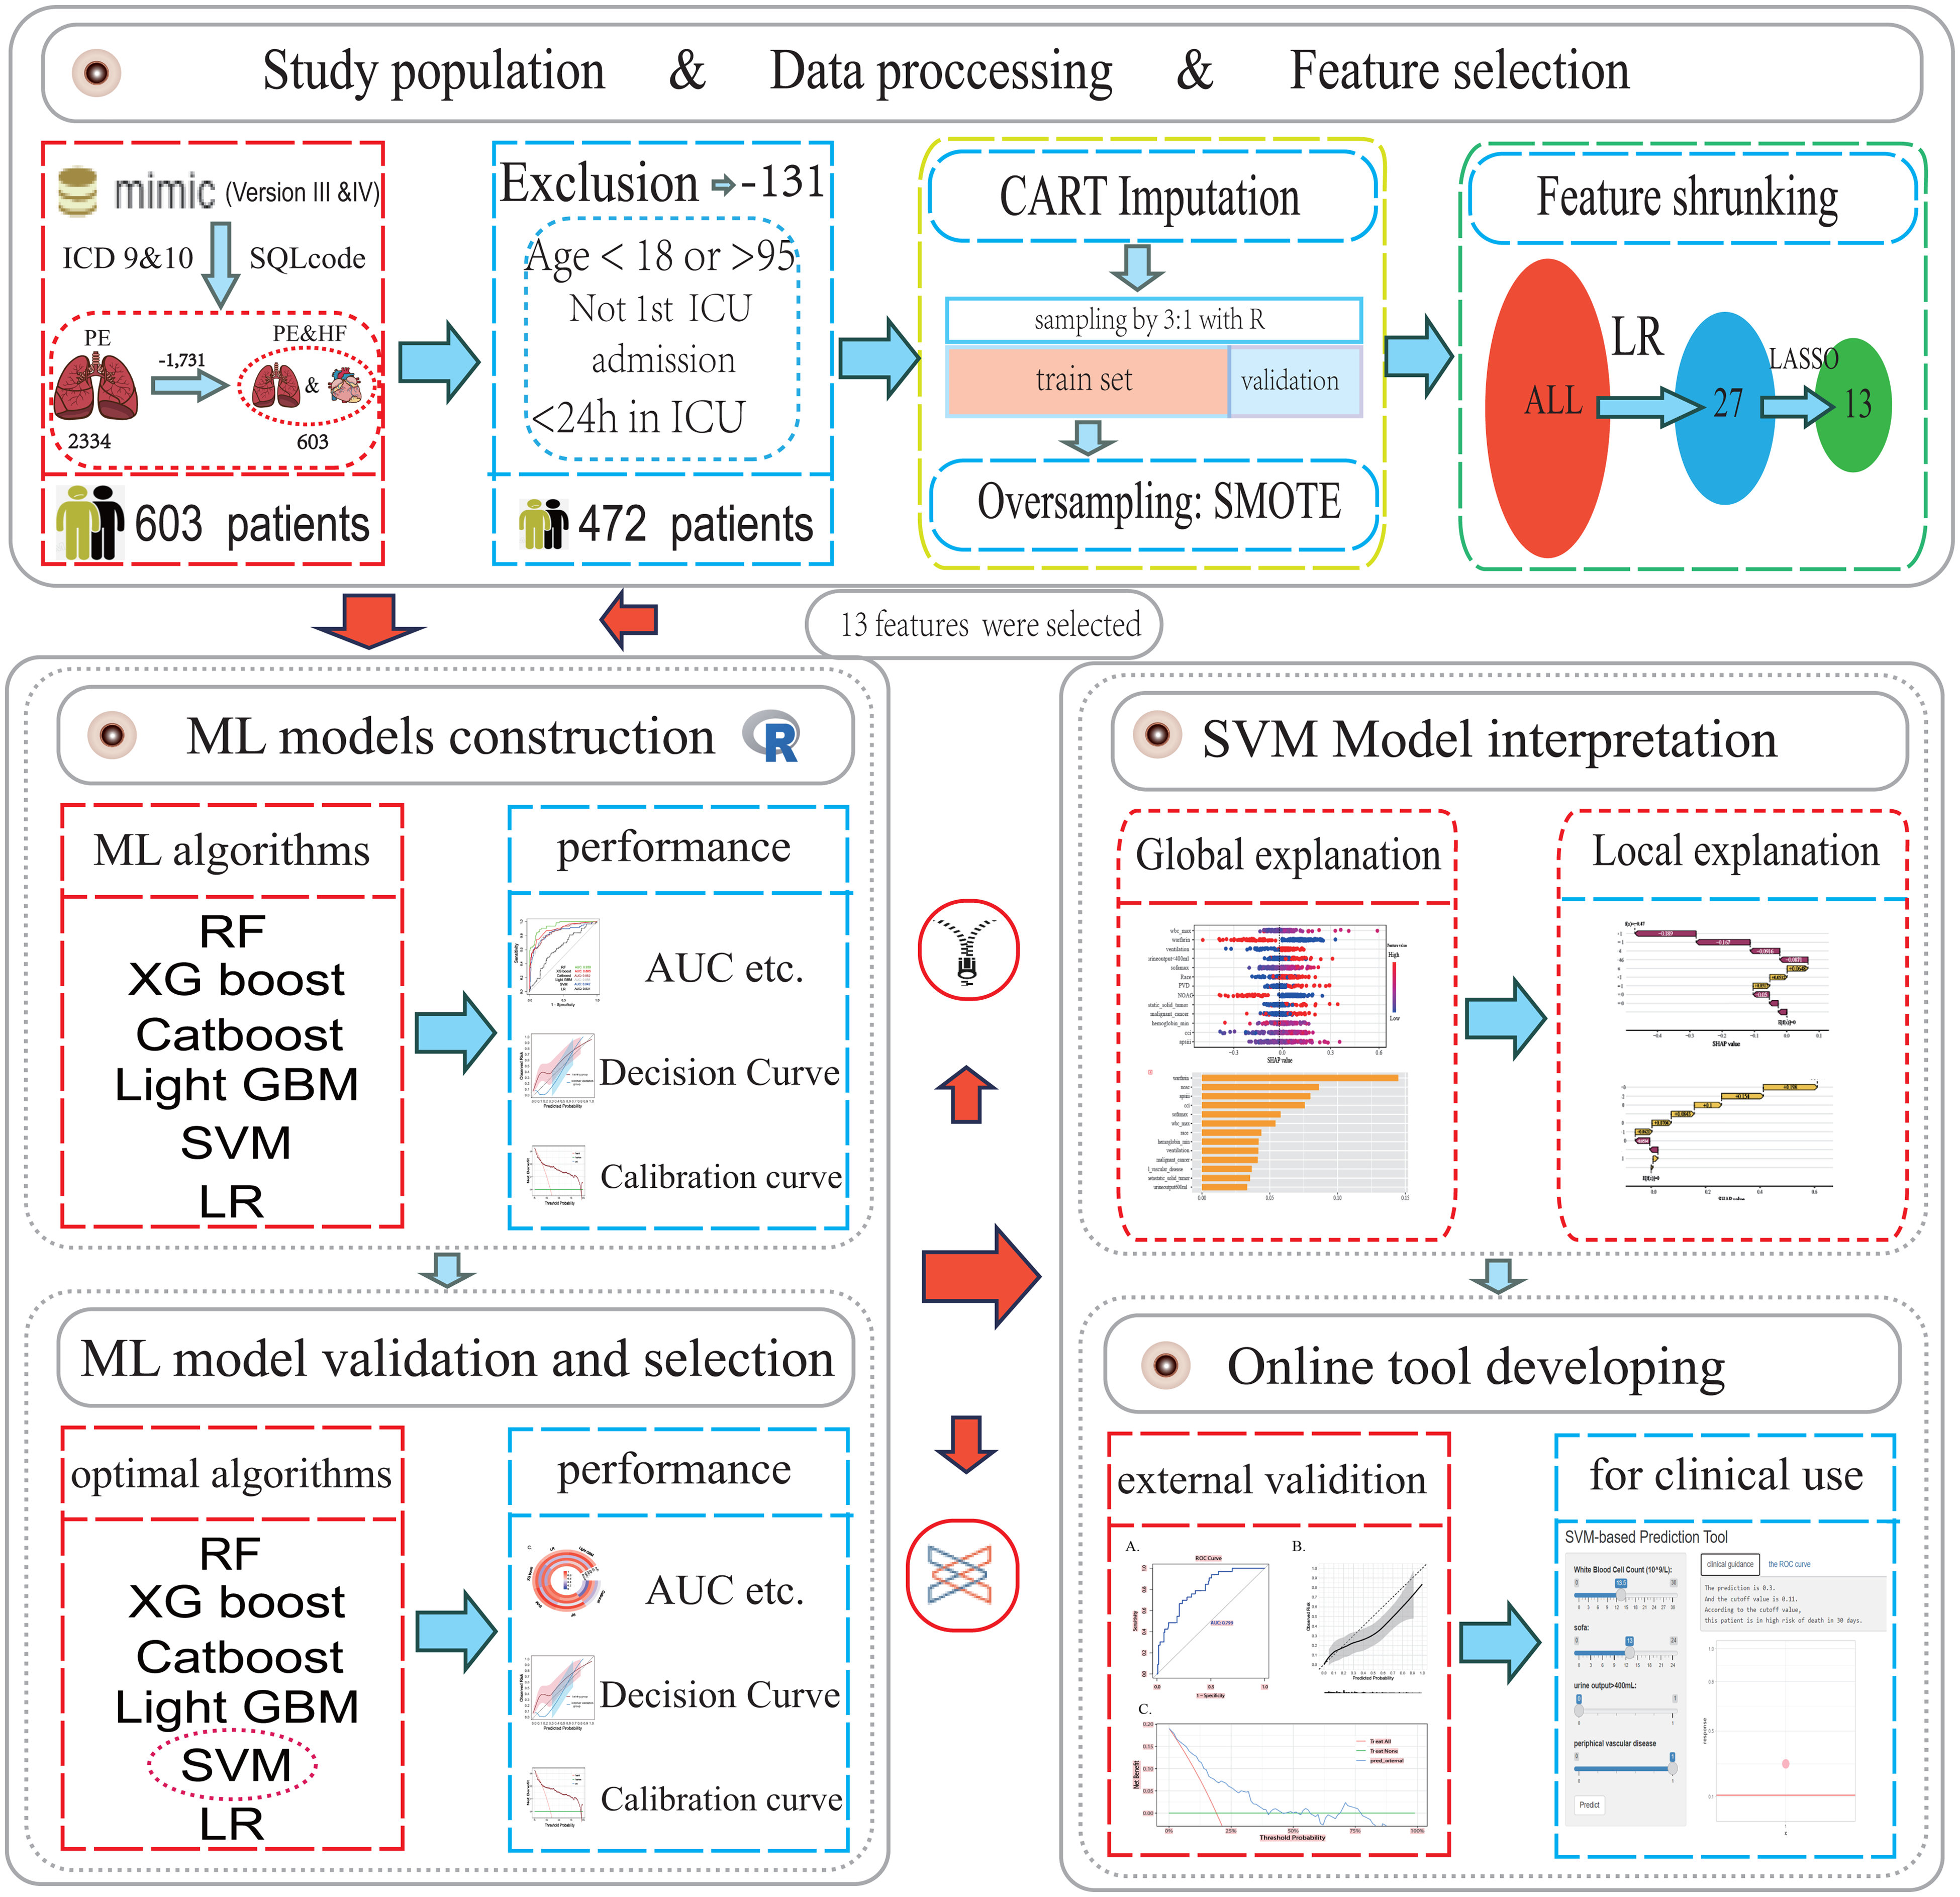
Flow chart of the study design. Abbreviations: ICD, international classification of diseases; CART, classification and regression trees; SMOTE, synthetic minority over-sampling technique; ML, machine learning; ICU, intensive care unit; RF, random forest; XGboost, extreme gradient boosting; LR, logistic regression; Catboost, categorical boosting; Light GBM, light gradient boosting; SVM, support vector machine SHAP, shapley additive explanation; AUC, area under curve.
Finally, 472 patients were included for the model development, while 534 patients selected from eICU-CRD were regarded as an independent validation set to evaluate the generalizability of the established models.
Predictor Variables
Variables extracted from the MIMIC-III and MIMIC-IV database encompassed demographic characteristics, vital signs, laboratory tests and co-existing diseases. The hadmi_id parameter was used to extract demographic characteristics, including age, sex, weight, and ethnicity. In terms of comorbidities, chronic pulmonary diseases(COPD), renal disease, severe liver disease, peripheral vascular disease(PVD), myocardial infarct(MI), acute heart failure, and cancer-related comorbidities were mainly extracted. The vital sign values, including heart rate_max(HR_max), systolic blood pressure_min(SBP_min), respiratory rate_max(RR_max), saturation of peripheral oxygen_min (Spo2_min), temperature_min, and urine output(UO), were extracted and presented in the suitable format accordingly. The laboratory results were anion gap, bicarbonate, creatinine, chloride, glucose, bicarbonate, blood urea nitrogen, potassium, partial thromboplastin time (PTT), prothrombin time(PT), hematocrit, hemoglobin, white blood cell (WBC) count, and platelet. Ventilation, vasopressin and anticoagulant drug treatments were also included. Furthermore, PESI, sPESI, Charlson Comorbidity Index (CCI), Sequential Organ Failure Assessment (SOFA), and Glasgow Coma Scale (GCS) scores of each patient was calculated. Ventilation, vasopressin and anticoagulant drug treatments were also included. The primary outcome of our study was all cause mortality within 30 days after ICU admission. Laboratory tests and vital signs were measured within the first 24 h after ICU admission. Variables with missing value proportion more than 20% were excluded. Categorical variables were converted to integer values (usually 0 or 1), while continuous variables were the original variable values.
Imputation of Missing Value
To avoid changes in variables distribution caused by imputation, only variables with missing value proportion less than 20% were included in further analysis. In order to ensure the relia-bility of our study, the predicted outcome was not imputed. In addition, PESI, sPESI, Charlson Comorbidity Index, and SOFA scores were also not imputed due to no missing data. R package “caret” was used to impute the missing value. The approach, based on the Classification and Regression Trees (CART) algorithm, could handle non-linear relationships and interactions, accommodates mixed data types, and is robust to outliers, improving imputation accuracy and model interpretability based on an assumption that all missing values are missing at random (MAR). This decision aligns with the suitability of CART Imputer for MAR scenarios.
Model Development, Comparison, and Interpretation
Firstly, we randomly divided patients into training cohort for model construction and another validation cohort for model validation with a ratio of 3:1. Subsequently, utilizing the training data, the conventional logistic regression analysis and least absolute shrinkage and selection operator (LASSO) regression analysis were used and further selected the most relative indi- cators. Due to the unbalance of positive and negative cases in the training cohort, we used synthetic minority over-sampling technique (SMOTE) to reduce overfitting by synthesizing new samples and added them to the training cohort. After variable shrunking and case balanc- ing, we finally constructed six ML models— Extreme Gradient Boosting (XGboost), Logistic Regression (LR), Random Forest (RF), Categorical Boosting (Catboost), Light Gradient Boosting Machine (Light GBM) and Support Vector Machine (SVM) with six algorithms using all of selected variables and different model training parameters. Moreover, the PESI and sPESI were existed score systems for assessing PE risk. To determine whether the new model outperformed them, we also testing the predictive ability of PESI and sPESI in training and validation cohorts companied by comparison with the ML model. Finally, we reevaluated the new model in the eICU-CRD cohort. The area under curves (AUC), calibration curves, net reclassification improvement (NRI), and integrated discrimination improvement (IDI) were per- formed to evaluate the prediction performance of discrimination and calibration respectively for all ML models in training and validation cohorts. Decision Curve Analysis (DCA) was also used to explore whether the ML models could improve clinical decision making. SHAP was performed to enhance the interpretability of our models, which can accurately calculate the contribution and impact of each feature on the predicted outcome and present it visually.
Statistical Analysis
Baseline data and clinical outcomes in the training and validation cohorts were expressed. Categorical variables were expressed as percentages and compared by the chi-square test or Fisher's exact test accordingly. Continuous variables were represented as the median with interquartile range and compared using the Mann-Whitney U test. Data cleaning and transformation, variable selection, model building, performance evaluation, and validation were all conducted in R software(version 4.1.4) through appropriate R packages(eg “caret” and “fastshap”).All tests were two-sided, and P ≤ .05 was considered statistically significant.
Results
Baseline Characteristics
A total of 472 patients from MIMIC database were included for model derivation in this study.The patients were divided into training and internal validation groups using complete randomized sampling, with a ratio of 3:1. No statistically significant differences were found between training cohort and validation cohort in most terms and the baseline characteristics of the patients are concretely presented in Table 1. The baseline characteristics of these patients between survival and non-survival groups can be found in Table S2, in which the significant difference is exhibited. After “SMOTE”, the number of cases of the training group increased to 528, including 264 cases of 30-day mortality. Whereas, the validation group consisted of 118 patients, including 30 positive cases and 88 negative cases. In addition, 173 patients from eICU-CRD were extracted as the external validation cohort, with 28 positive cases and 145 negative cases.The detailed baseline information of these patients can be found in Table S2.
Basic Characteristics of the Patients Divided into Training and Testing Cohort.
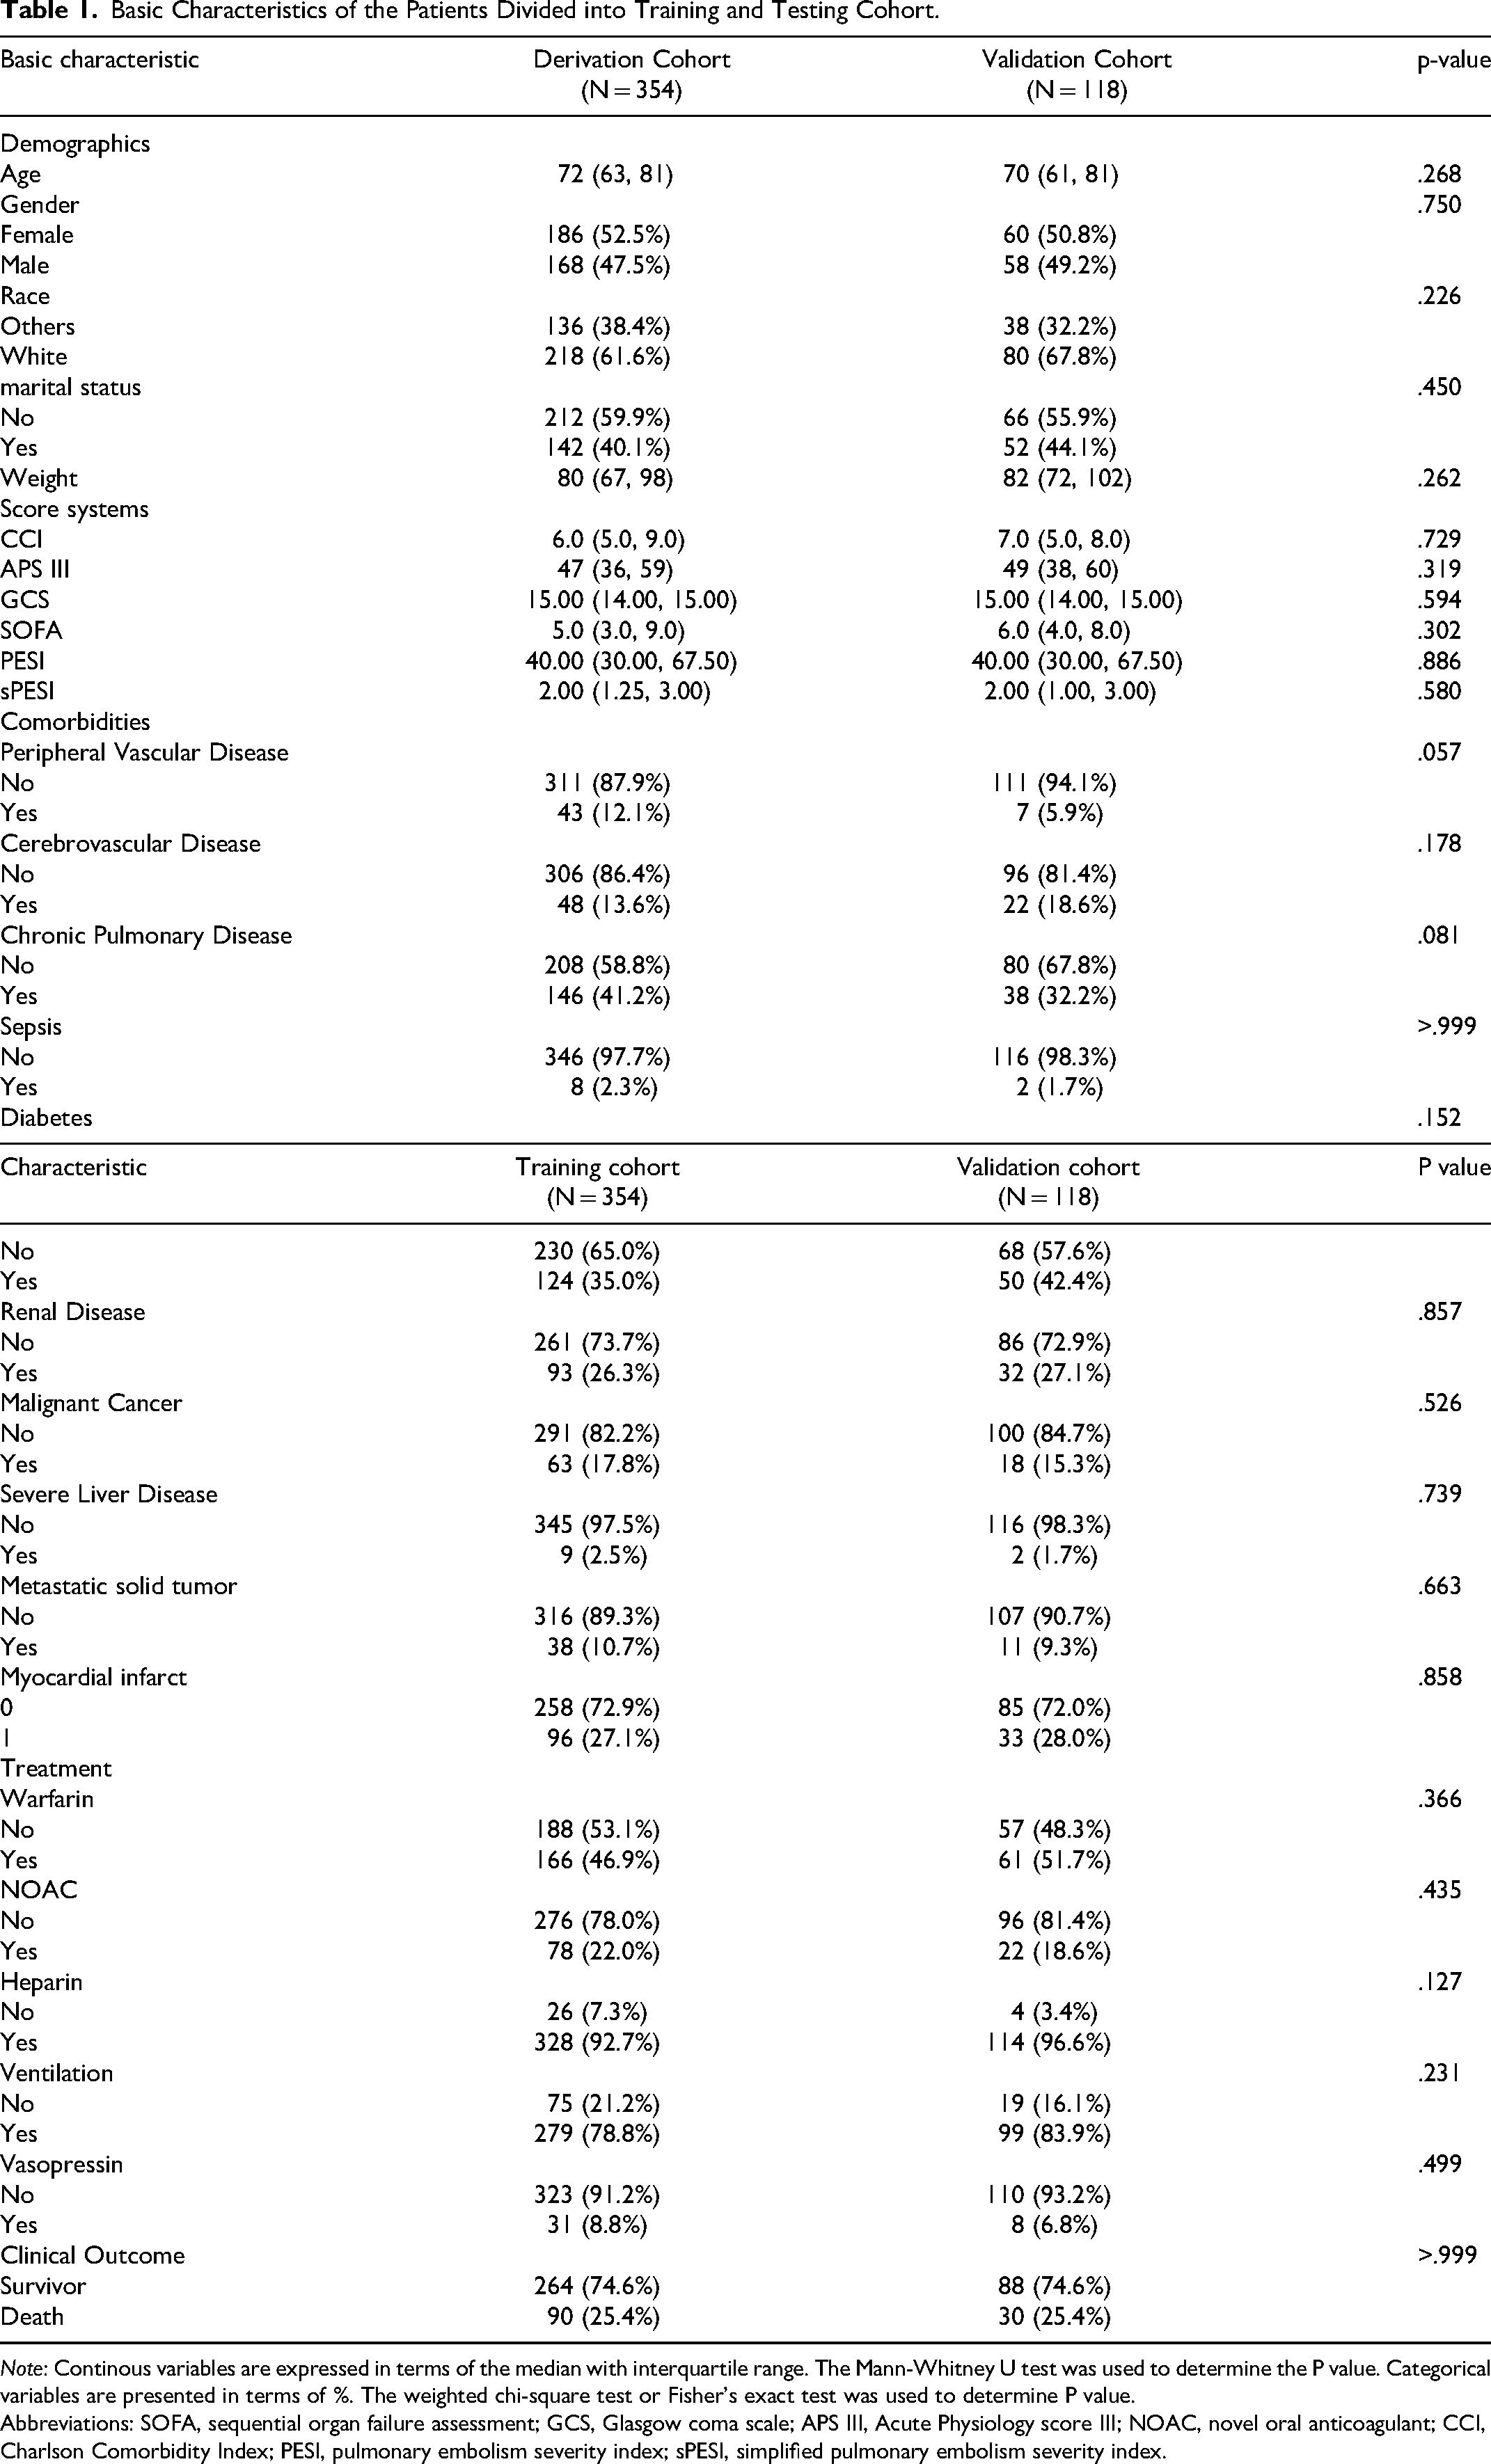
Note: Continous variables are expressed in terms of the median with interquartile range. The Mann-Whitney U test was used to determine the P value. Categorical variables are presented in terms of %. The weighted chi-square test or Fisher's exact test was used to determine P value.
Abbreviations: SOFA, sequential organ failure assessment; GCS, Glasgow coma scale; APS III, Acute Physiology score III; NOAC, novel oral anticoagulant; CCI, Charlson Comorbidity Index; PESI, pulmonary embolism severity index; sPESI, simplified pulmonary embolism severity index.
Construction and Validation of Machine Learning Models
Following variable screening methods displayed in Figure 2, 13 potential independent risk factors (hemoglobin_min, APS III score, WBC_max, SOFA score, CCI, race, ventilation, peripheral vascular disease, malignant cancer, the metastasis of solid tumor, the treatment of warfarin and NOAC, and urineoutput < 400 ml) among PEpHF were identified as predictors for constructing six ML models, whose performance was then evaluated in the internal validation dataset. As the Figure 3A shows, except LR and Light GBM models, the other 4 models both performed well to predict 30-day mortality in training cohort with AUCs over 0.90. The other five metrics for assessing the performance of all six ML models were also evaluated, including sensitivity, specificity, PPV, NPV, and accuracy. As presented in Figure 3C, SVM (0.886, 90.2%, 64.0%, 87.2%, 80.0%, 0.864) performed best. Correspondingly, after processing internal validation, SVM remained well-behaved with the biggest AUC of 0.835 (Figure 3B). Furthermore, when evaluated by calibration curves, SVM performed better when compared to the 3 left models, which owned a wider risk threshold (from 0% to 90%) for obtaining clinical benefit as well (Figure 3D and E, Figure S1, and Figure S2). All the above demonstrated the SVM model was deemed to be selected as the best fitting model. In Figure 3F and Table 2, we further compared the SVM model with PESI and sPESI score systems in predictive efficiency. Corresponding with its previous performance, SVM exhibited better predictive ability than PESI and sPESI scores both in training and validation cohort evaluated by AUC, NRI and IDI with great significance (Figure 3F and Table 1). Ultimately, when validated by the eICU-CRD cohort, the SVM model still maintained a good performance with an AUC of 0.799, which are displayed in Figure S3.
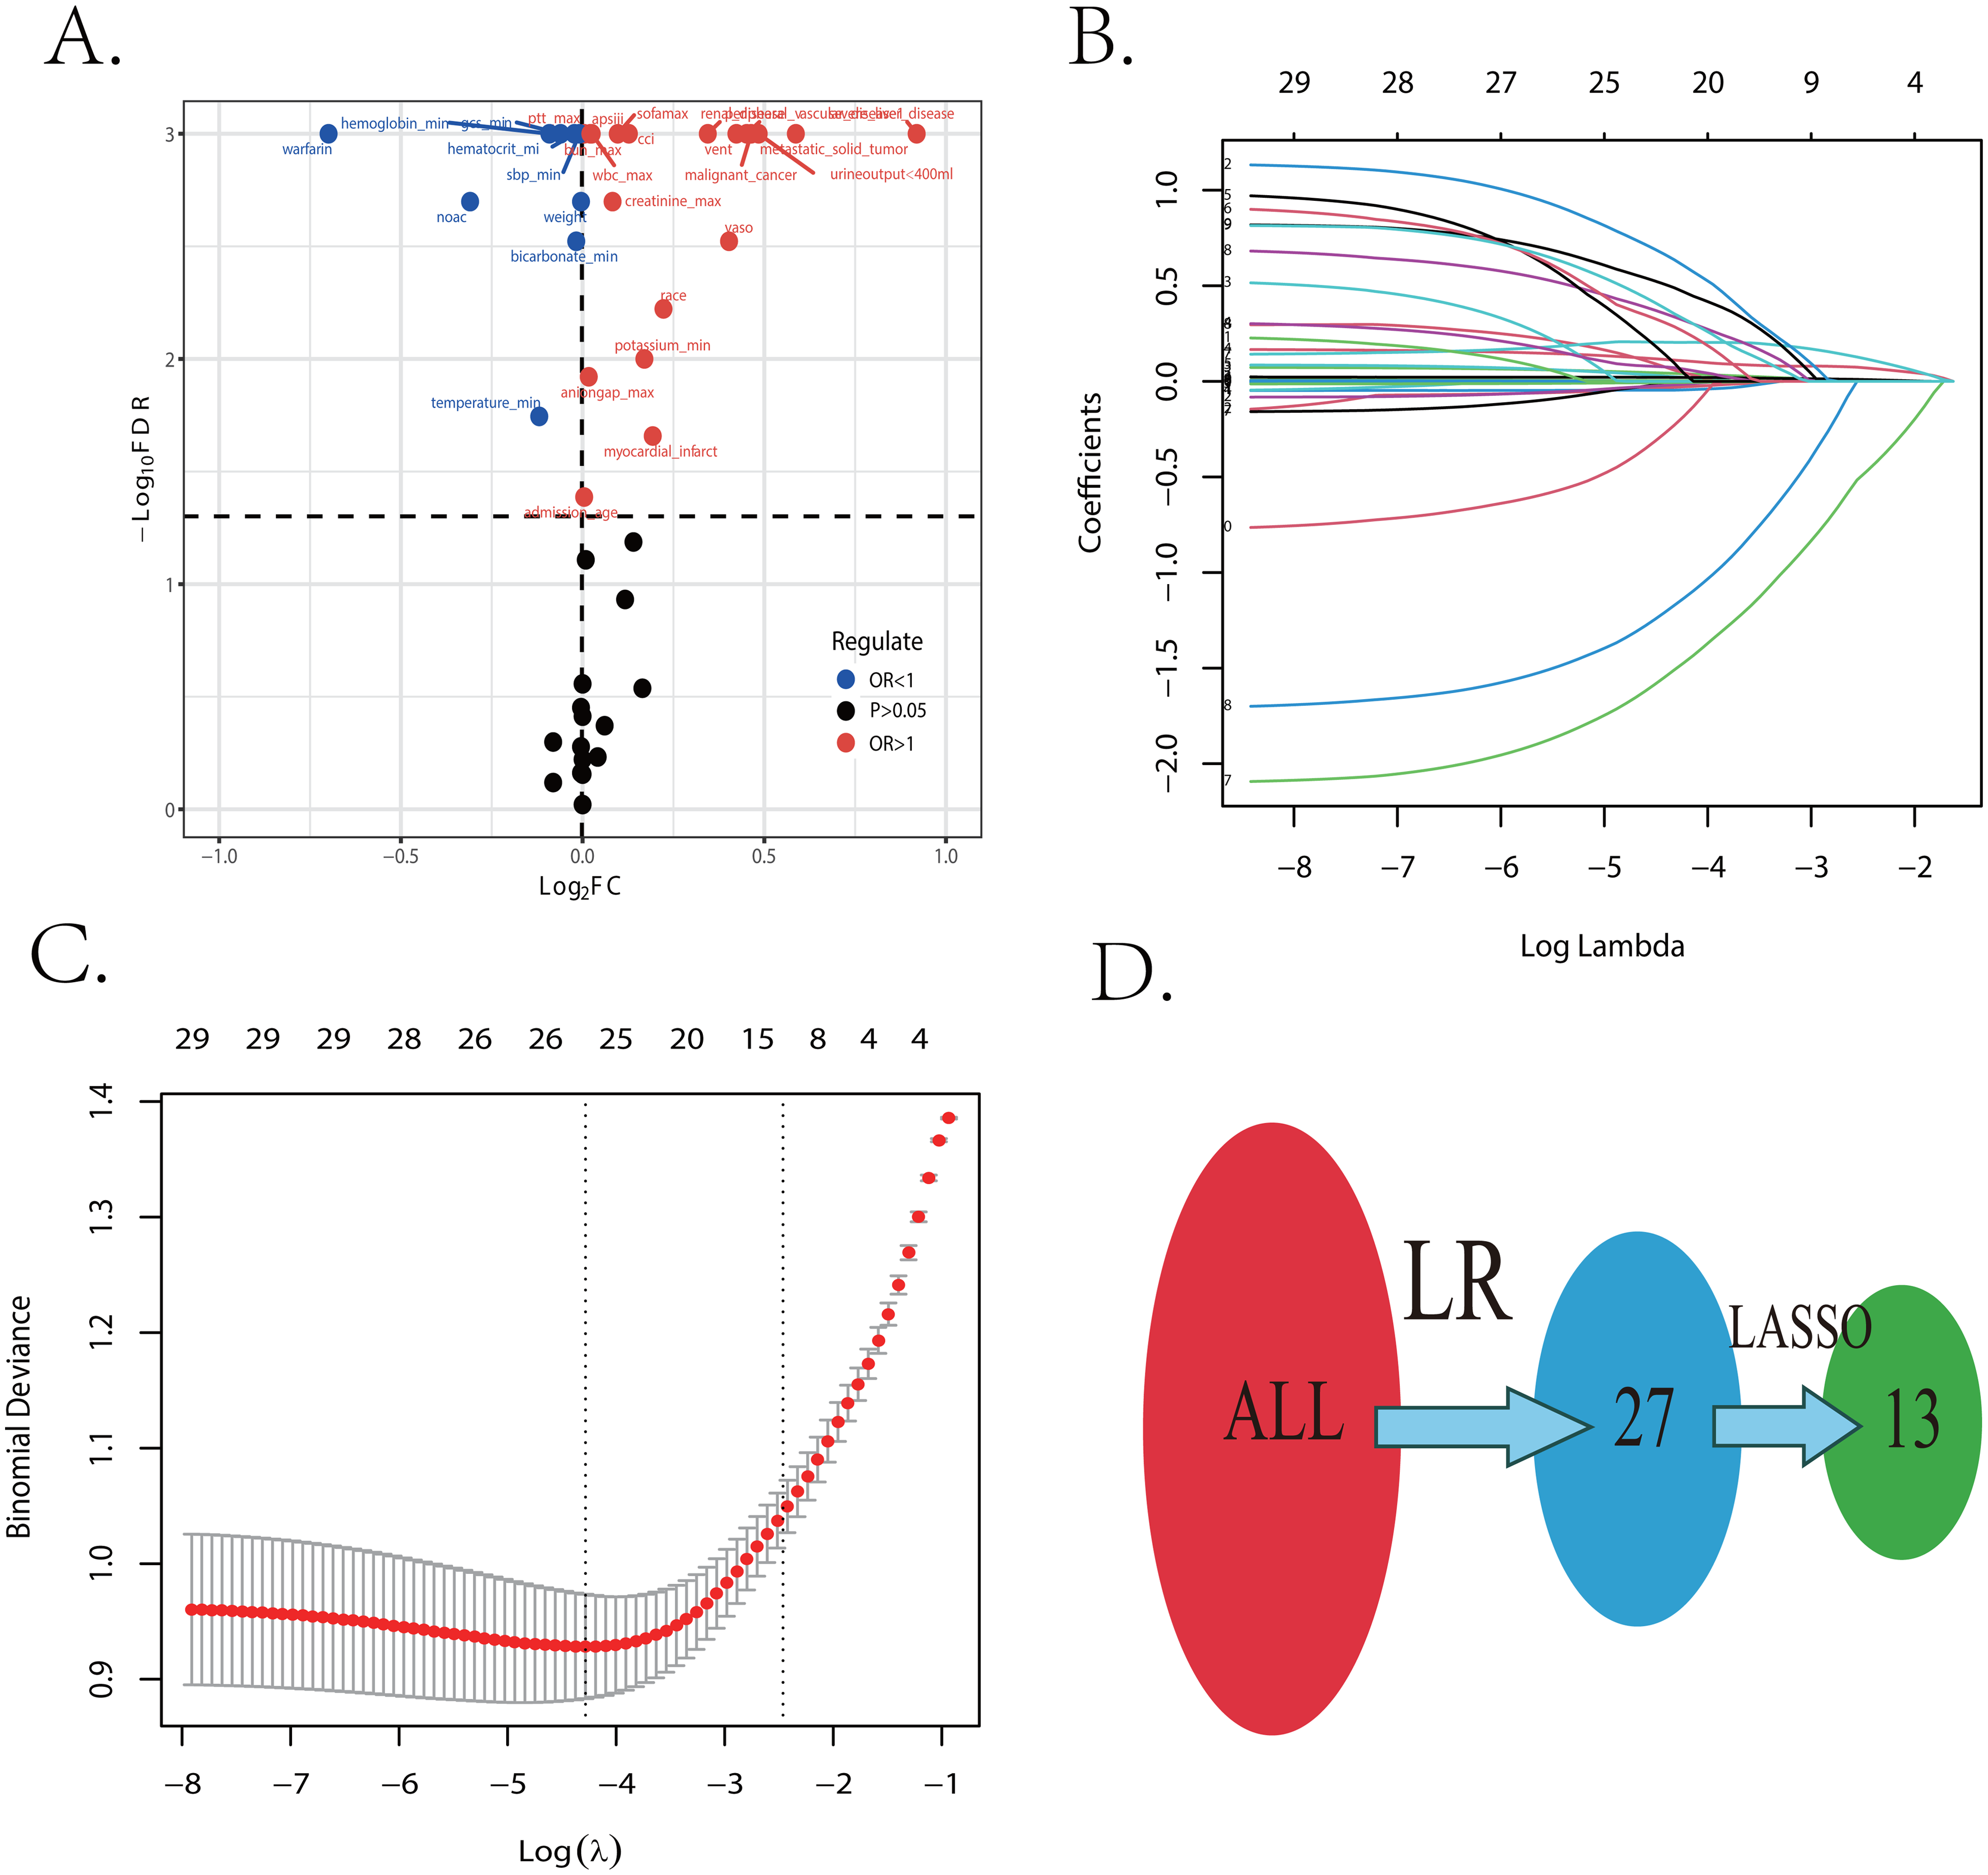
The procession of important features screening. (A) The result of logistic regression between all variables and 30-day mortality. (B and C) The result of LASSO regression to shrunk features. (D) The dynamic procession of important feature selecting. Abbreviations: LR, logistic regression; LASSO, least absolute shrinkage and selection operator; OR, odds ratio; ROC, receiver operating characteristic.
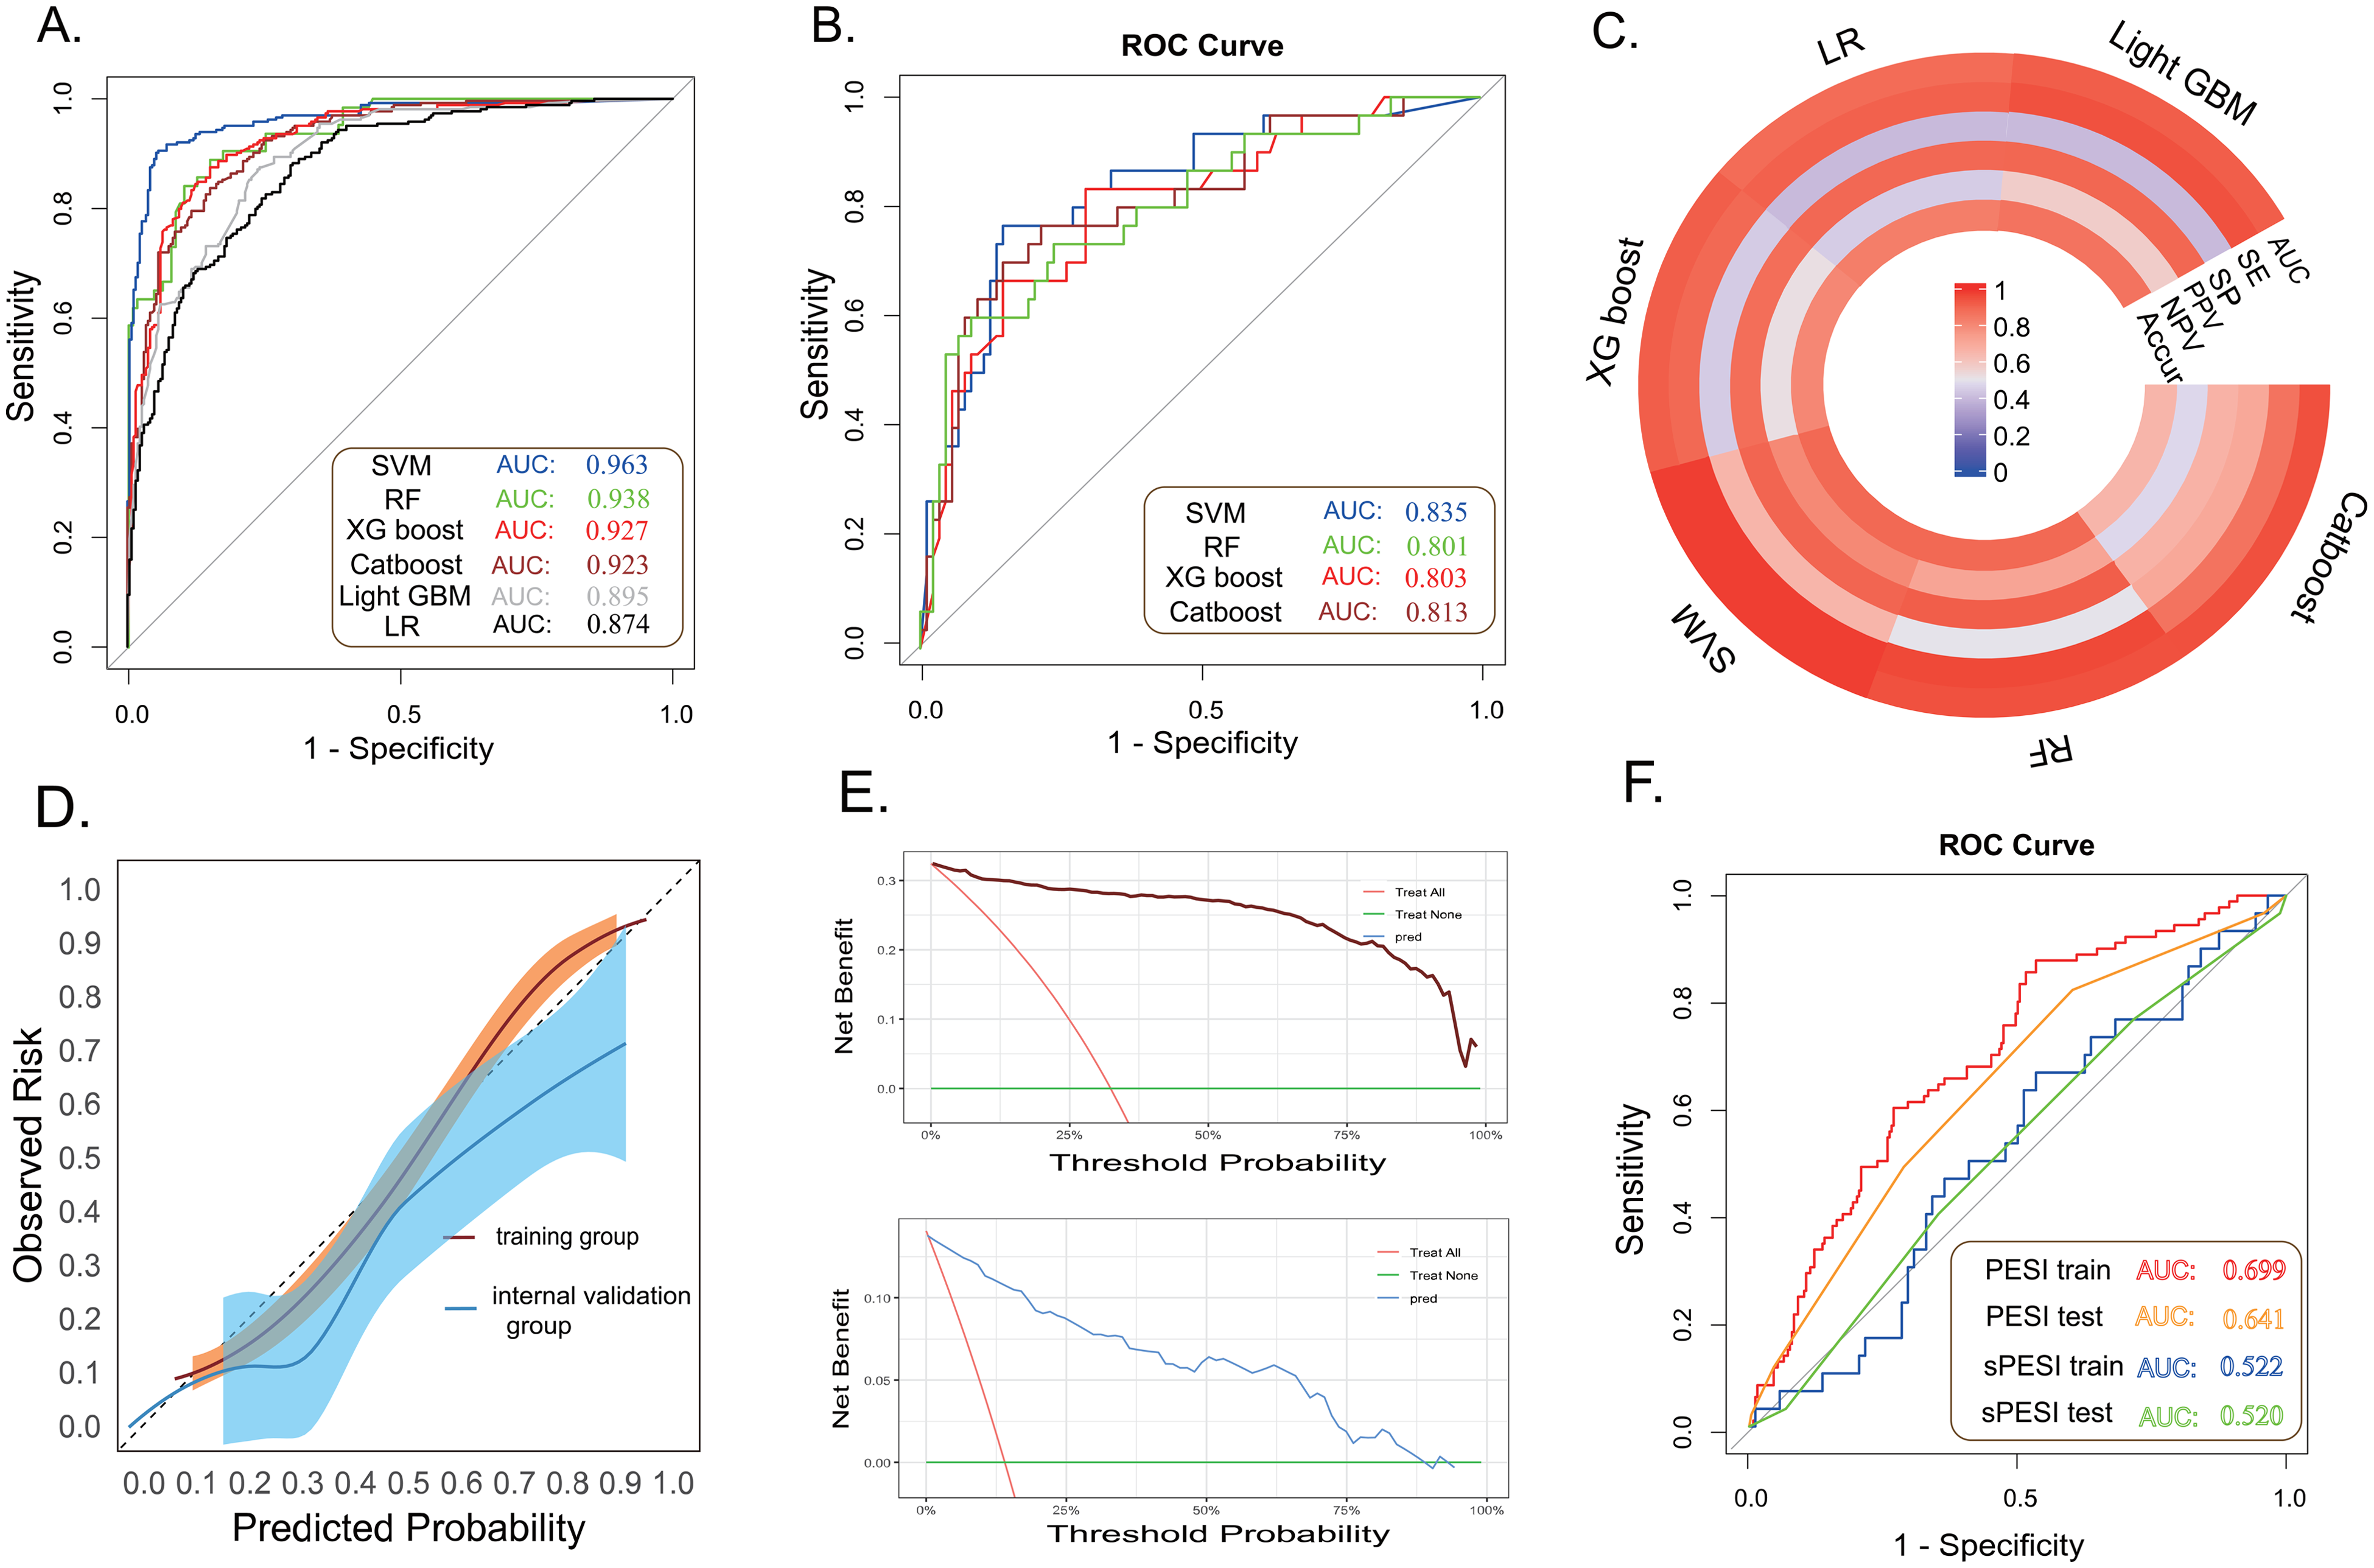
The performance of six ML models in the training and validation cohorts, and comparison between SVM model and PESI (sPESI). (A and B) The AUCs of machine learning models in training and validation cohorts. (C) The ring plot of the detailed performance of six machine learning models in the validation cohort. (D) The AUCs of PESI (sPESI) in training and validation cohorts. (E and F) The calibration and clinical decision curves of the SVM model in training and validation cohorts. Abbreviations: RF, random forest; XGboost, extreme gradient boosting; LR, logistic regression; Catboost, categorical boosting; Light GBM, light gradient boosting; SVM, support vectormachine; SHAP, shapley additive explanation; AUC, area under curve; PESI, pulmonary embolism severity index; sPESI, simplified pulmonary embolism severity index.
Comparison Between the SVM Model and PESI (sPESI) Score Systems in Predictive Efficiency.
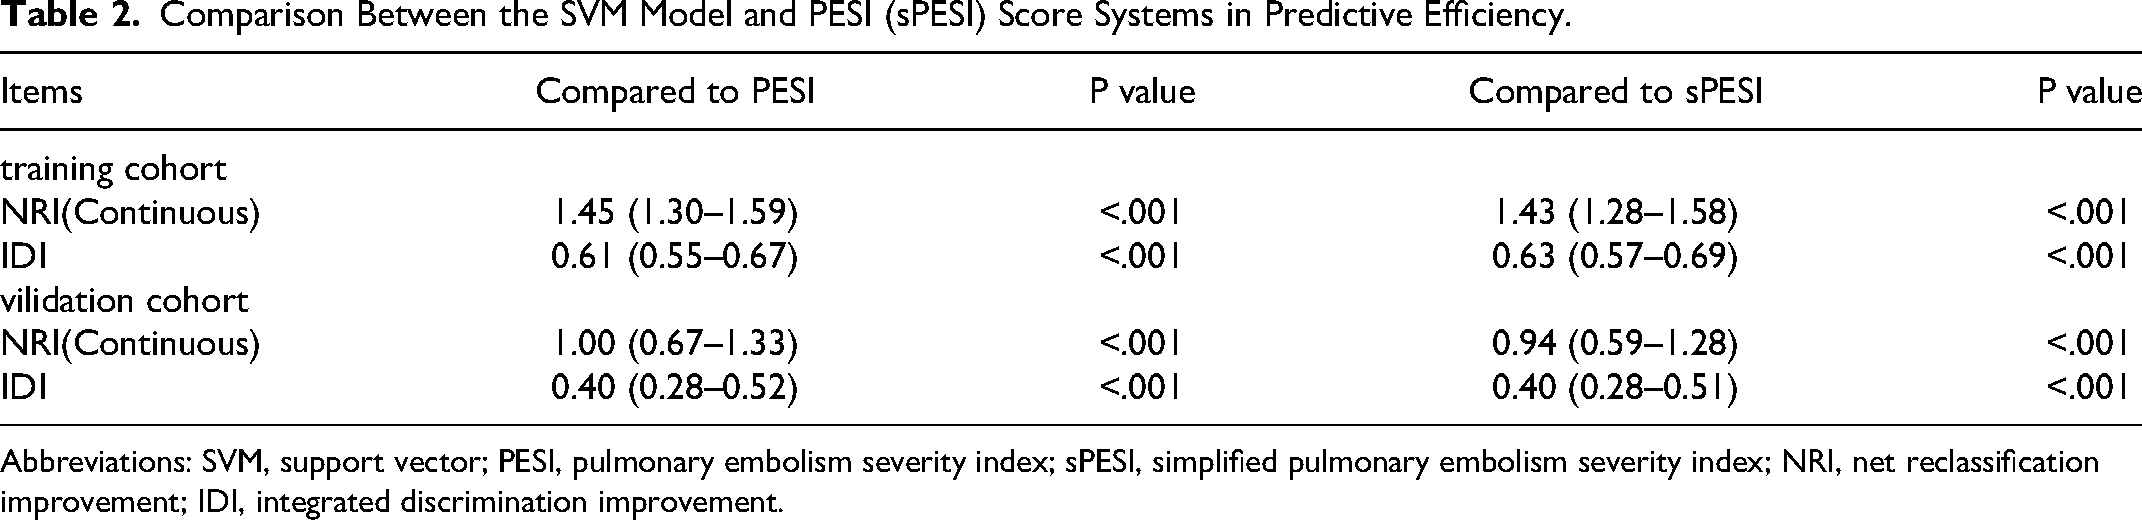
Abbreviations: SVM, support vector; PESI, pulmonary embolism severity index; sPESI, simplified pulmonary embolism severity index; NRI, net reclassification improvement; IDI, integrated discrimination improvement.
Model Interpretation and Visualization
To make ML models explainable and interpretable, the SHAP method is utilized to interpret the output of the final model by calculating the contribution of each variable to the prediction, which is consist of global explanation of the model at the feature level and local explanation at the individual level. Global explanation described the overall functionality of the model. To characterize the significance of characteristics, the importance of each feature in different models were further ranked by calculating SHAP value. Figure 4A depicts the importance of predictor variables in the SVM model, with the use of warfarin exerting the greatest impact. What's more, the strength and direction relationships of the predictors with 30-day mortality in PEpHF are further displayed in Figure 4B. For example, patients who didn’t receive the treatment of warfarin or NOAC were more likely to suffer a worse survival outcome, while urine output >400 mL were a protective factor. In addition, local explanation can analyzed how a certain prediction was made for a specific individual by incorporating the individualized input data. Figure 4C shows a patient who didn’t suffer a 30-day death during the ICU stay in the waterfall plot and Figure 4D shows another patient who suffered a 30-day death during the ICU stay. Finally, in order to facilitate the clinical application and promotion of the model, we have built a web app based on the SVM model simultaneously on https://fkd9fq-zhenli- li.shinyapps.io/predict, which can output prediction probabilities of all cause death within 30 days after ICU admissions (Figure 5).
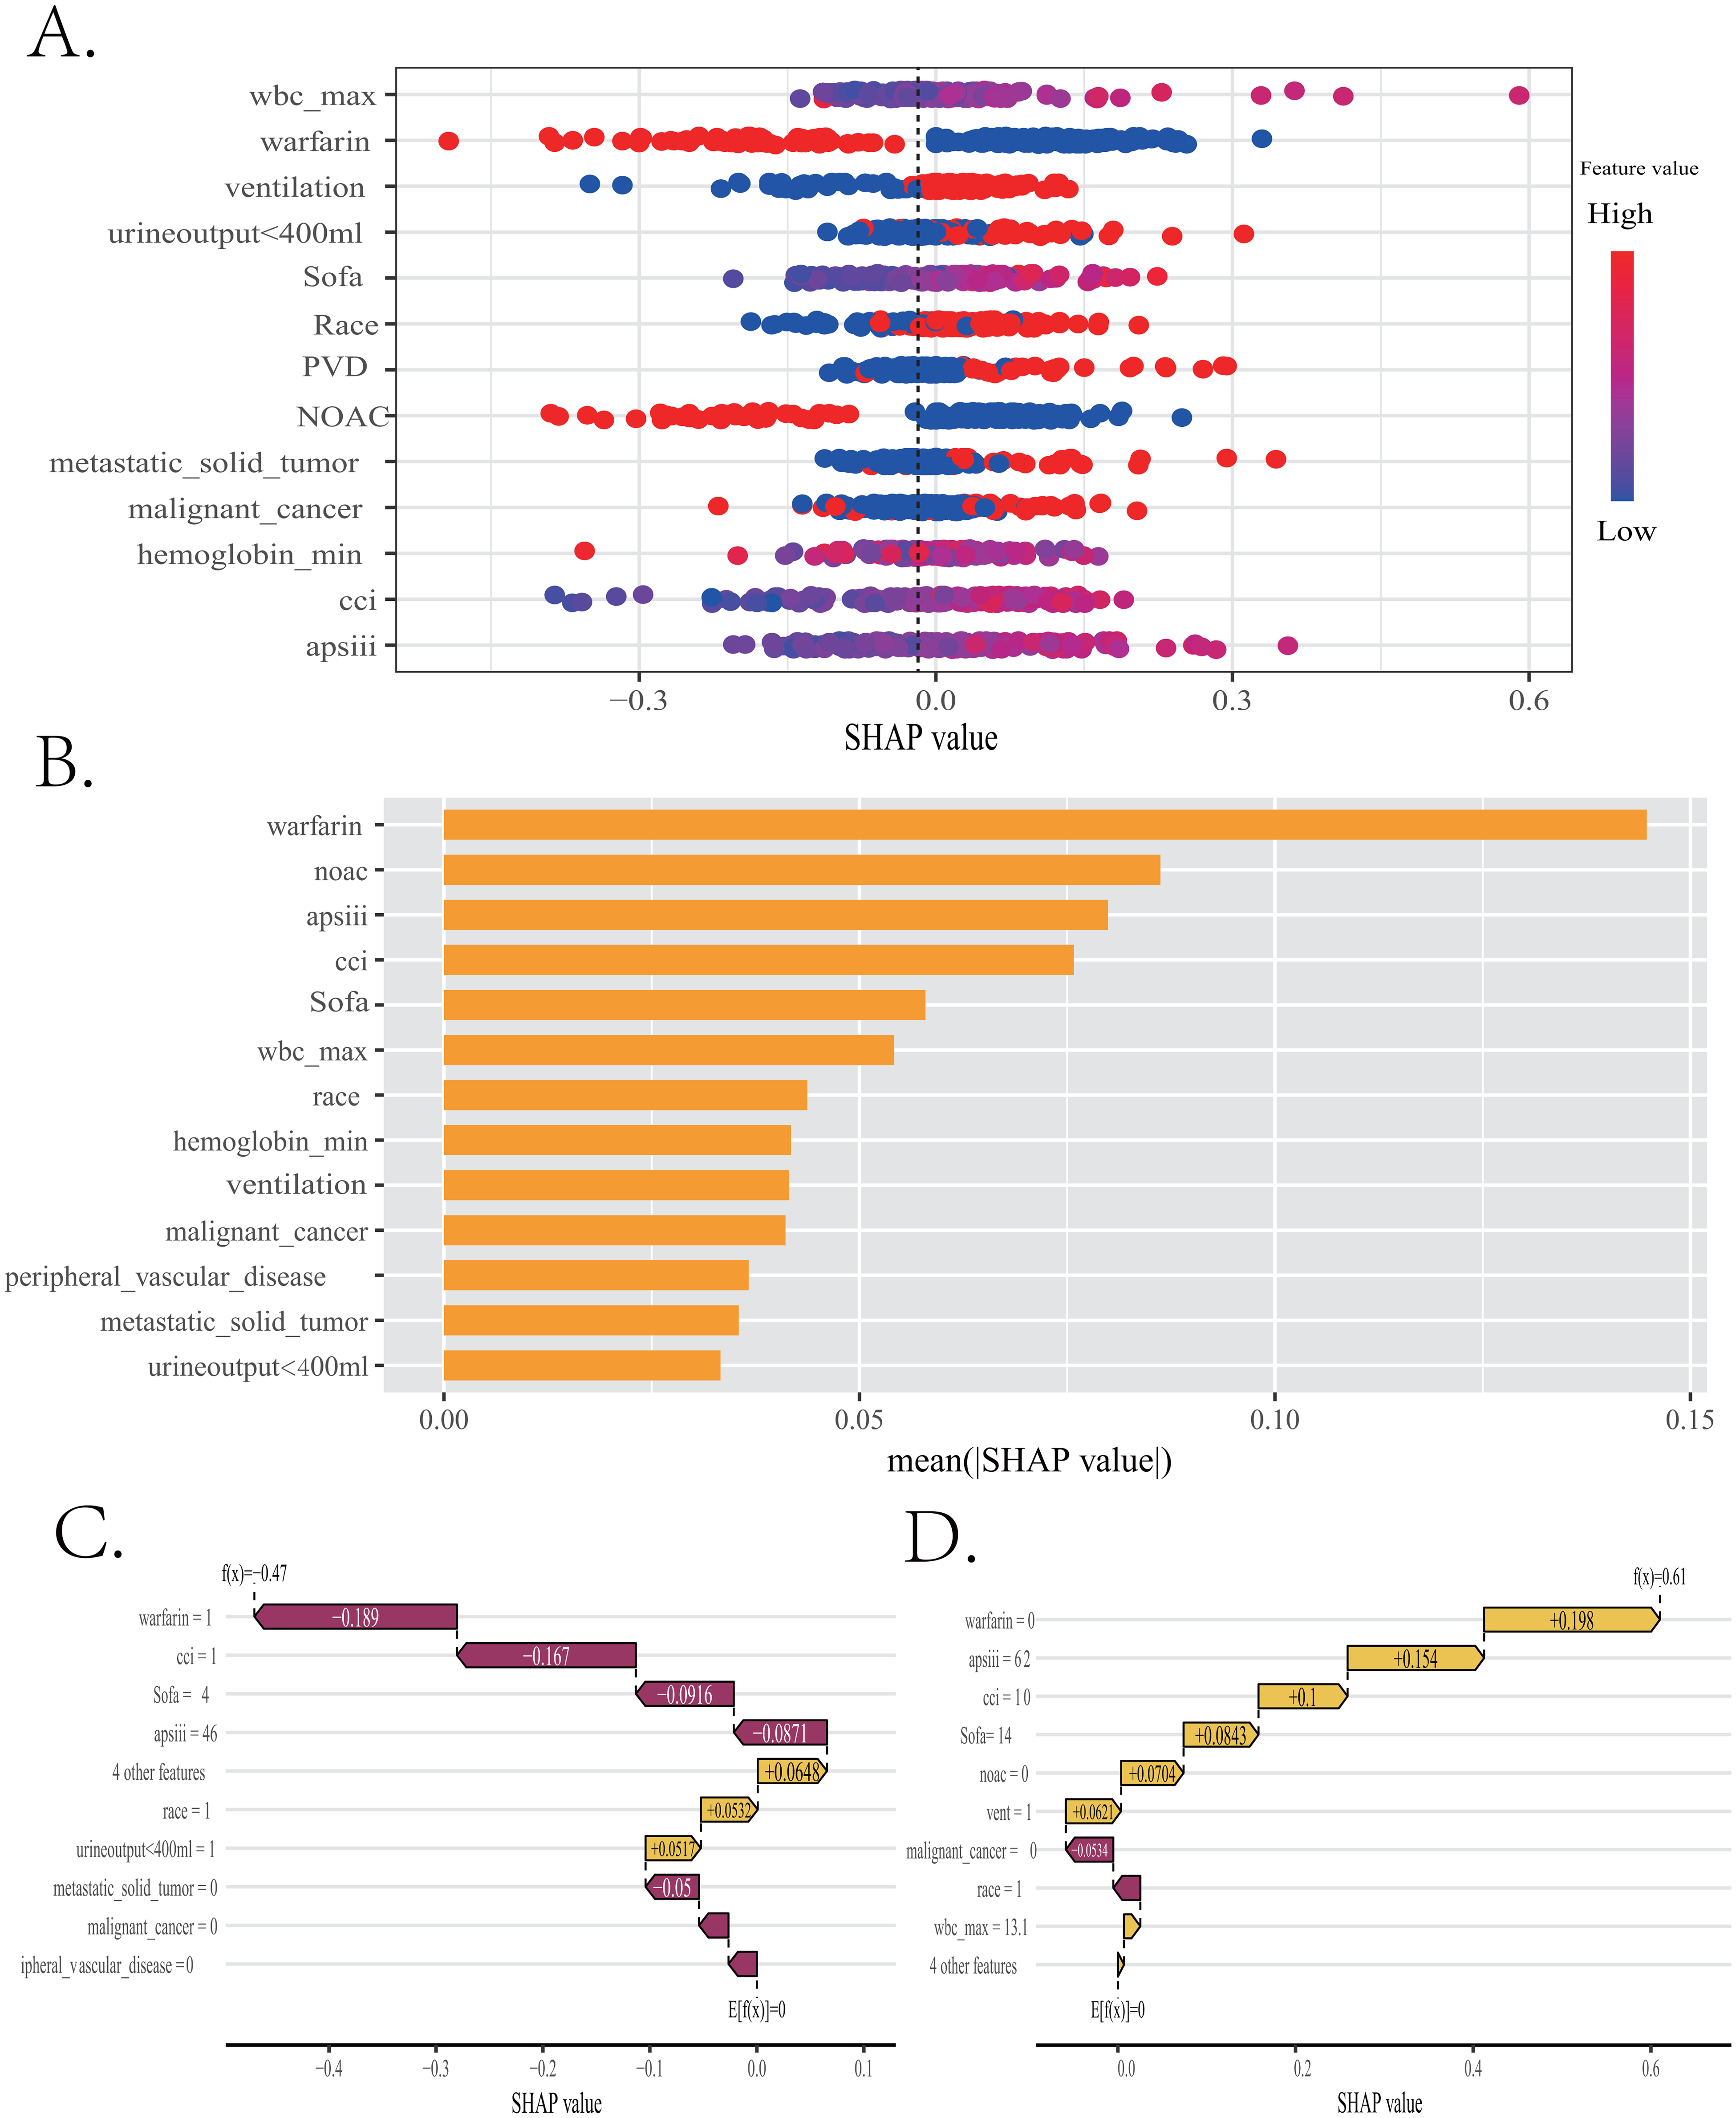
Global and local model explanation of SVM model by the SHAP method. (A) SHAP summary dot plot to show the strength and direction relationships of the predictors with 30-day mortality in pulmonary embolism patients with heart failure(PEpHF). (B) A summary plot of importance scores of the selected features. (C and D) Waterfall plots to analyze how a certain prediction was made for a specific individual by incorporating the individualized input data. SVM, support vector machine.
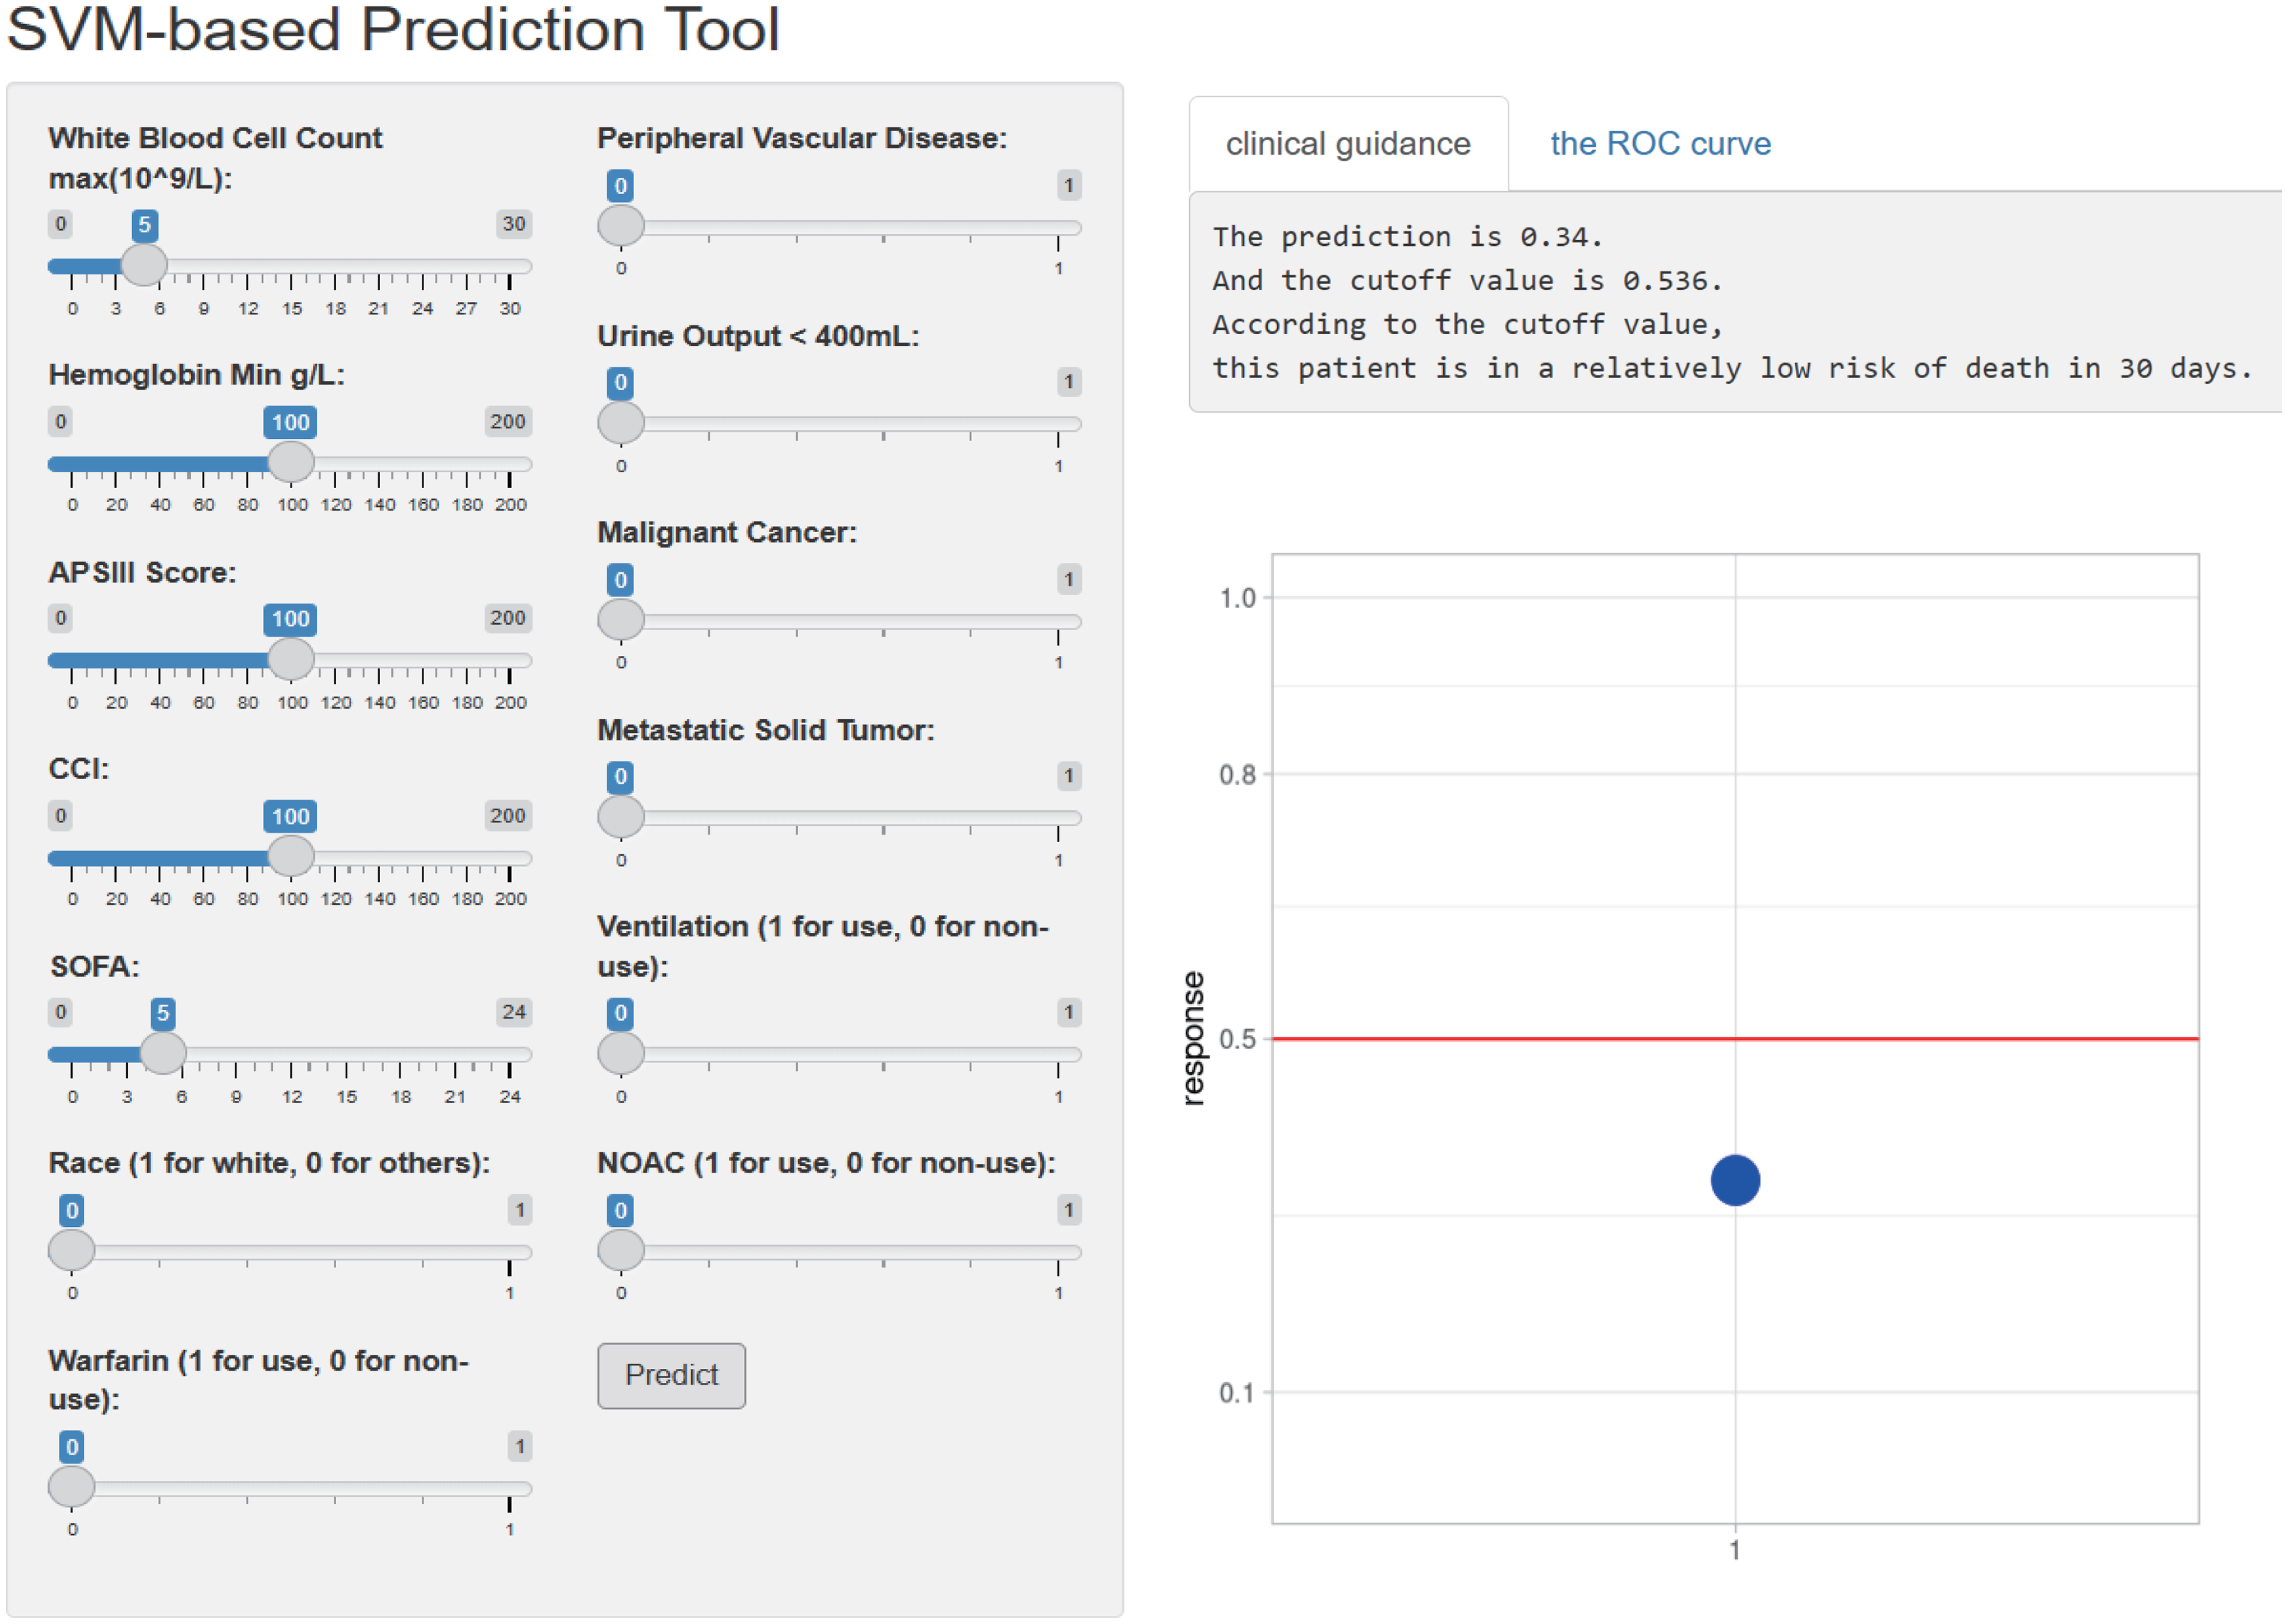
The web APP deployed based on a SVM model to predict mortality risk for clinical use. Abbreviations: SVM, support vector machine.
Discussion
The Feasibility of the ML Model Construction for PEpHF
Up to now, numerous studies have concentrated on predictive ML-based models construction of short-term mortality among PE or HF groups respectively,19,20 but there still remains a vacancy for mortality prediction of PEpHF due to scattered and incomplete case recording. MIMIC databases, which are more convenient for clinicians and researchers to gain detailed clinical data, with sophisticated ML algorithms can facilitate the development of clinical prediction models. 25 This is the first prospective study, to our knowledge, to investigate and compare 6 ML models for predicting 30-day mortality of PEpHF from ICU cohorts, in which a series of risk features were also identified and analyzed. Within 6 ML models, the SVM model displayed the best AUC value accompanied by a good net benefit and a well-fitted calibration curve in both internal and external validating process. SVM, with the best hyperplane separating classes in highdimensional space, is based on kernel function and is widely used as a classification model.25,26 Moreover, several studies have regarded this method as a well-behaved ML algorithm in the field of medicine.27,28 Hence, we accordingly employed the SVM algorithm to develop the final model with 13 strongly-related clinical features, which can be obtained or evaluated easily within the first 24 h admission. Thus, it makes this model promising as an early discriminating tool of 30-day mortality for PEpHF in ICU.
The PESI includes a larger array of patient variables along with a significantly greater discriminatory power. 21 The sPESI is another risk stratification score system to quickly classify PE patients at high or low risk, which has also been reported to have a low specificity with a significant proportion of intermediate risk patients potentially being classified as low- risk conversely. Therefore, we compared the discrimination ability between the optimal SVM model and preceded PESI. The result showed SVM model exhibited an overwhelming predictive performance. Correspond with our finding, previous studies have discovered that PESI scoring system indeed have some deficiency, such as poor prediction performance, low sensitivity and specificity to predict the diagnosis in PE patients, compared with ML models.18,29 Nevertheless, though the ML method is powerful towards high dimensional processing, it is still limited by how to stating a transparent interpretation, known as a “black-box”. 22 The SHAP method could explain a ML model via a global explanation to describe overall functionality of different variables and a local explanation to display how a individualized variables’ contribution combines the final prediction. Hence, the SHAP method was utilized to explain the ML models and visualize individual variable predictions to dispel doubts of clinicians for further clinical application in our study.
The Relationship Between the Selected Features and Prognostic Outcome
For patients with confirmed PE, therapeutic anticoagulation is the cornerstone of treatment, and unfractionated heparin (UFH) is recommend by the ESC/ERS guidelines and lower risk PE can be treated with a NOAC from diagnosis. 30 In addtion, the treatment of NOACs and warfarin performed as a protective factor of short-term mortality for PEpHE in the present study. From this perspective, patients who used warfarin or NOACs may be associated with a relatively lower risk at initial anticoagulation therapy, which is parallel with a better prognosis among PE patients. From another perspective, several studies have already demonstrated anticoagulation improves the prognosis of HF patients, which may increase the protective ability. In addition, SOFA score, CCI score, and APS III score all displayed relatively high prediction importance in SVM model of the present study for predicting the short-term mortality of PEpHF. Correspondingly, these score systems have been generally regarded as prognostic factors among patients in ICU, including critically ill patients with PE and HF.31–33
For hematological indicators, Venetz et al 34 have demonstrated the elevation in WBC count is a independent predictor of adverse clinical outcomes and accounts for left ventricular dysfunction.Furthermore, a > 12.6 × 10⁹ /L WBC count was found associated with a higher risk of 30-day mortality in a large cohort with acute PE. Growing animal and autopsy studies revealed efflux of neutrophils, monocytes and lymphocytes caused by chemokine synthesis in the right ventricular could cause cardiomyocyte injury and necrosis by releasing enzyme, chemokines and other pro-inflammatory cytokines, which would lead to fibrosis development and irreversible RV dysfunction.35,36 Neutrophils produce neutrophil extracellular traps (NETS) and neutrophil derived microparticles (NMP) are the core of thrombotic process by promoting platelet adhesion and coagulation cascade. Correspondingly, WBC count functioned significantly in different ML models of our study, the elevation of which may be a marker for hypercoagulability. 37 Moreover, Kostev et al demonstrated anemia was a parameter with an 1.34 odd ratio for in-hospital mortality in PE patients hospitalized38,39 and another study demonstrated anemia may be a reliable indicator of both short-and long-term all-cause mortality as well as the rates of all-cause HF events. 40 Consistent with this, we also discovered the decrease of hemoglobin was a independent risk factor for PEpHF in ICU.
The prevalence of venous thromboembolism (VTE) can often present as the first symptom of malignancy. Cancer-associated PE is one of the most important risk factors contributing to cancer mortality. 41 The Kaplan-Meier analysis of a retrospective study showed significantly higher mortality in cancer-associated PE patients than in non-cancer patients. 42 Another study revealed that metastatic cancer was a significant prognostic factor of long-term mortality in cancer patients with PE. 43 Moreover, patients with HF showed higher cancer-related mortality than those expected for the general population. 44 Another comorbidity, callled PVD, has also been found to be associated with mortality as well as a twofold increase in the prevalence rehospitalization in patients with HF or PE.45,46 Especially, peripheral artery disease has been reported to be associated with a worse overall prognosis and all- cause mortality in HF patients, which highlights its importance as a comorbidity.47,48 Additionally, among PAD patients with HF, impaired physical function may relate to skeletal muscle abnormalities or a mixture of central and peripheral hemodynamic abnormalities, 48 especially in HFpEF, which indicates further reducing cardiovascular fitness and negatively affect patient prognosis. According to the above, the comorbidities of cancer and PVD are reliable predictors, which confirms the direction of the SHAP values in our study.
Mechanical ventilation, as one of the most commonly used life support strategies in ICU, is mainly used to support patients with respiratory insufficiency due to serious illness. Ventilator- associated pneumonia (VAP), ventilator-associated lung injury (VALI), and neuromuscular asthenia, as common complications of mechanical ventilation, may also worse the prognosis at ICU duration. Its utilize also presented as an adverse factor contributing to mortality risk accumulation in our study. Indeed, a decreased UO may indicate low renal perfusion and con- sequent fluid overload, which in turn contributes to subsequent organ dysfunction. 49 Several studies demonstrated that UO is another haemodynamic marker that reflects haemodynamic stability in patients with RV failure. 50 Actually, for elderly patients with HF, decreased 24 h UO often indicates severe impairment of cardiac function, especially when combined with renal insufficiency, leading to an increased risk of death. 51 Furthermore, patients with severe PE are more likely to develop acute kidney injury (AKI); little urine are associated with renal insufficiency, which may indicate inadequate blood volume in patients. From another perspective, oliguria has also been found associated with the occurrence of postoperative PE, which may aggravate the thrombus load by a mean of positive feedback.52,53 Hence, it is necessary to closely observe changes in urine output.Correspondingly, we also involved it as a predict factor in the format of a division by a threshold of 400 mL per day.
Clinical Prospect
As we stated above, the clinical prediction models of short-term mortality for PEpHF are still rare. To our best knowledge, we firstly established a ML model to better manage this group for clinical practice, which showed good predictive accuracy and overall net benefit. Our study may display significant potential to guide clinicians in making appropriate decisions on risk stratification and optimizing patient care to some extent. To better adapt to further clinical demand, we also developed an online web version of the APP on https://fkd9fq-zhenli-li.shinyapps.io/predict (Figure 5). Some limitations are as follows. Firstly, a relatively limited number of patients were included due to the characteristic of single center study. Hence, for future generality, a further external validation of patients in other clinical centers is required to improve the confidence of the results. Secondly, the only criteria for case selection were ICD codes which may influence the quality of the patients included in the study and cause bias. Thirdly, because the data come from only one database and the majority of patients were white, potential bias may be observed.At last, some variables may not included due to the sever missing, such as D-dimer and CRP. Nevertheless, we believe that the proposed model may contribute to further understanding of the mortality of PEpHF.
Conclusion
The study successfully developed and validated a ML-based tool to predict 30-day mortality in PEpHF from ICU. Among the six ML algorithms compared, the SVM model demonstrated the best predictive performance after validating, outperforming traditional score systems such as PESI and sPESI. Moreover, it was also validated by eICU-CRD database and showed a relatively good performance. SHAP analysis further elucidated the impact of key features on the model's predictions from overall and local prospects. However, other external validation is still needed to reaffirm the model and explore its applicability across broader patient populations. Correspondingly, we have developed online tools for further external validation and clinical use. In conclusion, our study, to some extent, highlights the significant potential of ML method in predicting short-term mortality risk for PEpHF in ICU, offering a potential choice for clinical decision-making.
Supplemental Material
sj-docx-1-cat-10.1177_10760296241304764 - Supplemental material for Interpretable Machine Learning Approach for Predicting 30-Day Mortality of Critical Ill Patients with Pulmonary Embolism and Heart Failure: A Retrospective Study
Supplemental material, sj-docx-1-cat-10.1177_10760296241304764 for Interpretable Machine Learning Approach for Predicting 30-Day Mortality of Critical Ill Patients with Pulmonary Embolism and Heart Failure: A Retrospective Study by Jing Liu, Ruobei Li, Tiezhu Yao, Guang Liu, Ling Guo, Jing He, Zhengkun Guan, Shaoyan Du, Jingtao Ma and Zhenli Li in Clinical and Applied Thrombosis/Hemostasis
Supplemental Material
sj-xlsx-2-cat-10.1177_10760296241304764 - Supplemental material for Interpretable Machine Learning Approach for Predicting 30-Day Mortality of Critical Ill Patients with Pulmonary Embolism and Heart Failure: A Retrospective Study
Supplemental material, sj-xlsx-2-cat-10.1177_10760296241304764 for Interpretable Machine Learning Approach for Predicting 30-Day Mortality of Critical Ill Patients with Pulmonary Embolism and Heart Failure: A Retrospective Study by Jing Liu, Ruobei Li, Tiezhu Yao, Guang Liu, Ling Guo, Jing He, Zhengkun Guan, Shaoyan Du, Jingtao Ma and Zhenli Li in Clinical and Applied Thrombosis/Hemostasis
Footnotes
Declaration of Conflicting Interests
The authors declared no potential conflicts of interest with respect to the research, authorship, and/or publication of this article.
Funding
The authors disclosed receipt of the following financial support for the research, authorship, and/or publication of this article: This work was supported by the Foundation of Hebei Provincial Department of Science and Technology, (grant number 223777114D).
Supplemental Material
Supplemental material for this article is available online.
References
Supplementary Material
Please find the following supplemental material available below.
For Open Access articles published under a Creative Commons License, all supplemental material carries the same license as the article it is associated with.
For non-Open Access articles published, all supplemental material carries a non-exclusive license, and permission requests for re-use of supplemental material or any part of supplemental material shall be sent directly to the copyright owner as specified in the copyright notice associated with the article.