
Abstract
Objective
DNA methylation, as an epigenetic alteration, plays an essential role in the development of atherosclerosis and venous thrombosis. E-cadherin, a tumor suppressor gene and adhesion molecule, has a crucial function in platelet aggregation and hemostasis. P16, a cell cycle regulator, is involved in venous thrombosis. The aim of this study is to evaluate the DNA methylation patterns and expression levels of the E-cadherin and P16 genes in venous thromboembolism (VTE).
Method
Peripheral blood samples were collected from 32 patients, including those with deep vein thrombosis (DVT, n = 15), pulmonary embolism (PE, n = 8), DVT with PE (n = 4), intestinal thrombosis (IT, n = 3), and cerebral venous sinus thrombosis (CVST, n = 2), as well as from 10 healthy individuals. The DNA methylation patterns and gene expression levels of E-cadherin and P16 were analyzed using methylation-specific PCR (MSP) and Real-Time PCR, respectively.
Results
The promoter of the CDH1 gene was partially methylated in 84.4% of thrombotic patients and unmethylated in 15.6% (P = 0.183). A significantly higher expression level of CDH1 was observed in the patients compared to the controls (P = 0.001). The P16 gene promoter were unmethylated in all control and patient specimens. Compared to normal subjects, the expression level of the P16 was significantly increased in patients (P = 0.000).
Conclusion
Our results indicated that DNA methylation is not the main gene expression regulatory mechanism for E-cadherin and P16 genes in thrombosis. Higher transcription levels of CDH1 and P16 in thrombotic patients may show their crucial roles in the pathogenesis of VTE.
Introduction
Venous thromboembolism (VTE) is the pathological formation of blood clots in veins, encompassing disorders such as deep vein thrombosis (DVT) and pulmonary embolism (PE). This condition leads to the restriction of blood flow and ischemia.1,2 In the United States, the annual incidence and mortality of VTE are 300,000–600,000 and approximately 100,000–180,000 cases, respectively.3,4
Epigenetic modifications, including DNA methylation, histone modification, and non-coding RNAs (ncRNAs), are non-genetic heritable changes in the genomic structure without any alteration in the DNA sequence. These modifications play a pivotal role in the regulation of gene expression.5,6 DNA methylation is the first epigenetic modification identified and well-recognized in DNA, occurring by the addition of methyl groups to 5'-cytosine residues in the cytosine-phosphate-guanine (CpG) islands.7,8 This process is conducted by DNA methyltransferase enzymes (DNMTs) and results in the silencing of gene expression. In contrast, hypomethylation of DNA leads to increased transcription and gene expression. 7 Current information indicates that epigenetic mechanisms, especially miRNAs and DNA methylation, may modulate hemostasis, atherosclerosis, coronary artery disease (CAD) progression, and ischemic/reperfusion injuries.3,9 However, few studies have been conducted in this field, and further investigation is needed.
E-cadherin, a calcium-dependent cell adhesion molecule encoded by the CDH1 gene, is located at the chromosomal position 16q22.1. Commonly recognized as a tumor suppressor gene, E-cadherin inhibits the metastasis of tumor cells and undergoes mutations in various epithelial malignancies. Additionally, E-cadherin plays a pivotal role in embryogenesis. 10 Many studies have demonstrated the hypermethylation of E-cadherin in nasopharyngeal carcinoma, cervical carcinoma, ovarian carcinoma, breast cancer, and acute lymphoblastic leukemia.11–17 On the other hand, previous studies have highlighted the important effects of E-cadherin on platelet-endothelial interactions, platelet clot stabilization, and hemostasis following acute thrombocytopenia.18,19 Some studies have shown the expression of E-cadherin in platelets and its effective role in platelet aggregation, thrombus generation, and signal transduction.18,19 Knockout of E-cadherin in mice results in platelet dysfunction, extended bleeding time, and diminished fibrin deposition at the site of injury. Platelets with E-cadherin deficiency usually exhibit a normal response to ADP but display a defective response to thrombin. moreover, the loss of E-cadherin in platelets reduces Akt signaling and GSK3β activity during thrombin stimulation, ultimately leading to clot instability. 19
P16, a tumor suppressor gene located at the 9p21.3 position, modulates two primary cell cycle pathways, including the p53 and retinoblastoma (Rb) trajectories. 20 P16 inhibits the phosphorylation of retinoblastoma protein by interrupting the cyclin D/CDK4 kinase complex. The release of essential transcription factors for cell cycle progression from G1 to S phase is impeded by Rb hypo phosphorylation. 21 In addition, P16 has an important role in cell senescence and apoptosis. 22 The hypermethylated status of the P16 gene promoter has been shown in liver cancer, oral squamous cell carcinoma (OSCC), cervical cancer, and gastric cancer.23–26 Former research revealed a powerful correlation of the 9p21 genetic locus with the risk of coronary artery disease (CAD), carotid atherosclerosis, and ischemic stroke. Primary cultures of vascular smooth muscle cells (VSMCs) with a deletion at the 9p21 position exhibited extreme proliferation following decreased CDKN2A and CDKN2B expression. 27 Conversely, another study discovered that a higher expression level of P16 contributes to increased vascular closure and restricted dissolution of blood clots, leading to venous thrombosis. 28
In this regard, although DNA methylation of E-cadherin and P16 genes has been evaluated in various malignancies, there is no information regarding the patterns of E-cadherin and P16 in thrombotic disorders. The purpose of this study was to investigate the DNA methylation patterns and expression levels of E-cadherin and P16 genes and explore the correlation of these results with different types of thrombosis.
Materials and Methods
Sample Collection
This case-control study was performed on 32 patients with thrombosis, including deep vein thrombosis (DVT, n = 15), pulmonary embolism (PE, n = 8), DVT with PE (n = 4), intestinal thrombosis (IT, n = 3), and cerebral venous sinus thrombosis (CVST, n = 2), who were referred to the Coagulation and Thrombosis Laboratory at the Iranian Blood Transfusion Organization, Tehran, Iran. Also, ten healthy individuals were considered as the control group. Among the patients, 2, 4, and 1 were identified with antithrombin, protein C, and protein S deficiencies, respectively. other patients had evidence of thrombosis without confirmed anticoagulant deficiency. In addition, patients with evidence of malignancy, leukemia (such as polycythemia vera and chronic myelogenous leukemia), various infections, and recurrent miscarriage with lupus anticoagulant were excluded. The demographic data of the study population are described in Figure 1 and Table 1. This study was approved by the Ethics Committee of Tehran University of Medical Sciences (IR.TUMS.SPH.REC.1401.156), and written informed consent was obtained from all participants. Three milliliters of venous blood were collected in citrate tubes from all patients and transported directly to the research laboratory.
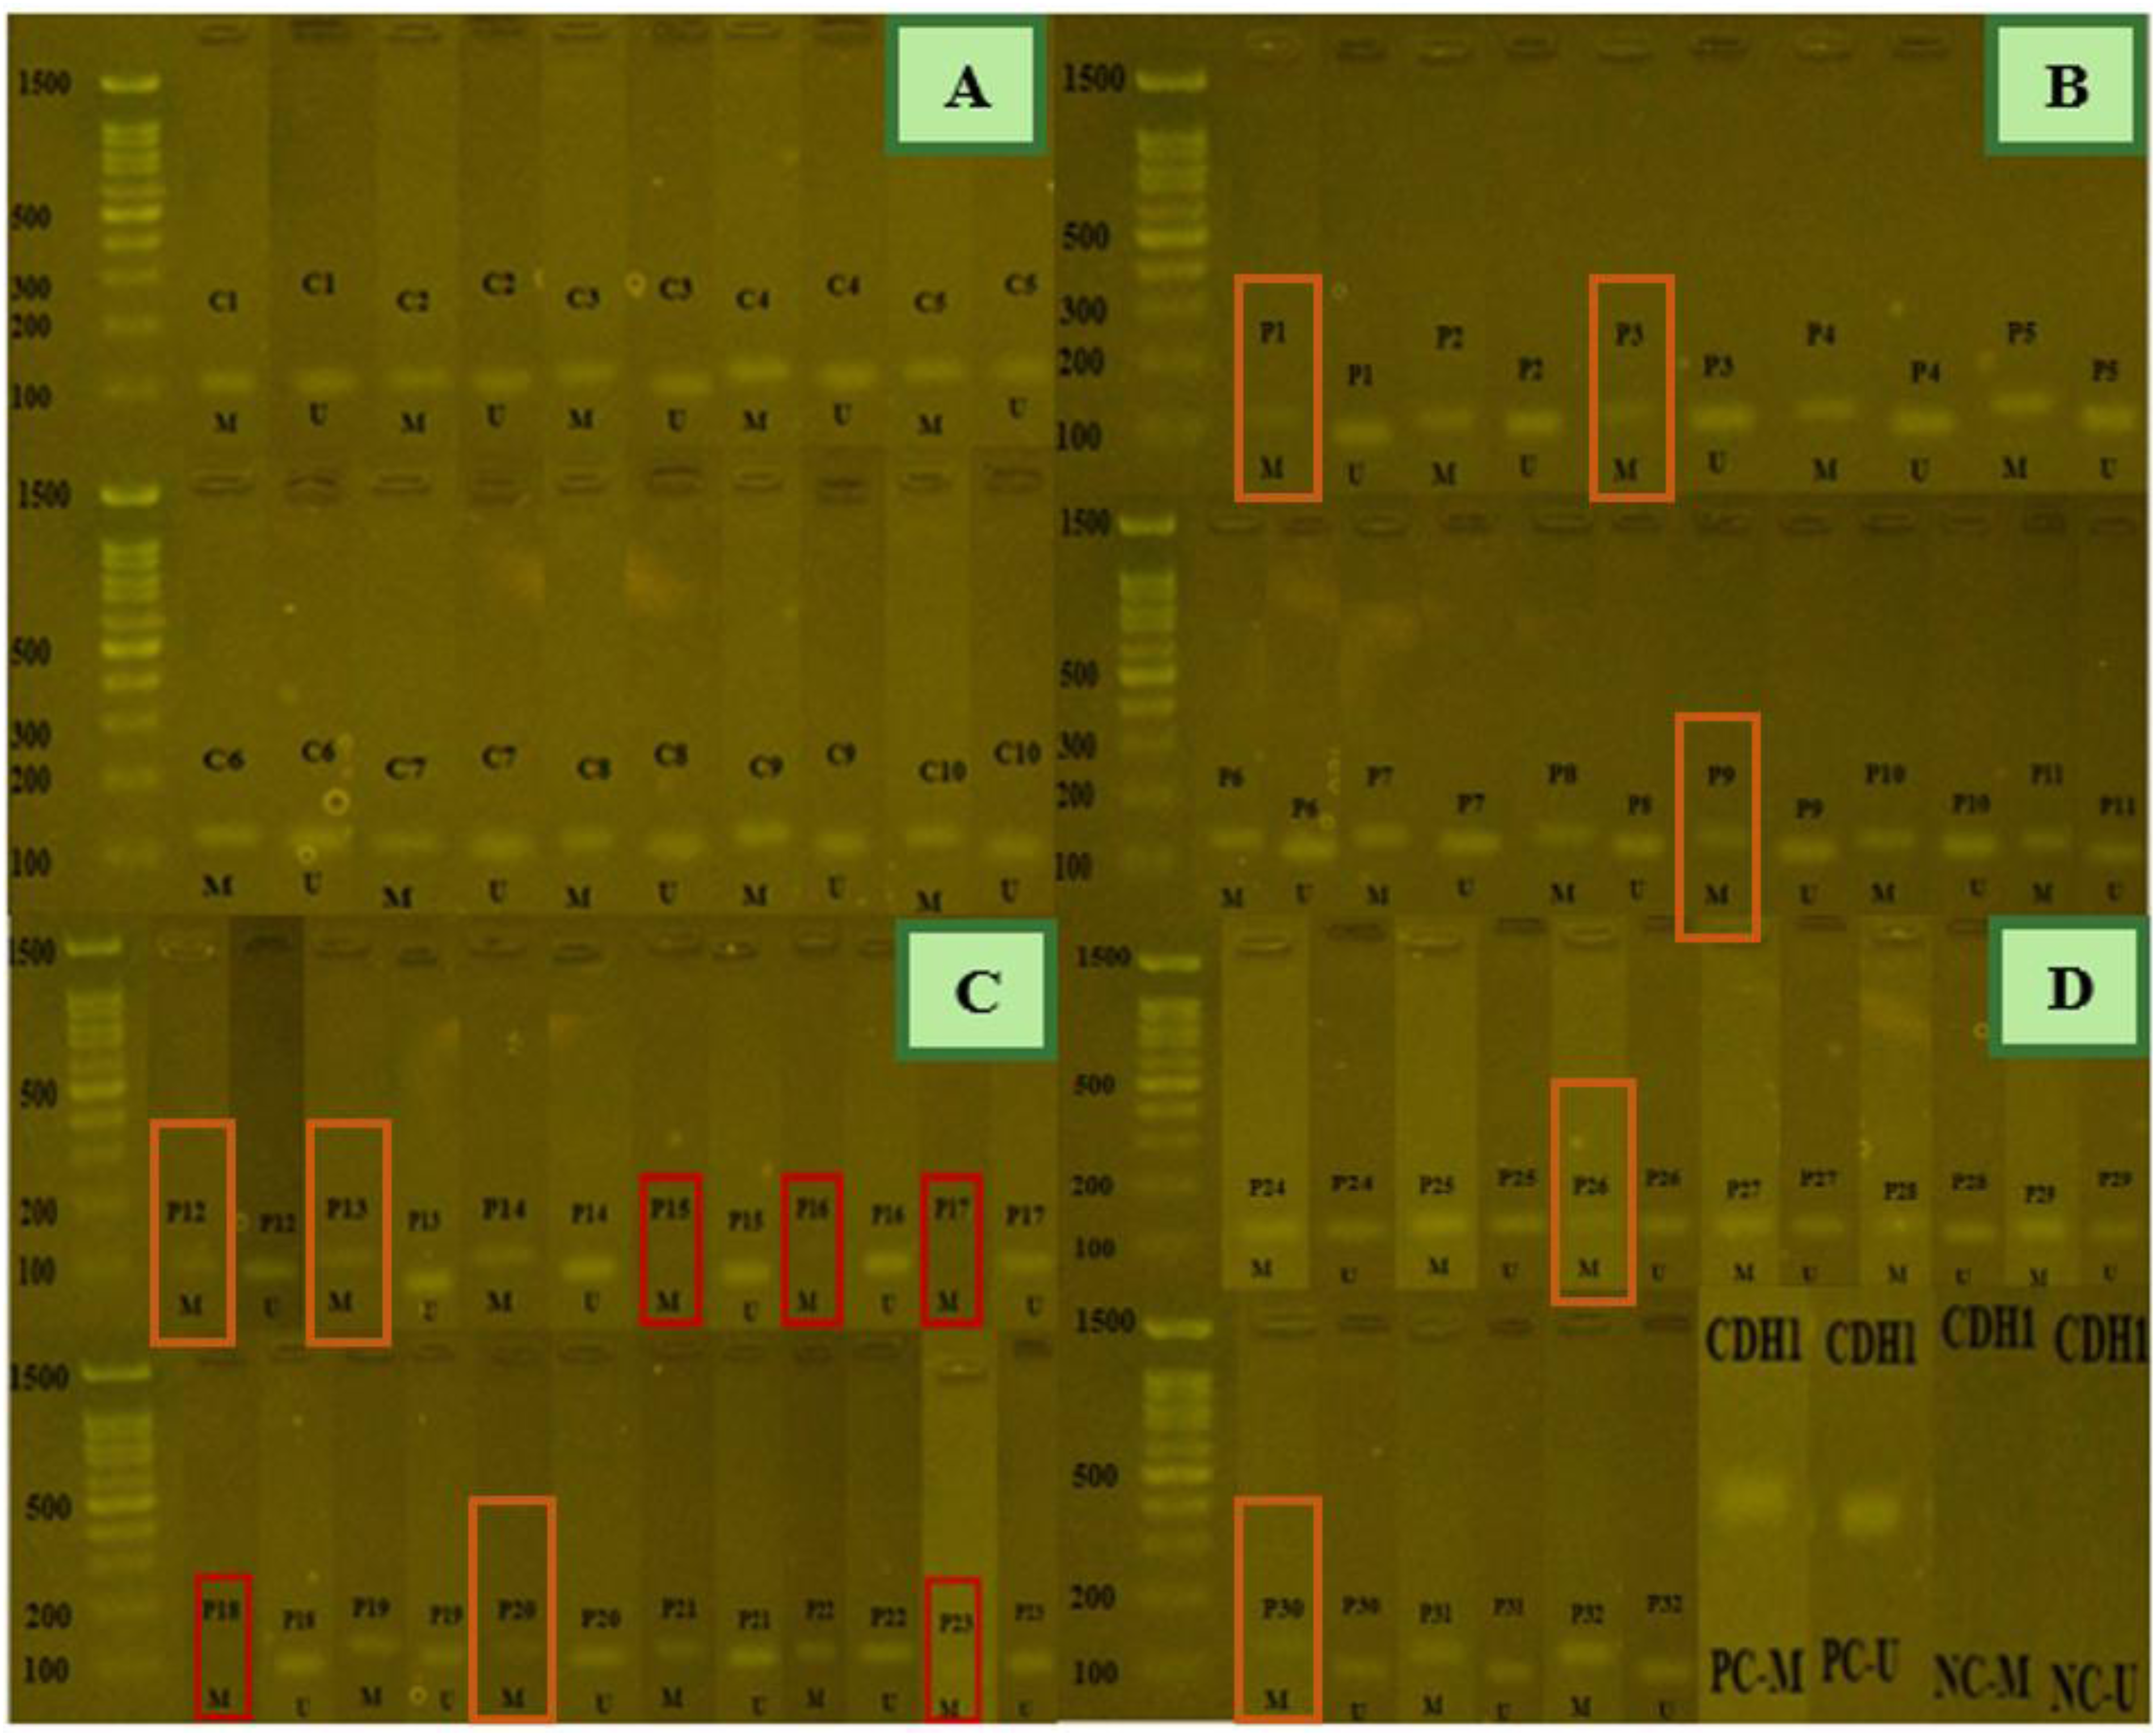
The methylation status of CDH1 gene on a 2% agarose gel. Figure 4A) shows MSP products from normal samples, which exhibited partial methylation. Figure 4B to D) show MSP products from patient samples. Five samples (P15, P16, P17, P18, and P23) indicated only unmethylated products, while other samples (P1, P3, P9, P12, P13, P20, P26 and P30) showed hypomethylation compared to the control group. D) positive and negative controls for meth and unmeth primers. C: control sample, P: patient sample, M: methylated PCR product, U: unmethylated PCR product, PC: positive control, NC: negative control. methylated PCR product size: 115 bp, unmethylated PCR product size: 97 bp.
Demographic Data of the Study Population.
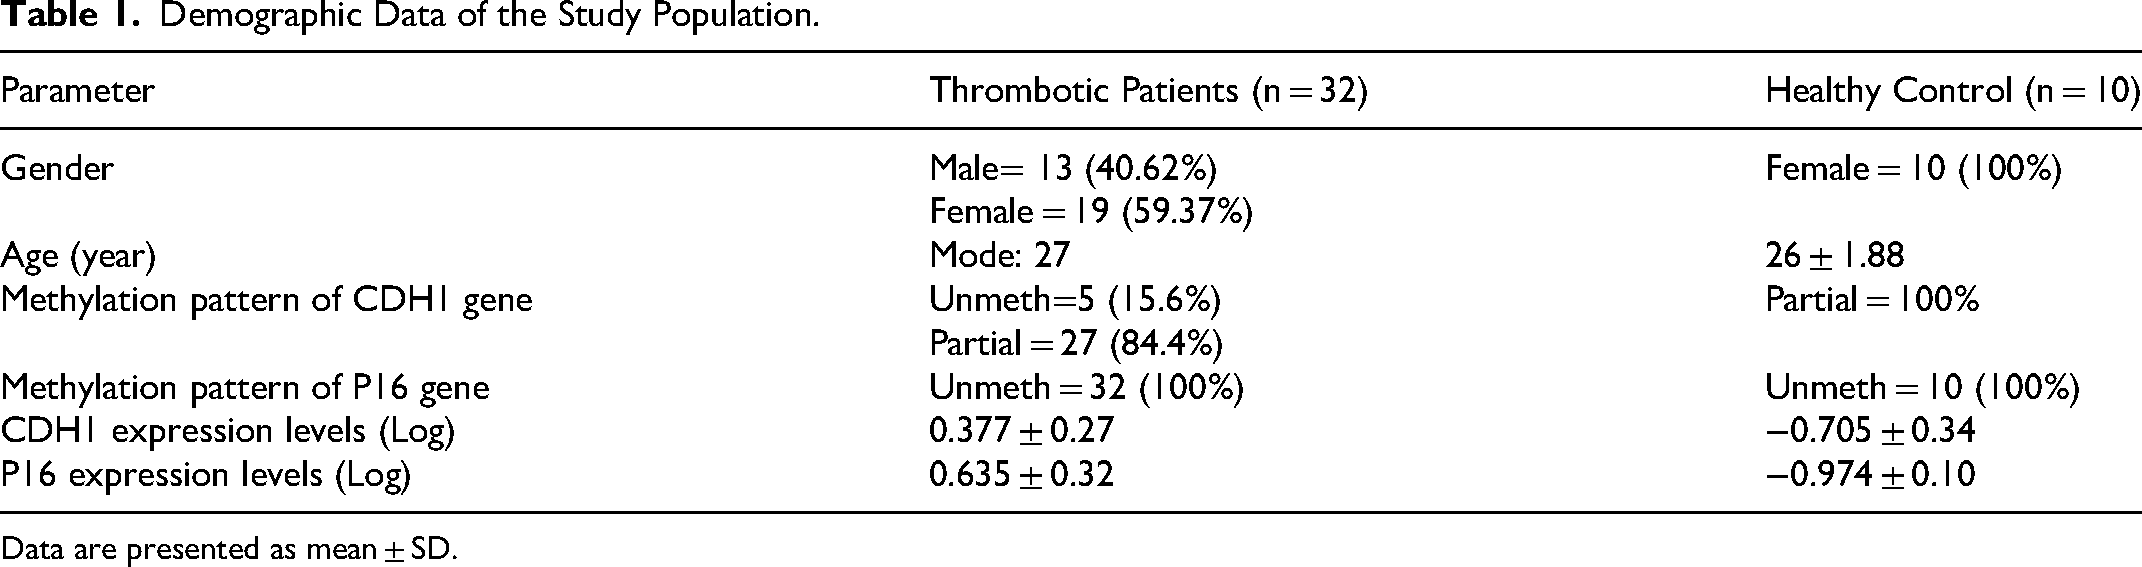
Data are presented as mean ± SD.
DNA Extraction and Bisulfite Treatment
The DNA was extracted using the salting out method. The yield and purity of the DNA were measured using a NanoDrop spectrophotometer at 260/280 and 260/230 nm (Thermo Fisher Scientific, USA). The quality of the DNA was also evaluated by agarose gel electrophoresis. Then, the DNA was treated with sodium bisulfite to convert unmethylated cytosine to uracil, using the EpiJet bisulfite conversion kit (Thermo Fisher Scientific, USA) following the manufacturer's protocol.
Methylation-Specific Polymerase Chain Reaction
The bisulfite-treated DNA was used for methylation-specific polymerase chain reaction (MSP) to evaluate the methylation pattern of the CDH1 and P16 genes. The methylated and unmethylated primers were designed using MethPrimer software (https://www.urogene.org/methprimer). To confirm the specificity of the primers, the Bisearch tool was applied (http://bisearch.enzim.hu/). The primer sequences are provided in Table 2.
MSP Primer Sequences.
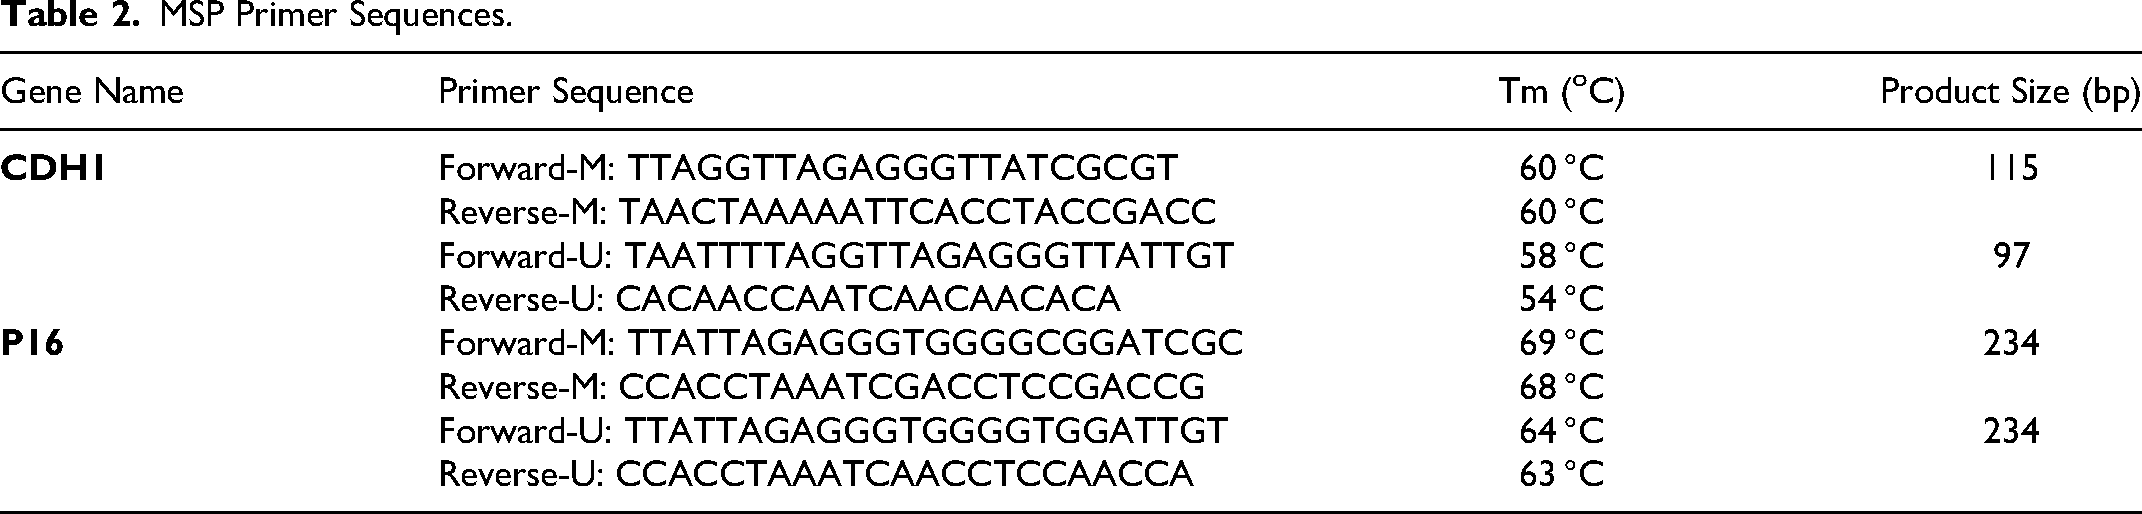
The MSP reaction was performed in a final volume of 30 µL, using 15 µL of Hot Start 2x Master Mix BLUE (Ampliqon, Denmark), 2 µL of bisulfite-treated DNA, 1 µl of forward methylated/unmethylated primers, 1 µL of reverse methylated/unmethylated primers, and 11 µL of nuclease-free water. The thermal cycling of MSP was performed using a PEQLAB thermocycler (PEQSTAR, Germany) as follows: 15 min at 95 °C for pre-denaturation, followed by 35 cycles of 30s at 95 °C for denaturation, 30s at the annealing temperature of the primers for annealing, 1 min at 72 °C for extension, and 10 min at 72 °C for a final extension. The MSP products were then electrophoresed in a 2% agarose gel stained with DNA safe stain (SinaClon, Iran).
Sanger Sequencing of MSP Products
To confirm accurate conversion of DNA sequences, normal and patient PCR products were analyzed using the Sanger sequencing method. Methylated cytosine in CpG islands remains intact after treatment, while unmethylated cytosine is converted to uracil, subsequently changing to thymine during PCR cycles. MSP products were prepared and transferred to Pishgam Biotech Company (Tehran, Iran) for Sanger sequencing analysis.
RNA Extraction and cDNA Synthesis
Total RNA extraction was performed using RNX-Plus reagent (Sinaclon, Tehran, Iran) according to the manufacturer's protocol. The yield and purity of RNA were evaluated using a NanoDrop spectrophotometer at 260/280 and 260/230 nm (Thermo Fisher Scientific, USA). Subsequently, the reverse transcription of extracted RNA samples was conducted using a cDNA synthesis kit (Sinaclon, Tehran, Iran), following the manufacturer's protocol.
Real-Time PCR
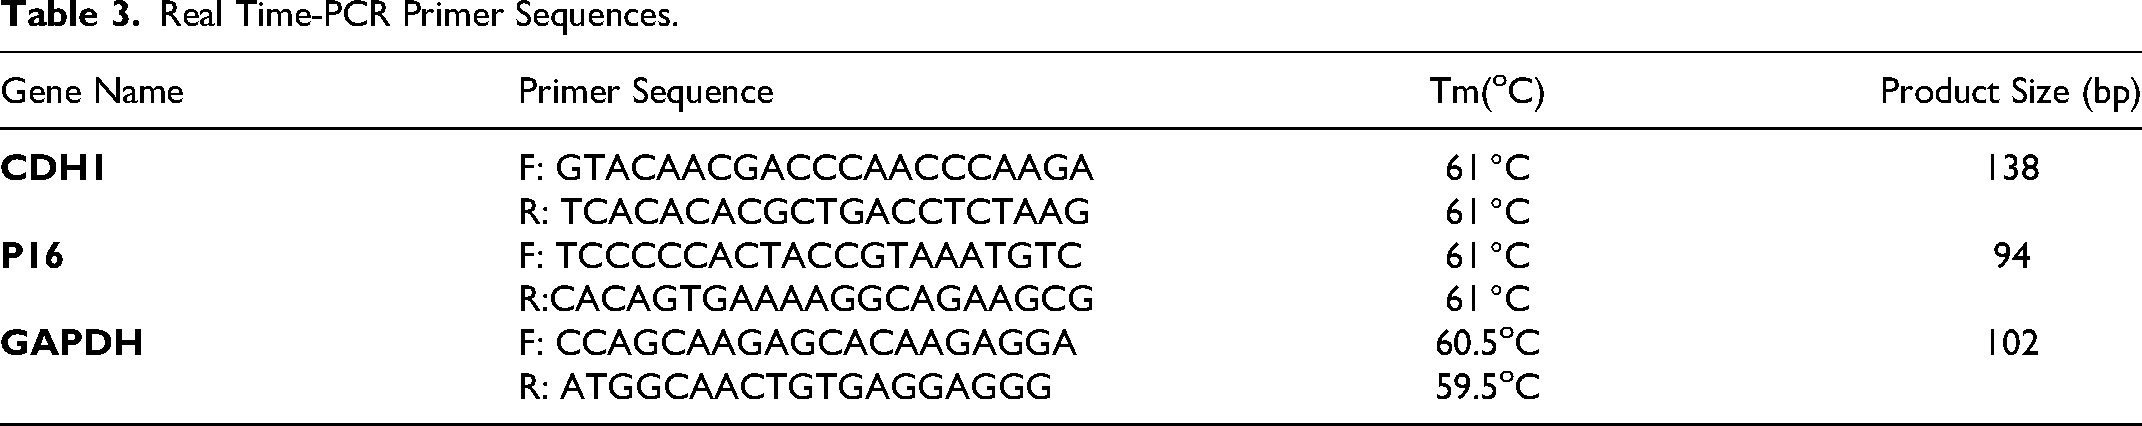
E-cadherin and P16 expression levels were investigated using Real-Time PCR with the Roche Light Cycler® 96 (Roche, Germany). For this purpose, 8 µl of RealQ Plus 2x Master Mix Green (Ampliqon, Denmark), 1 µL of each forward and reverse primers, 2 µL of the cDNA template, and 12 µL of nuclease-free water were prepared and spun down. The primers for RT-PCR were designed using the NCBI database (https://www.ncbi.nlm.nih.gov/) and analyzed with the OligoAnalyzer software. GAPDH was considered as the internal control gene. The sequences of the primers are indicated in Table 3. The Real-Time PCR thermal program was initiated with a pre-denaturation step for 30s at 95 °C, followed by 40 cycles of 20s at 95 °C for denaturation, 30s at the annealing temperature of each primer pair for annealing, and 30s at 72 °C for extension. The melting curve program included: 95 °C for 15s, 60 °C for 60s, and 95 °C for 60s. Due to a difference in efficiency of more than 5% between the internal control and target genes, the fold change was calculated using the Pfaffl method.
Real Time-PCR Primer Sequences.
Statistical Analysis
Statistical analysis was conducted using SPSS for Windows (IBM, USA). DNA methylation pattern evaluations between the two groups were analyzed using the chi-square test. Comparisons of gene expression levels between the control and patient groups were performed using an independent samples t-test. P-values < 0.05 were considered statistically significant. All charts were designed using GraphPad Prism software.
Results
The Methylation status of CDH1 and P16 Genes Promoter
DNA methylation patterns in the promoter regions of the CDH1 and P16 genes were measured using MSP and analyzed by 2% agarose gel electrophoresis Table 4. All healthy individuals and 84.4% of patient samples were hemi-methylated in the CDH1 gene promoter. However, 29.6% of patients with a hemi-methylation pattern exhibited hypomethylation compared to the control group. 15.6% of patients revealed an unmethylated pattern in the promoter of the CDH1 gene, and there was no significant difference in the DNA methylation pattern of CDH1 between the control and patient groups (P = 0.183, Figures 2 and 3). All control subjects and patients were unmethylated in the CpG islands of the P16 gene promoter, and no difference was observed between the two groups (Figure 4).
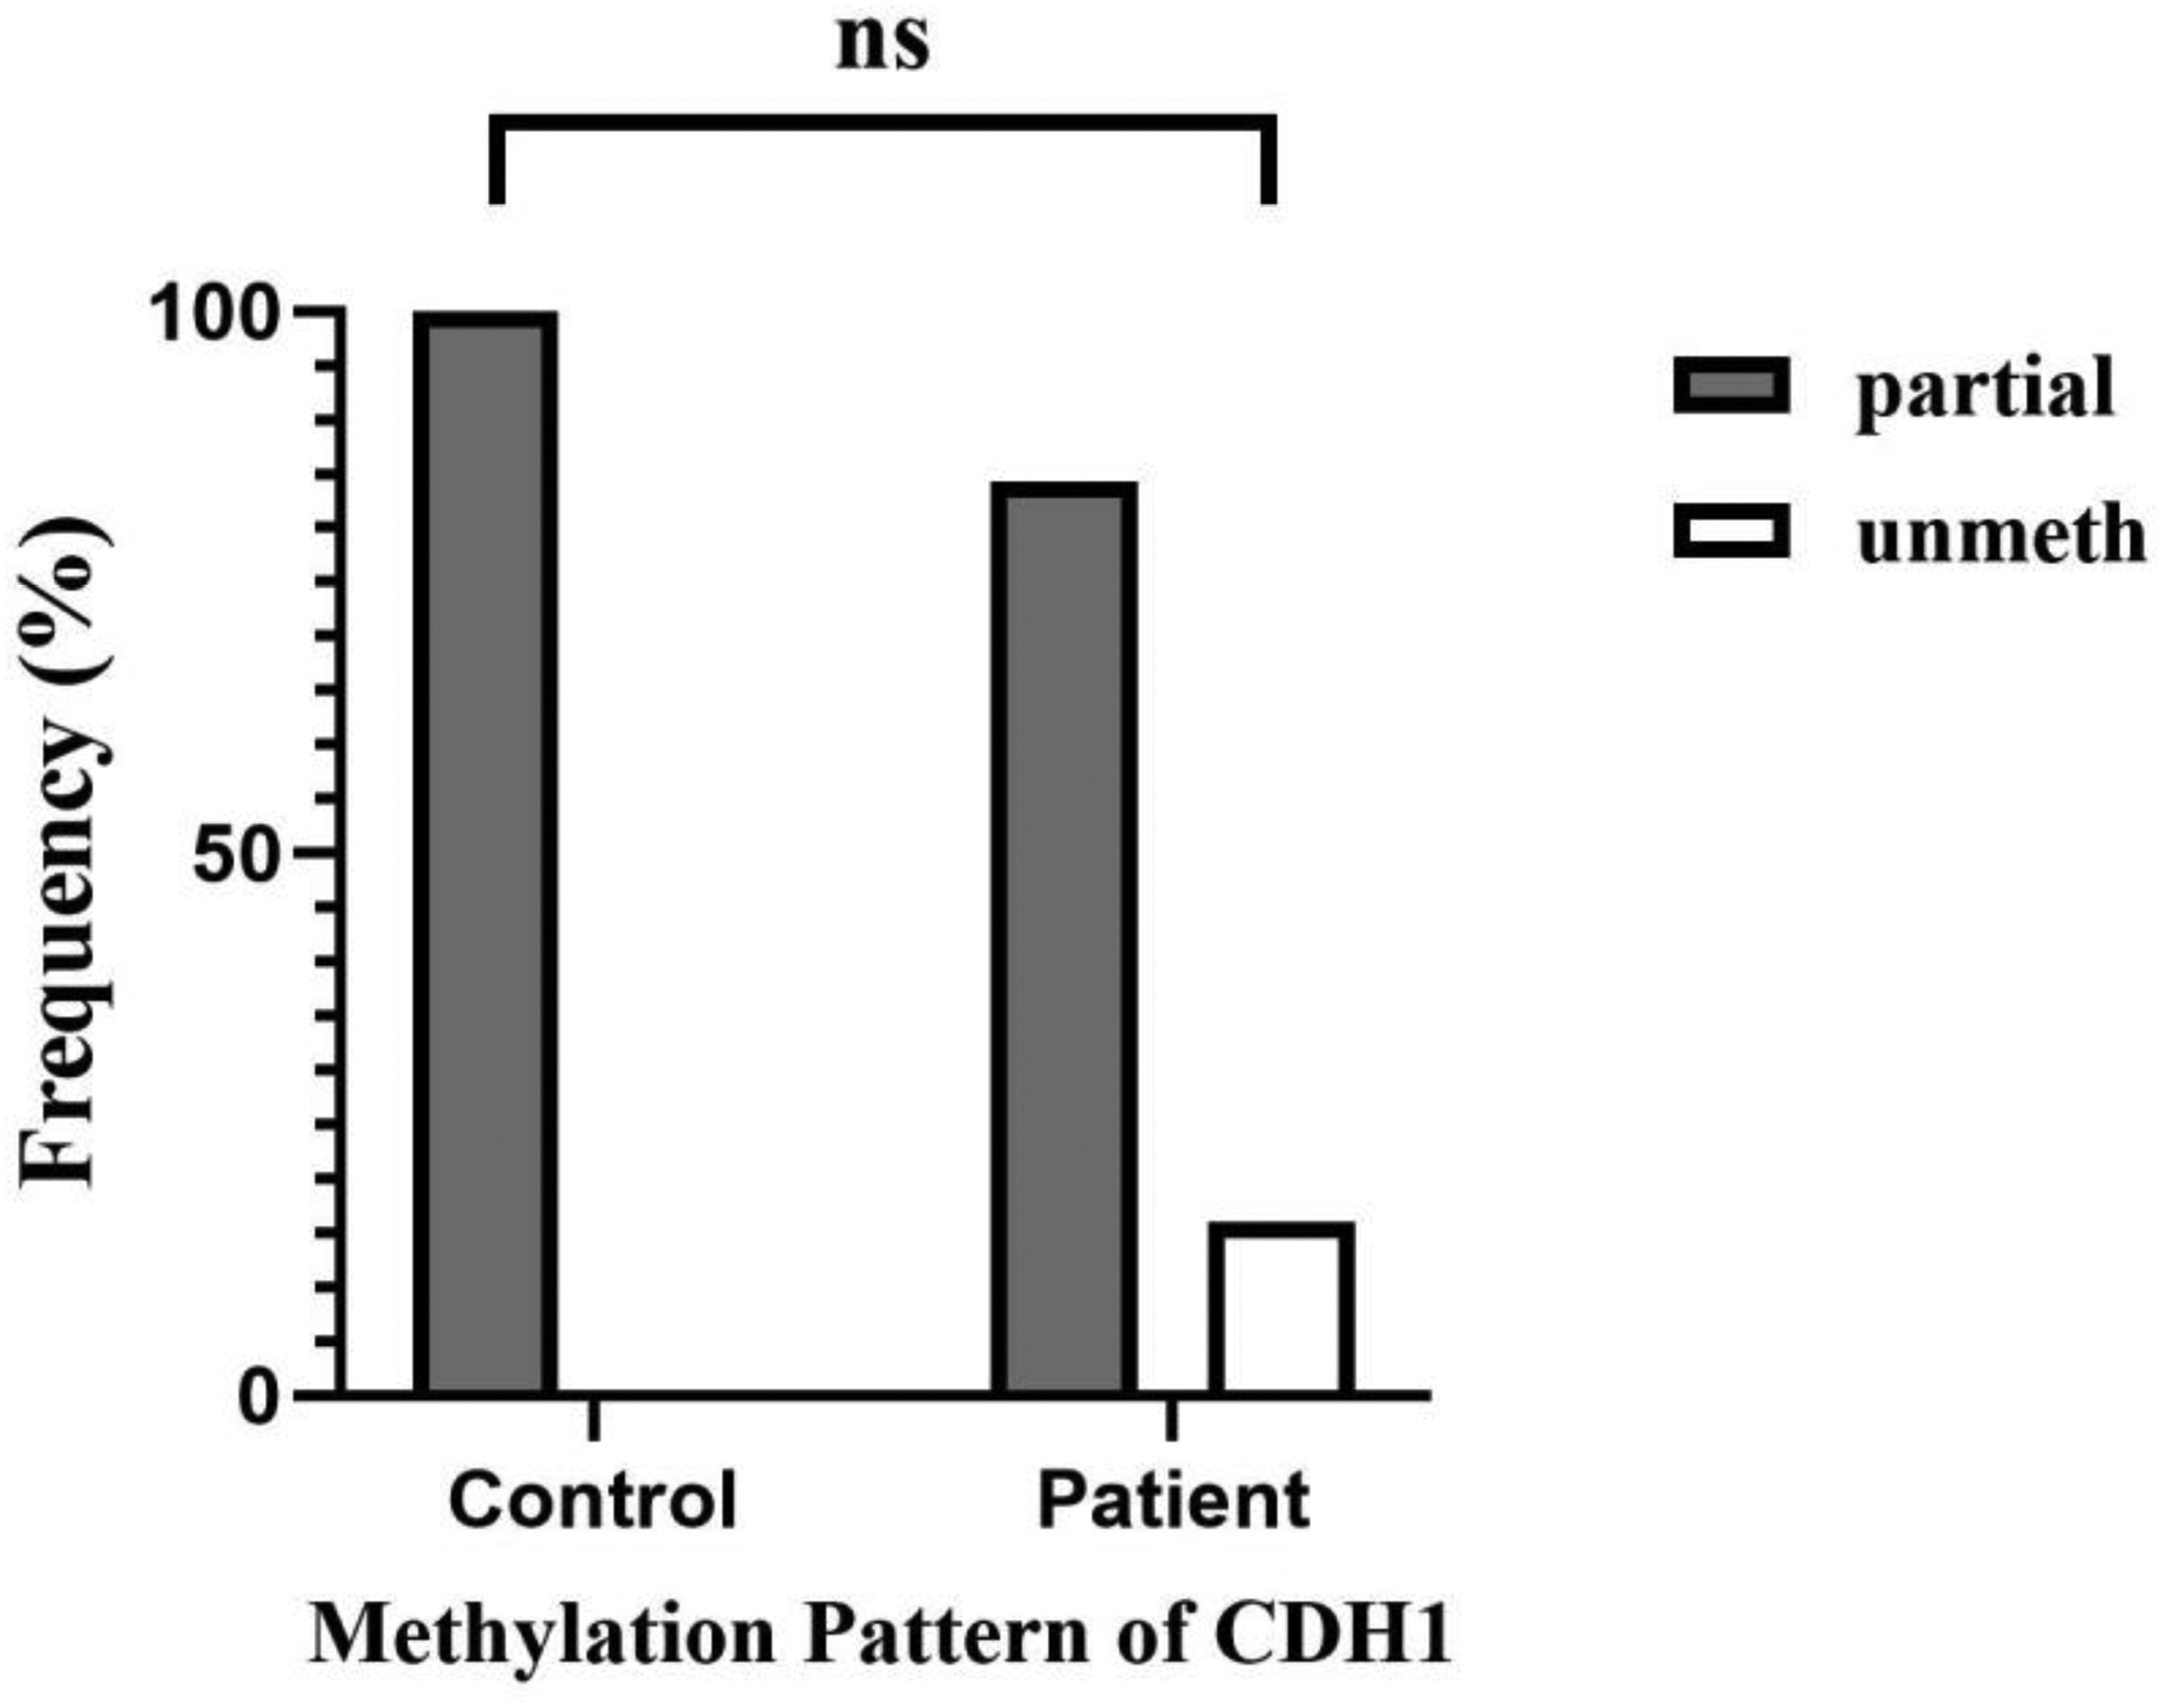
The frequency of DNA methylation patterns in the CDH1 gene promoter. 100% of control samples were partially methylated. Among patients, 84.4% of samples were partially methylated and 15.6% were unmethylated. The difference between the two groups was no significant (P = 0.183). ns: not significant.
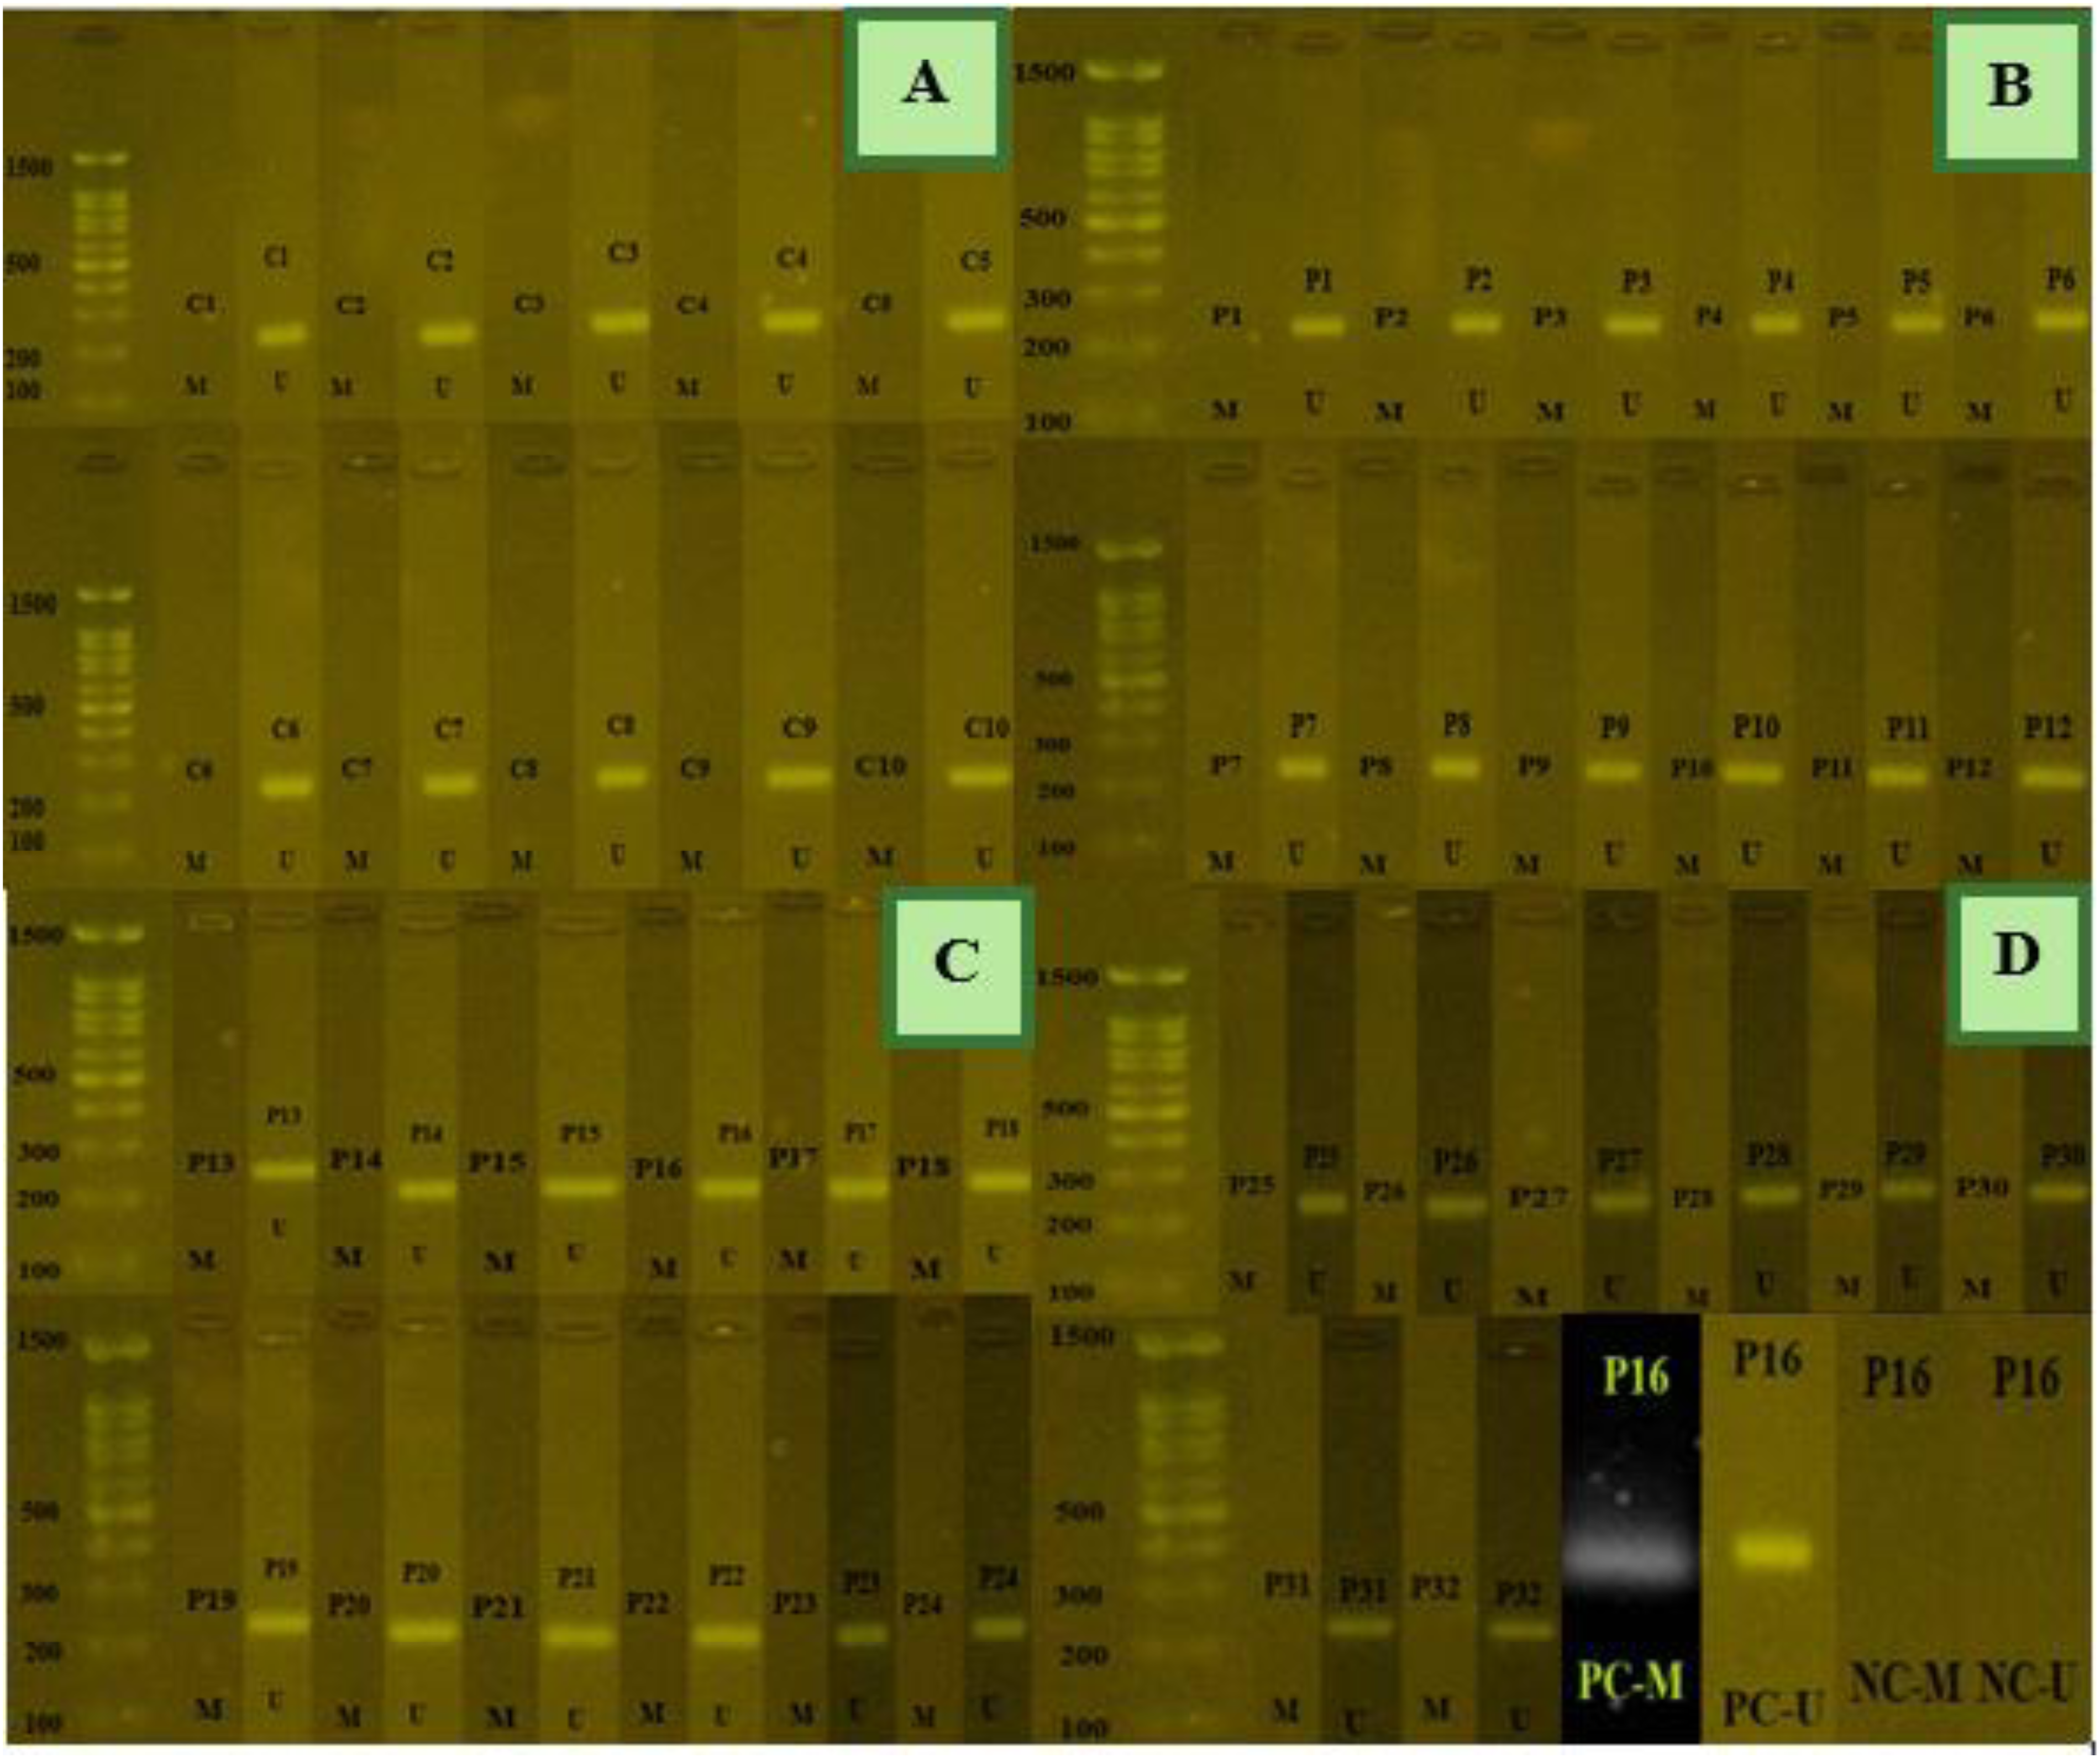
The DNA methylation status of the P16 gene on a 2% agarose gel.) MSP products from normal samples demonstrated an unmethylated pattern. Figure 4B to D) also show PCR products with unmethylated primer pairs across all patient sample. D) positive and negative controls for meth and unmeth primers. 29 C: control sample, P: patient sample, M: methylated PCR product, U: unmethylated PCR product, PC: positive control, NC: negative control. methylated and unmethylated PCR product sizes: 234 bp.
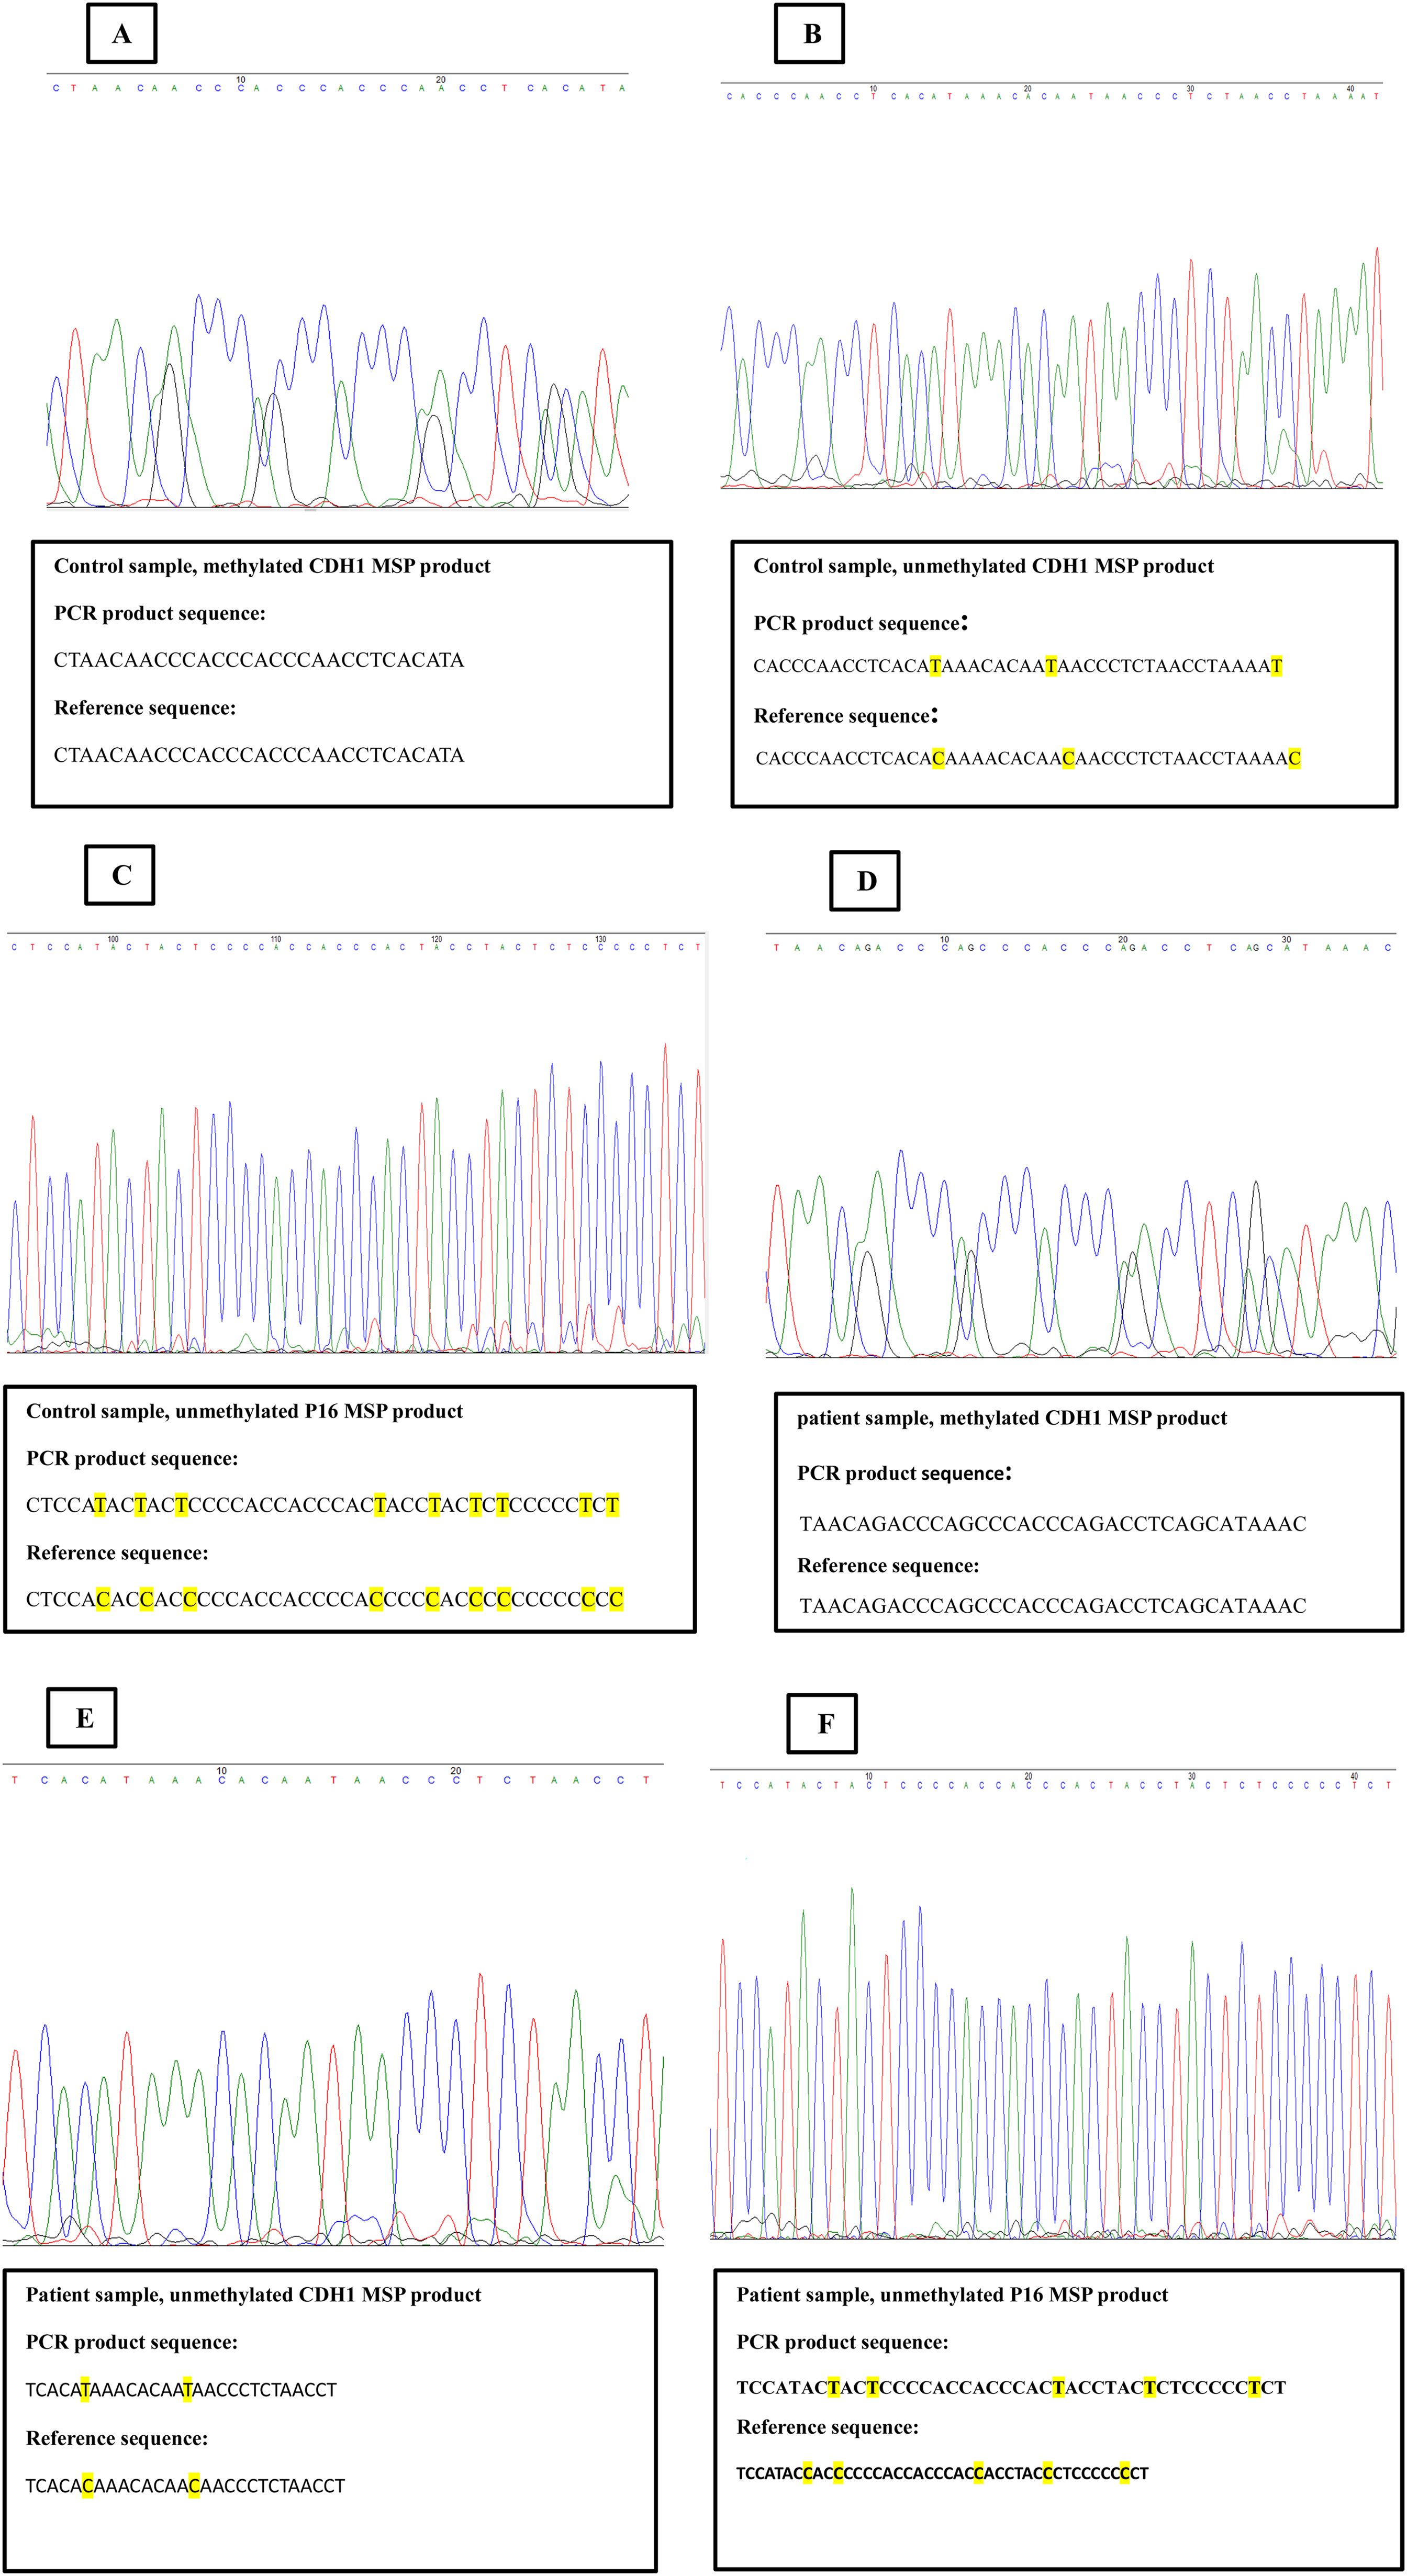
Sequencing results. A) the sequence of methylated CDH1 MSP product in control sample. No conversion was observed in methylated MSP product. B) the sequence of unmethylated CDH1 MSP product in control sample. The Replacement of unmethylated cytosine with thymine was identified C) the sequence of unmethylated P16 MSP product in control sample. The conversion of unmethylated cytosine to thymine was detected. D) the sequence of methylated CDH1 MSP product in patient sample. E) the sequence of unmethylated CDH1 MSP product in patient sample. F) the sequence of unmethylated P16 MSP product in patient sample. Similar results to control group were observed in patient group.
Statistical analysis of DNA methylation pattern and expression level of CDH1 and P16 genes.
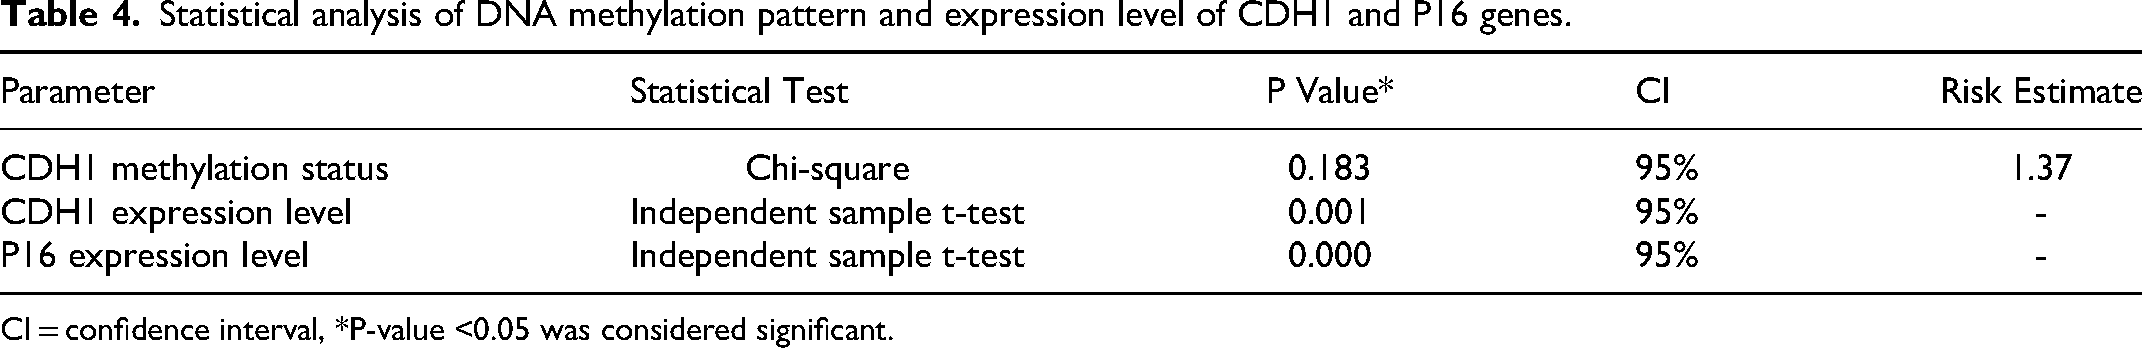
CI = confidence interval, *P-value <0.05 was considered significant.
Sequencing Results
Six PCR products, comprising three control and three patient samples, were sequenced using methylated or unmethylated primers via the Sanger sequencing method. Methylated PCR products showed no changes; however, the conversion of cytosine to thymine was observed in unmethylated PCR products. These results confirm the DNA methylation status of the CDH1 and P16 genes (Figure 5).
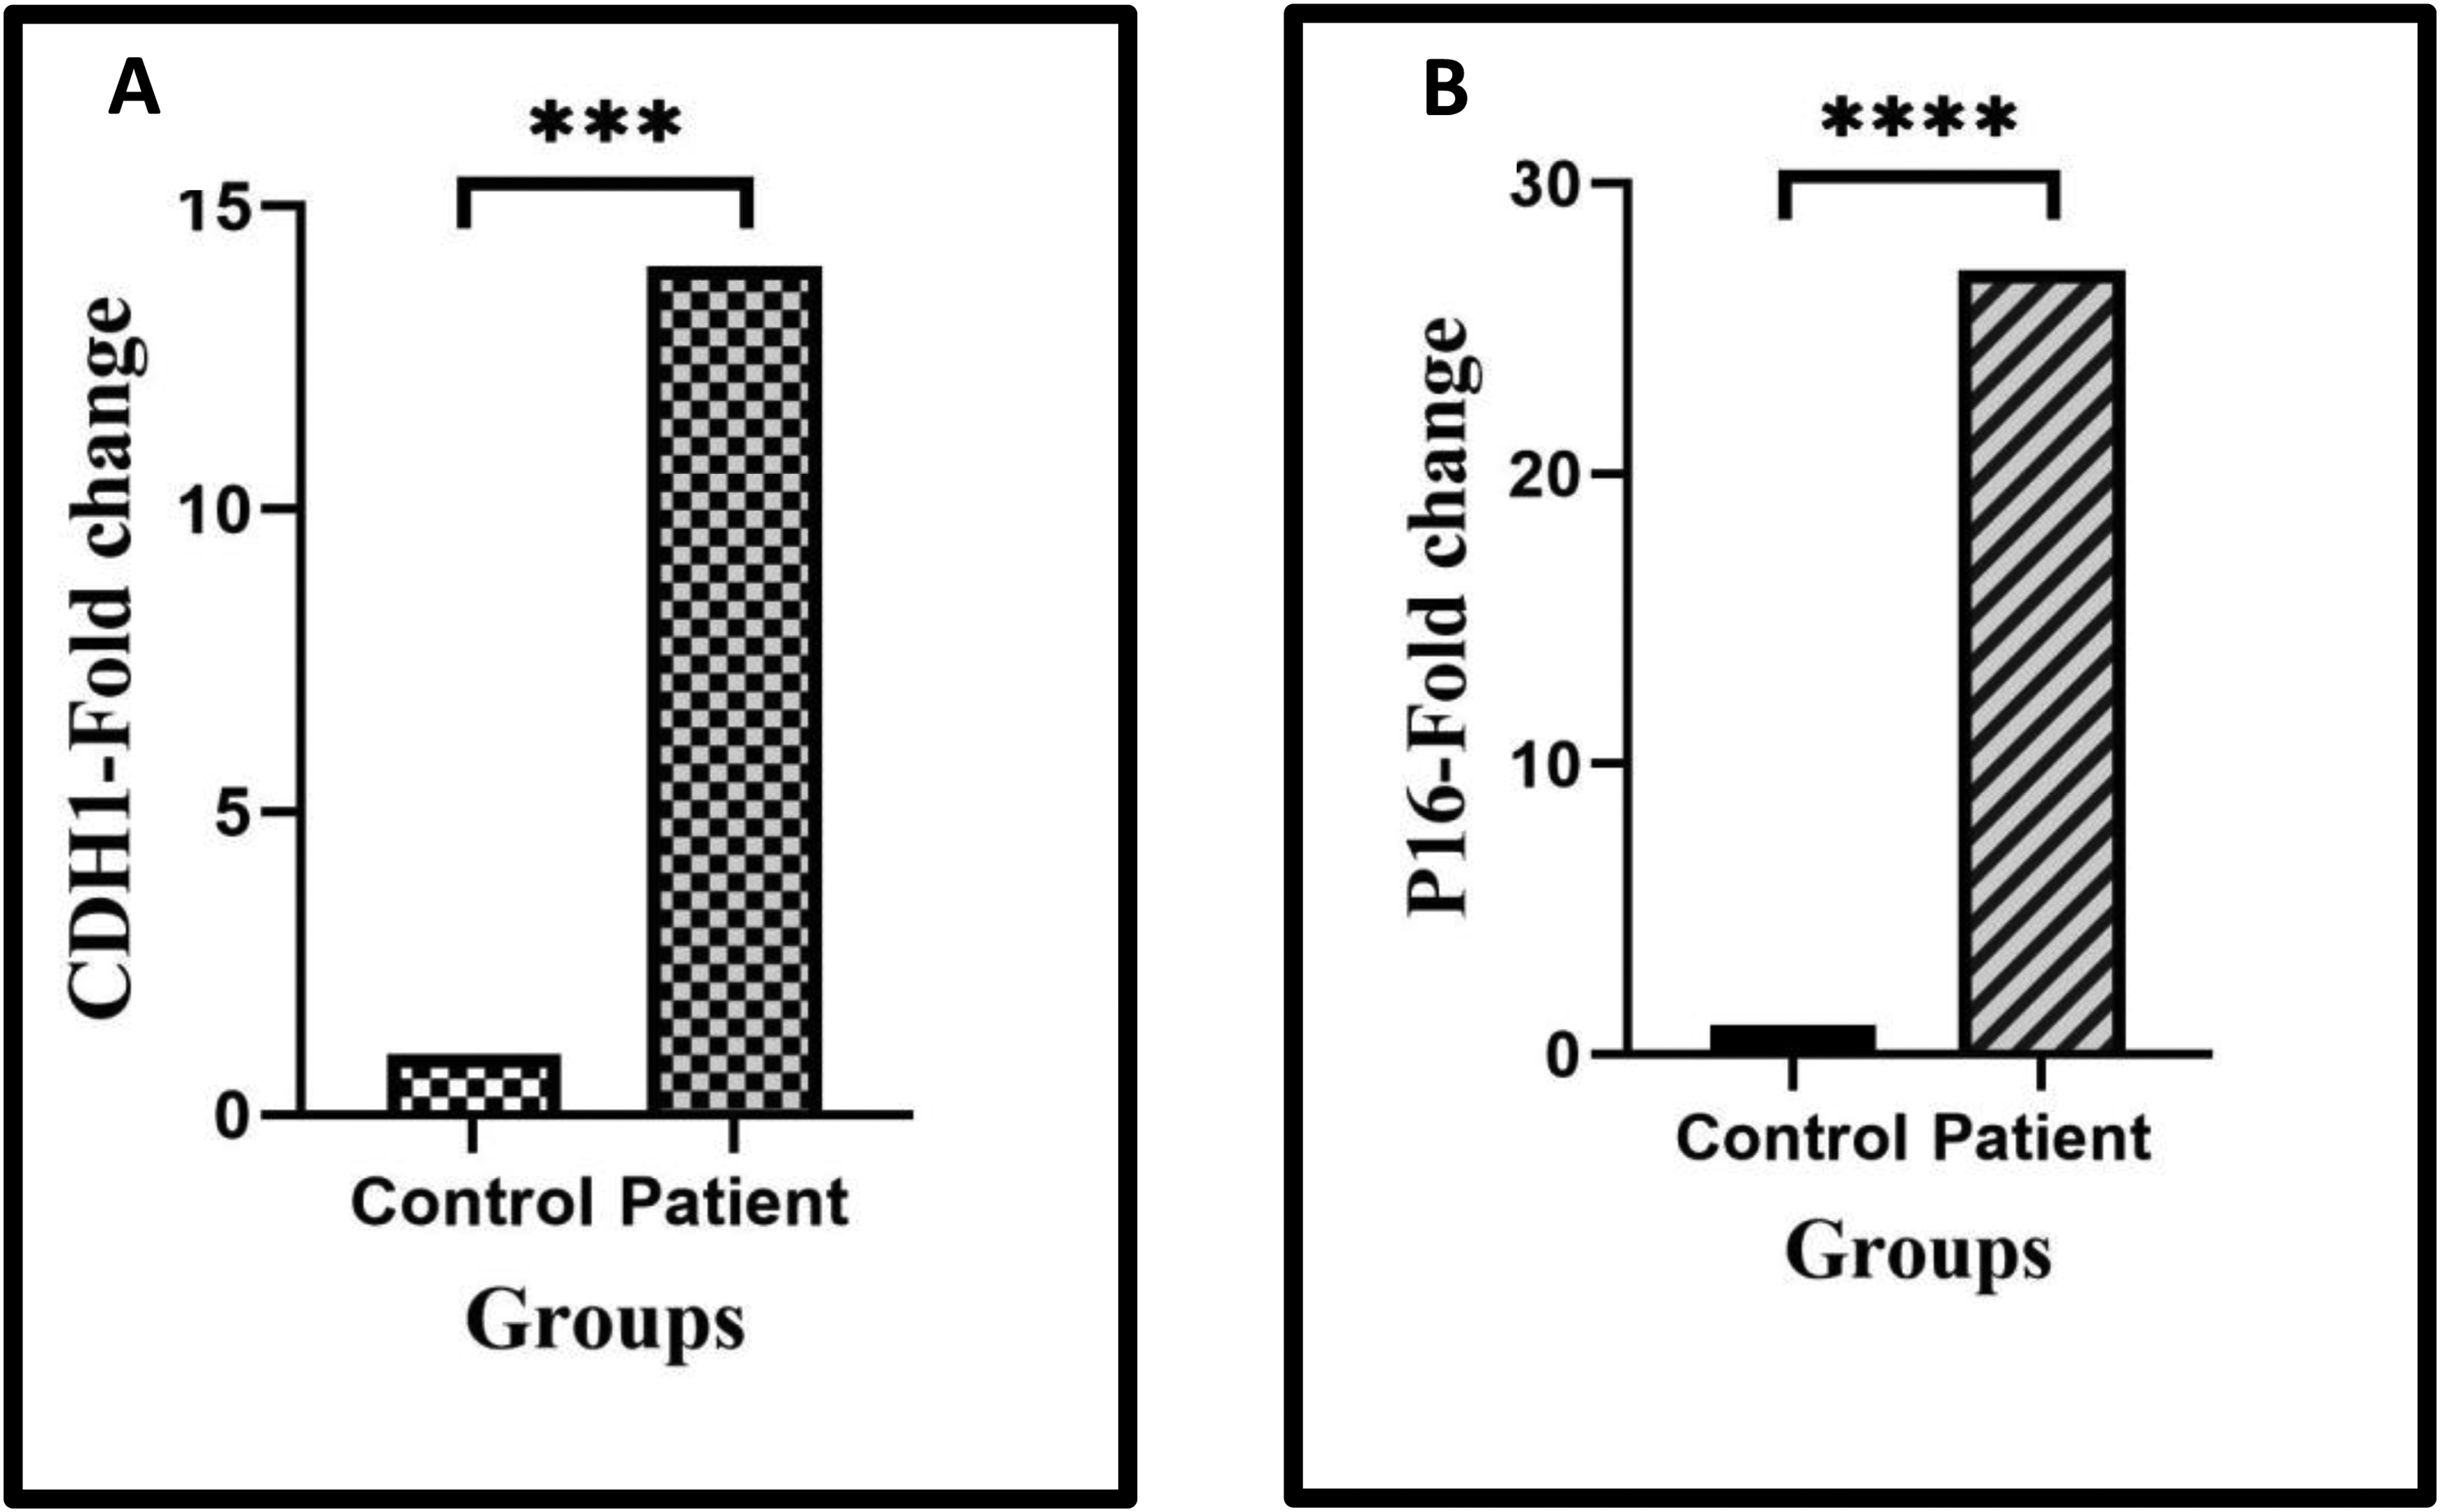
The fold change of CDH1 and P16 genes in controls and thrombotic patients. A) The expression level of the CDH1 gene has increased 14-fold in the patient group compared to the control group (P = 0.001). B) The expression level of the P16 gene has increased 27-fold in patients compared controls (P = 0.000).
Expression Levels of CDH1 and P16 Genes
Real-Time PCR was implemented to identify the expression levels of the CDH1 and P16 genes. CDH1 gene expression in the patient group was significantly increased compared to the control group (14-fold, P = 0.001, ). Additionally, significantly higher transcription levels of the P16 gene were observed in patients compared to normal individuals (27-fold, P = 0.000, ). There was no significant association between the methylation status of the CDH1 gene promoter and the expression level of CDH1 (P = 0.512).
Discussion
Epigenetic mechanisms are involved in the proliferation and differentiation of normal cells, as well as in disease development by modulating gene transcription. 9 Most investigations into epigenetic processes focus on embryonic development, cancer progression, cardiovascular, immunological, neurological, metabolic diseases, and imprinting.30,31 In various studies, researchers have evaluated the epigenetic effects on atherosclerosis, angiogenesis, and ischemic injuries. Epigenetic alterations control critical elements of thrombosis, including coagulation, anticoagulation, fibrinolysis, and cell adhesion. Epigenetic modulators affect the entire extrinsic pathway in secondary hemostasis. Additionally, epigenetic factors regulate FXII and FVIII from the intrinsic pathway. 6 Overall, the role of epigenetic mechanisms in the pathogenesis of thrombotic disorders is not well characterized and requires further evaluation. In the current study, we investigated the DNA methylation patterns of the E-cadherin and P16 genes involved in thrombotic disorders and their association with gene expression levels.
E-cadherin, encoded by the CDH1 gene, is a transmembrane glycoprotein that plays an important role in intercellular adhesion in epithelial tissues. The correlation between catenin proteins and E-cadherin leads to the connection of E-cadherin to the actin cytoskeleton, facilitating the transfer of mechanical signals inside and outside the cell. E-cadherin impacts homeostasis, tissue morphogenesis, and acts as a tumor suppressor gene. 32 –34 In this regard, various studies have focused on the hypermethylation of E-cadherin and its lower expression levels in the progression of numerous cancers. Lao TD et al demonstrated a significant association between the DNA methylation pattern of E-cadherin and the incidence of nasopharyngeal carcinoma. 11 Banerjee et al revealed hypermethylation of the E-cadherin, P15, and P16 genes in cervical carcinoma and suggested that the simultaneous evaluation of these three genes could be used as a screening tool for cervical cancer.12 FQ and colleagues. demonstrated aberrant DNA methylation and lower expression levels of E-cadherin in acute lymphoblastic leukemia (ALL), which were associated with poor prognosis. 15 However, the DNA methylation pattern of E-cadherin in thrombosis has not been evaluated in previous studies. Elrod et al demonstrated the presence of both pan-cadherin and E-cadherin in platelets using pan-cadherin staining. They indicated that the expression of cadherin and occludin in platelets may facilitate the connection between white blood cells (WBCs) and platelets to endothelial cells. 18 Scanlon et al investigated the effect of E-cadherin on the generation and function of platelets using a mouse model with E-cadherin knockout. They verified the existence of E-cadherin in megakaryocytes and platelets, demonstrating its hemostatic role in pathological conditions such as injuries or acute thrombocytopenia. Additionally, they reported that the absence of E-cadherin reduces signaling through the PI3 K/Akt/GSK3β pathway, attenuates αIIbβ3 avidity, and subsequently impairs fibrinogen binding, leading to abnormal platelet aggregation in response to thrombin. 19 Spachmann et al displayed that E-cadherin and β-catenin are involved in maintaining cell-cell attachment in renal cell carcinoma (RCC), primary lymph node metastasis, and venous thrombus formation in the vena cava. They found that high expression levels of E-cadherin and β-catenin are associated with poor overall survival (OS) and cancer-specific survival (CSS). 35 This information illustrates the crucial role of E-cadherin in clot formation and stabilization. Our results indicated an unmethylated pattern in five patients compared to control individuals, while the remaining patients, similar to healthy subjects, were hemi-methylated. Additionally, some patients with a partial methylation pattern exhibited a hypomethylation status compared to the control group (Figure 2). The observed unmethylated pattern in some patients may suggest that E-cadherin DNA methylation could influence DVT before the occurrence of PE or PE without evidence of DVT. Factors such as gender, age, and anticoagulant drugs likely do not contribute to the E-cadherin methylation status in thrombosis. Consistent with previous studies, our results showed significantly higher expression levels of E-cadherin in patients with thrombosis compared to normal individuals, suggesting an involvement of E-cadherin in thrombosis.
P16, a cyclin-dependent kinase inhibitor (CDKN2A), curbs the phosphorylation of retinoblastoma protein by suppressing cyclin-dependent kinase (CDK) activity, leading to cell cycle arrest.36,37 The inhibition of P16 reduces cellular senescence and the aging process. 38 Many studies have measured the hypermethylation of P16, as a tumor suppressor gene, in multitude malignancies. Bai et al displayed aberrant DNA methylation of P16 in liver cancer. 23 Allameh et al showed hypermethylation of P16 in patients with OSCC. 24 Saliminejad and colleagues. exhibited similar results in early stages of gastric cancer. 26 In contrast to the numerous studies on cancer, the epigenetic regulation of P16 in coagulation and thrombosis has not been investigated.
Motterle et al demonstrated a relationship between the 9p21 genotype and the transcription levels of CDKN2A and CDKN2B, as well as the extent of cell proliferation in primary cultures of vascular smooth muscle cells (VSMCs). They also identified an association between the 9p21 genotype and P15 expression in VSMCs from atherosclerotic plaques. 27 Kuo et al described the relationship between the 9p21 locus and various vascular phenotypes. They reported that lower expression levels of CDKN2A and higher proliferation rates of monocytes/macrophages were associated with the human 9p21 locus, and that this locus contributed to faster atherogenesis in susceptible congenic mice. 39 Wang et al represented higher platelet counts, enhanced platelet function, and increased TAT complex levels in hypercholesterolemic and CDKN2A-deficient mice. These findings indicated a prothrombotic condition and a heightened susceptibility to myocardial infarction (MI). 40 Shanker and colleagues. provided further evidence of the relationship between 9p21.3 genetic variants and CAD. They illustrated that this risk is regulated through the interaction between ANRIL and the adjacent cyclin-dependent kinases. 41 Conversely, Cardenas et al revealed that vascular injury in P16INK4a transgenic mice resulted in a pronounced prothrombotic state. They reported that P16INK4a transgenic mice exhibited shorter occlusion times, greater thrombus formation, delayed thrombolysis, and higher levels of PAI-1 compared to wild-type mice. 28 Thus, lower levels of P16 are associated with arterial thrombosis, while higher levels are linked to venous thrombosis.
In the present study, the DNA methylation pattern of the P16 gene promoter was unmethylated in both control and patient groups. These findings suggest that other regulatory mechanisms may be involved in modulating P16 gene expression in thrombosis. Wang et al presented the inhibitory effect of miR-29a on the P16 gene in cervical cancer. 42 Yang et al exhibited that circular RNA derived from the mesenchymal epithelial transition (MET) gene (CircMET) targets and degrades P16 mRNA, thereby increasing tumor cell proliferation in cervical cancer. They proposed miRNA-based therapies as a potential treatment for cervical carcinoma. 43 Danis et al evaluated the inhibitory role of the polycomb repressive complex 2 (PRC2), as a chromatin regulator, in the CDKN2A gene and its effect on the proliferation of leukemic cells with the mixed lineage leukemia gene (MLL)-AF9 fusion. They found that PRC2, through lysine 27 of histone H3 (H3K27) trimethylation, led to the inactivation of CDKN2A and increased proliferation of leukemic cells. 44 Further research is needed to elucidate the precise regulatory mechanisms governing P16 gene expression in thrombosis. Additionally, employing more sensitive methods to assess DNA methylation patterns could provide clearer insights into the methylation status of P16 in thrombotic disorders. Consistent with previous studies, our findings indicate significantly higher expression levels of the P16 gene in patients with thrombosis compared to normal subjects. These results suggest a potential role for P16 in contributing to a hypercoagulable state.
In regard to our finding, DNA methylation patterns in the promoter regions of the E-cadherin and P16 genes are not the primary regulatory mechanisms for gene expression in venous thromboembolism (VTE). However, the higher expression levels of both E-cadherin and P16 in patients with various types of thrombosis suggest that these genes play an effective role in the pathogenesis of VTE. So, targeting E-cadherin and P16 genes may offer potential for developing anti-thromboembolic therapies to improve treatment outcomes in thrombosis. However, our study is limited by the small sample size, the use of qualitative MSP methods, and the focus solely on venous thrombosis. Future research should address these limitations by including larger patient populations, investigating arterial thrombosis, comparing findings with venous thromboembolism, examining newly diagnosed cases and those prior to anticoagulant treatment, and employing more sensitive techniques for assessing DNA methylation status.
Conclusion
Taken together, our findings illustrate that DNA methylation has no significant regulatory effect on the gene expression of E-cadherin and P16 genes in VTE. However, elevated expression levels of these genes were observed in VTE patients. Further research is required to shed light on the gene expression regulatory mechanism of E-cadherin and P16 genes, their roles in VTE and to explore their potential therapeutic implications.
Footnotes
Acknowledgements
We appreciate the efforts of Ms. Dehghan for helping to collect the samples
Authors Contributions
N.A contributed to data collection and performing all experiments. Sh.A and M.A supervised the study and coordinated experiment. F.MA participated in sample collection. M.S contributed to RT-PCR test and data analysis. S.T cooperated in data collection. All authors contributed to this article and approved the final version of manuscript.
Declaration of Conflicting Interests
The authors declared no potential conflicts of interest with respect to the research, authorship, and/or publication of this article.
Funding
This project was supported by Tehran university of medical science under grant number: 40011264005.