
Abstract
Background
Intracranial haemorrhage (ICH) poses a significant threat to patients on Direct Oral Anticoagulants (DOACs), with existing risk scores inadequately predicting ICH risk in these patients. We aim to develop and validate a predictive model for ICH risk in DOAC-treated patients.
Methods
24,794 patients treated with a DOAC were identified in a province-wide electronic medical and health data platform in Tianjin, China. The cohort was randomly split into a 4:1 ratio for model development and validation. We utilized forward stepwise selection, Least Absolute Shrinkage and Selection Operator (LASSO), and eXtreme Gradient Boosting (XGBoost) to select predictors. Model performance was compared using the area under the curve (AUC) and net reclassification index (NRI). The optimal model was stratified and compared with the DOAC model.
Results
The median age is 68.0 years, and 50.4% of participants are male. The XGBoost model, incorporating six independent factors (history of hemorrhagic stroke, peripheral artery disease, venous thromboembolism, hypertension, age, low-density lipoprotein cholesterol levels), demonstrated superior performance in the development dateset. It showed moderate discrimination (AUC: 0.68, 95% CI: 0.64–0.73), outperforming existing DOAC scores (ΔAUC = 0.063, P = 0.003; NRI = 0.374, P < 0.001). Risk categories significantly stratified ICH risk (low risk: 0.26%, moderate risk: 0.74%, high risk: 5.51%). Finally, the model demonstrated consistent predictive performance in the internal validation.
Conclusion
In a real-world Chinese population using DOAC therapy, this study presents a reliable predictive model for ICH risk. The XGBoost model, integrating six key risk factors, offers a valuable tool for individualized risk assessment in the context of oral anticoagulation therapy.
Introduction
While oral anticoagulation (OAC) therapies have become the preferred and widely recommended strategy for preventing and treating thromboembolic events, major bleeding incidents, especially intracranial haemorrhage (ICH), still occur and pose a significant burden. These incidents affect patients, physicians, and healthcare systems globally, and are associated with a poor prognosis and few proven treatments. 1 Direct oral anticoagulants (DOACs) have now surpassed vitamin K antagonists (VKAs) as the preferred oral anticoagulant option for thromboembolism prevention in patients with nonvalvular atrial fibrillation (AF) and venous thromboembolism (VTE).2,3 Nevertheless, the risk of fatal outcomes following severe DOAC-related ICH remains significant. 4 While guidelines underscore that the estimated bleeding risk should not be used as a reason to withhold OAC, 2 there is a need to implement risk stratification tools for patients who are treated with a DOAC.
Existing bleeding scores for patients on OAC, such as HAS-BLED, ATRIA, and ORBIT, primarily concentrate on AF patients5,6 or largely precede the widespread adoption of DOACs. 7 Moreover, these scores primarily predict the outcome of major bleeding events, which are based on a limited number of ICH events. 8 The recently developed DOAC Score, based on the RE-LY trial (Randomized Evaluation of Long-Term Anticoagulation Therapy), demonstrates statistically superior predictive capability for major bleeding compared to HAS-BLED, 9 but its ability to predict ICH remains unknown.
Previous studies have extensively compared and analyzed various methodologies for constructing risk prediction models, particularly in the context of disease forecasting.10–12 These methods range from traditional statistical approaches, such as forward and backward selection, and Least Absolute Shrinkage and Selection Operator (LASSO), to advanced machine learning techniques like eXtreme Gradient Boosting (XGBoost) and Random Forest. Comparative studies have delved into the predictive performances of these methods when applied to disease outcomes, offering valuable insights into their efficacy.13,14 However, the performance of these diverse methods in accurately predicting ICH remains uncertain.
In this study, we leverage electronic health records (EHRs) to construct ICH risk prediction models for patients on a DOAC, employing both traditional statistical methods and machine learning techniques. By comparing and analyzing the effectiveness of various methodologies in predicting ICH risk, our objective is to identify the optimal model for risk stratification. It is crucial to emphasize that while these predictive models are valuable tools for discussing risk-benefit balances, they should not be used as indications to discontinue anticoagulation. The use of these models could guide clinical decision-making, supporting but not replacing the careful clinical management required for anticoagulation therapy.
Methods
Data Source and Population
This analysis was based on the Tianjin Health and Medical Data Platform (THMDP), an EHR-based healthcare data platform. Detailed information is described in the Supplemental material. We assembled a cohort of patients newly initiated on DOACs based on the THMDP database. We first included all patients prescribed with a DOAC (including dabigatran, rivaroxaban, apixaban) between January 2015 and June 2020. The date of first prescription of an OAC during the study period was defined as the index date, and the information from 1 year prior to the index date was included to obtain baseline characteristics of the patients. For demographic information with multiple data points, the most recent data were used. For multiple lab results recorded on the same day, the mean of these values was calculated to establish the baseline. Considering that more comprehensive data are typically available for hospitalized patients, we then excluded patients who only had outpatient OAC prescriptions and patients who had filled an OAC prescription within the 12 months prior to the index date, resulting in a cohort consisting only of new OAC users during hospitalization. Other exclusion criteria included: patients aged <18 years old, patients with missing values for body weight or low-density lipoprotein cholesterol (LDL-C), patients who were prescribed OACs only for preventing VTE complications due to trauma or orthopedic surgery, and those who used warfarin as the baseline OAC prescription. Then, the cohort was randomly split into a 4:1 ratio into separate datasets for model development and validation. The inclusion and exclusion criteria are shown in
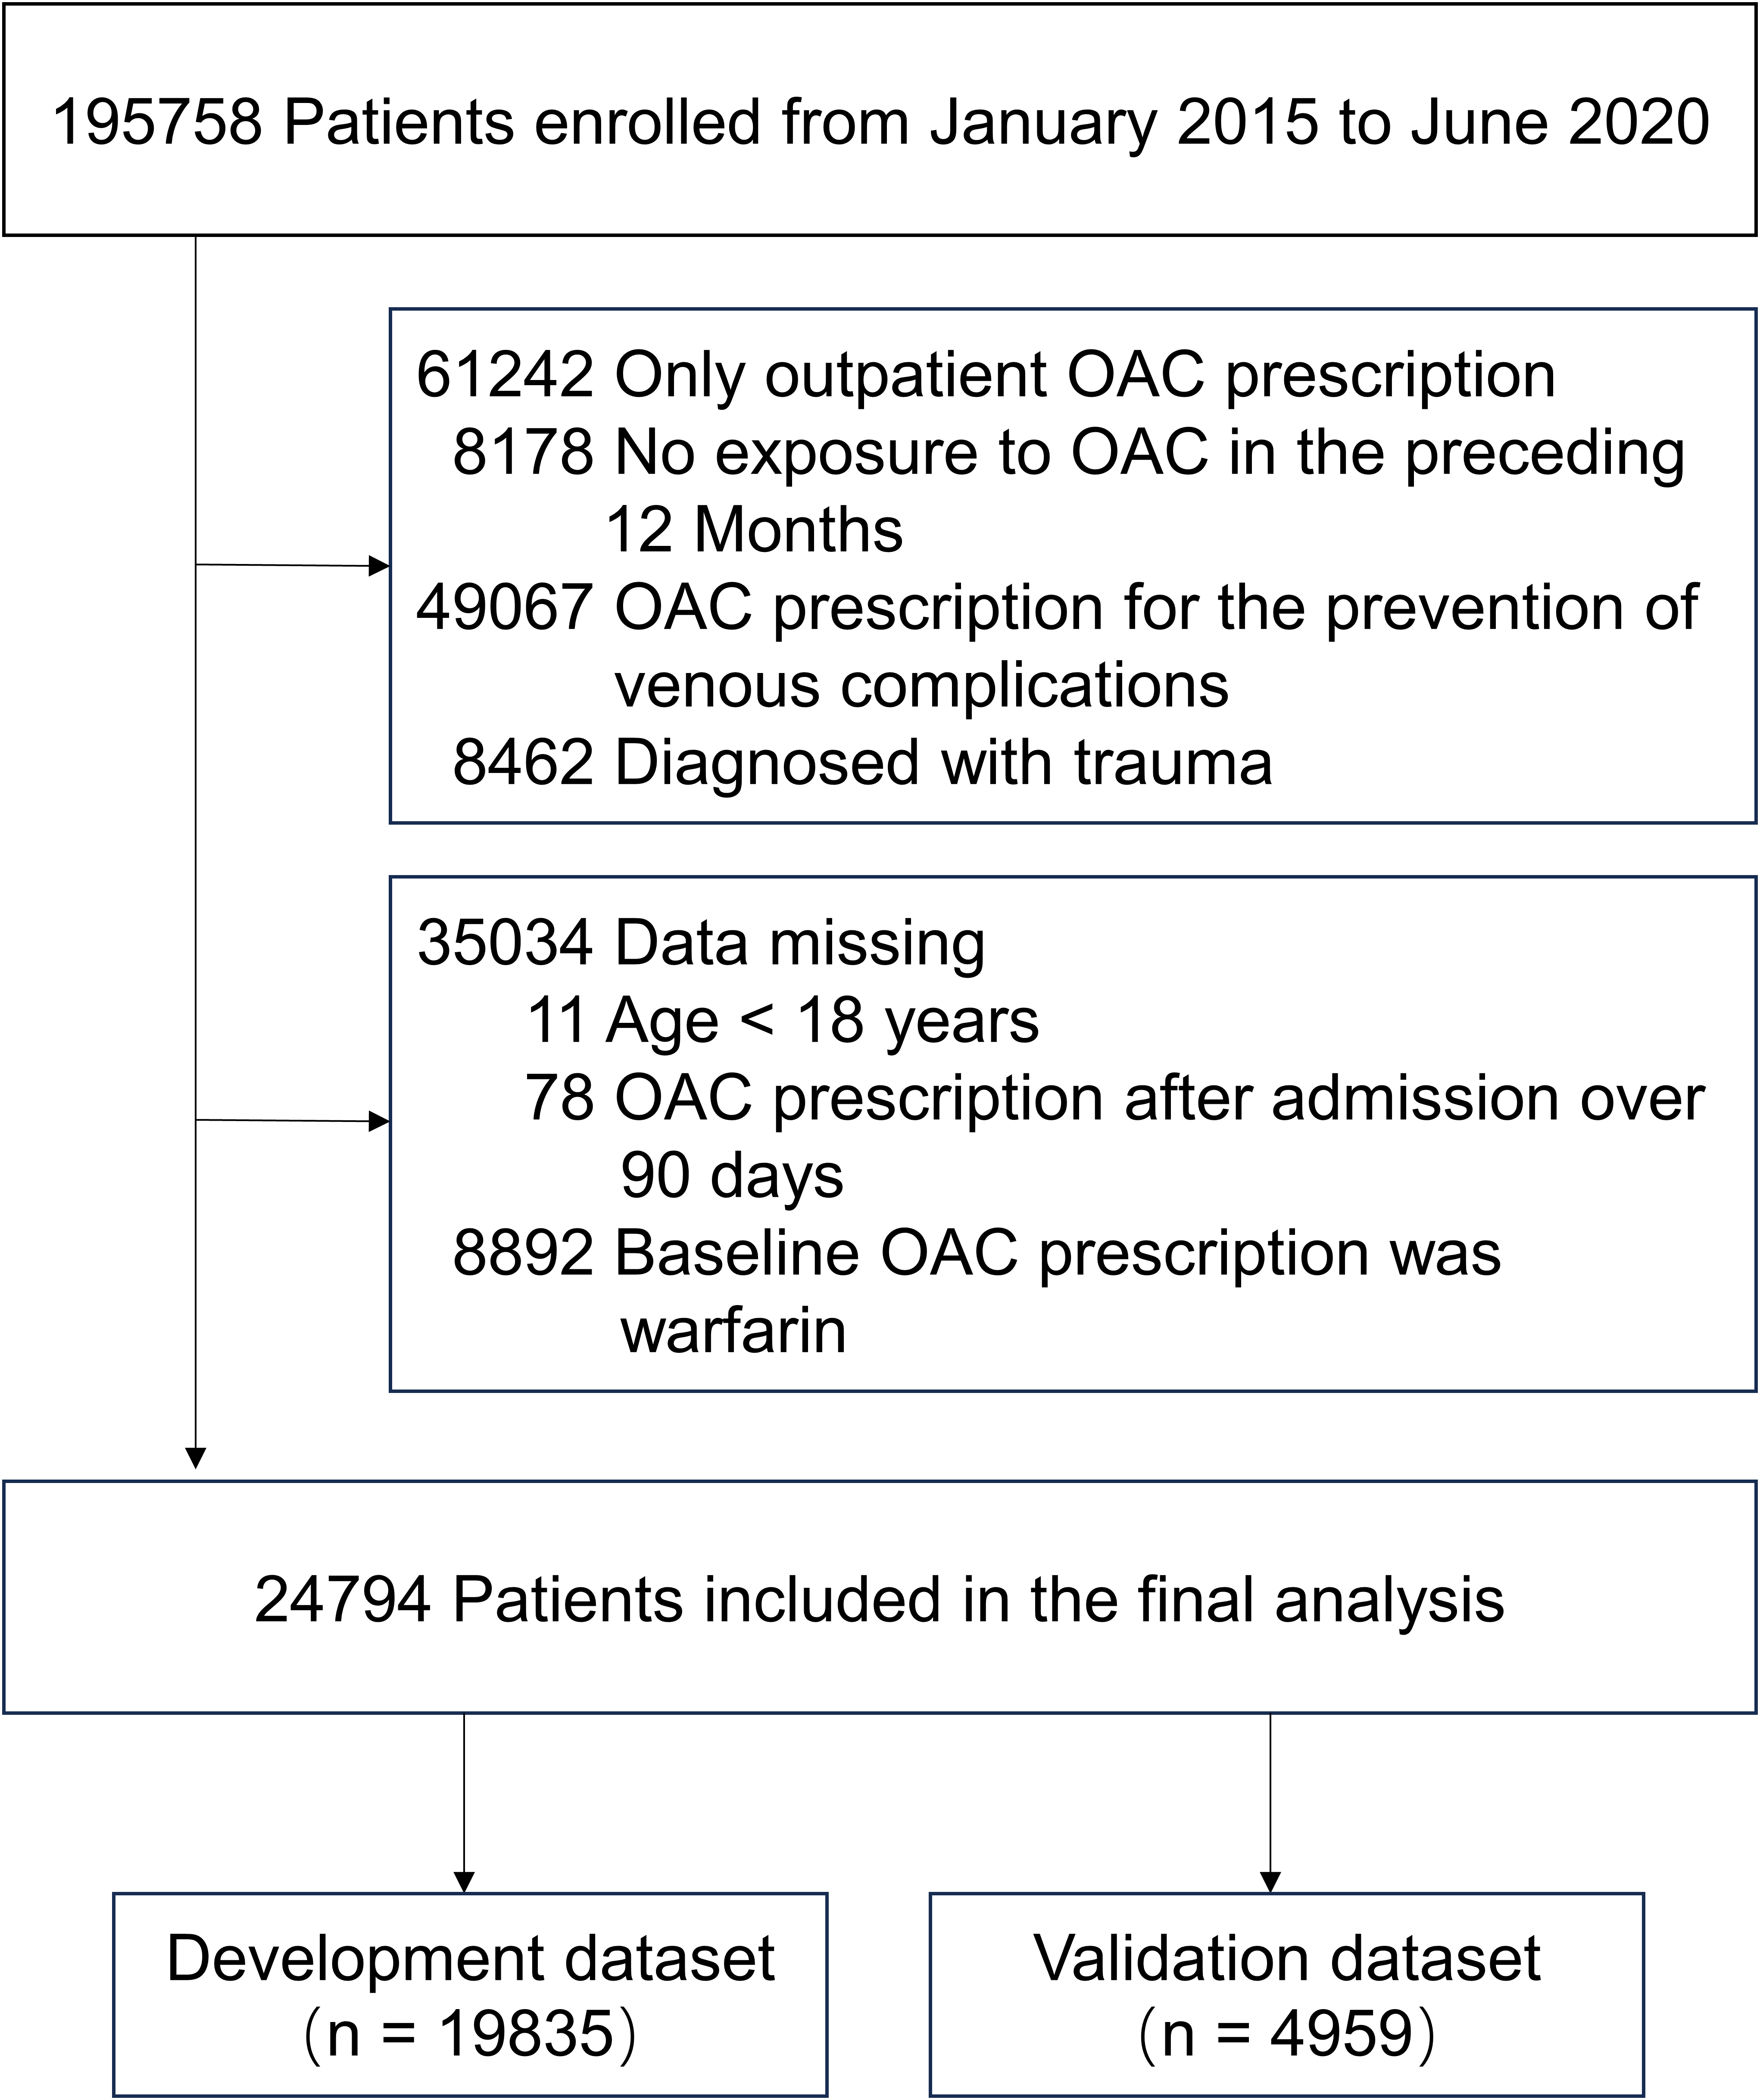
Patient selection flowchart for ICH risk prediction model. The cohort was randomly split 4:1 ratio into separate datasets for model development and validation. Abbreviation: OAC = oral anticoagulation.
To protect the privacy of each patient, all personal information was encrypted and de-identified. Therefore, informed consent for this study was waived. THMDP has been approved for use by the Tianjin Municipal Health Commission, and the analytic protocol was approved by the Tianjin Medical University General Hospital Ethical Committee (No. IRB2022-YX-235-01).
Definition of Outcomes
The primary outcome was ICH, which included epidural haemorrhage, subdural haemorrhage, subarachnoid haemorrhage, or intracerebral haemorrhage. Follow-up was conducted until 183 days after the last DOAC prescription, with a maximum follow-up time of 3 years. The diagnosis of ICH was based on the ICD-10 codes and was identified by computed tomography or magnetic resonance imaging results during the follow-up period.
Study Variables
The following variables were included for predictor selection: patient demographics [age, sex, body mass index (BMI), current drinking and daily smoking], past medical history [hypertension, diabetes mellitus, heart failure, peripheral artery disease (PAD), chronic pulmonary disease, abnormal renal function, ischemic stroke, hemorrhagic stroke, gastrointestinal disease, abnormal liver function, metastatic tumor, anemia, coagulopathy, VTE, connective tissue disease and valvular disease], clinical characteristics [hemoglobin, serum levels of triglyceride (TG), LDL-C, serum albumin and uric acid], type of DOAC (dabigatran, rivaroxaban, and other) and concomitant medication use [aspirin, P2Y12 Inhibitor, nonsteroidal anti-inflammatory drugs (NSAIDs), glucocorticoid]. The study used ICD-10 codes to identify medical history. Definitions of the study variables are provided in Table S1 and Table S2 in Supplemental Material.
The DOAC score included age, creatinine clearance/glomerular filtration rate, underweight status, stroke/transient ischemic attack/embolism history, diabetes mellitus, hypertension, antiplatelet use, NASIDs, liver disease, and bleeding history. 9
Statistical Analysis
The variables were reported as means (± SD) for normally distributed data and medians with interquartile range (IQR) for non-parametric data. Categorical variables were presented as percentages. Continuous variables (such as age, LDL-C and TG) were investigated for nonlinearity, and plots of each continuous variable versus rates of ICH were reviewed to create dichotomous cut points when suitable.
Three selection strategies were used for model development. They were (1) forward stepwise selection based on logistic regression, (2) the LASSO binary logistic regression, and (3) XGBoost. The forward stepwise selection use P < 0.1 as entry criterion. LASSO regression reduces the complexity of the model by penalizing the regression model to shrink the regression coefficients toward 0. The LASSO penalty parameter “λ” was determined through 10-fold cross-validation with mean squared error as the loss function. XGBoost is the supervised machine learning method. XGBoost incorporates a measure of how a model's accuracy is improved by the addition of a given variable, with a higher gain value implying greater importance in generating a prediction. The objective function we use for XGBoost is logistic regression. Furthermore, model scoring analysis was employed to validate the variable selection. 15 The variables are selected as predictors when the model exhibits optimal performance.
To obtain the optimal model, we evaluated the model performance by pseudo R-squared, Hosmer-Lemeshow Goodness-of-Fit test, Akaike's information criteria (AIC), and Bayesian information criteria (BIC). Receiver operating characteristic curves (ROC) and the corresponding area under the curve (AUC) and net reclassification index (NRI) were also used to compare the three models for the optimal model. The final optimal model was presented as a nomogram, in which every selected variable was assigned a value on the basis of its coefficient in the final model. We also compared the final optimal model with the DOAC score by using AUC and NRI. Risk categories were created according to less than 1%, 1%–5%, and greater than 5% risk for ICH. The association between risk categories and ICH was assessed by using logistic regression model. Then, we tested the performance of the final optimal model in the internal validation dataset. We also conducted subgroup analyses to evaluate the AUC of our final optimal model across different treatment indications and types of DOAC.
For variables with missing values, we imputed the missing data using MissForest, a random forest imputation algorithm for missing data implemented in R software, version 4.1.3. The missing rates of the study variables are shown in Table S3 in Supplemental Material. Statistical analysis was performed using STATA 16.0 (StataCorp, College Station, TX) and R (version 4.1.3). Statistical significance was determined at a P-value <0.05 using a two-tailed test.
Result
A total of 24,794 eligible patients were enrolled between January 2015 and June 2020 (
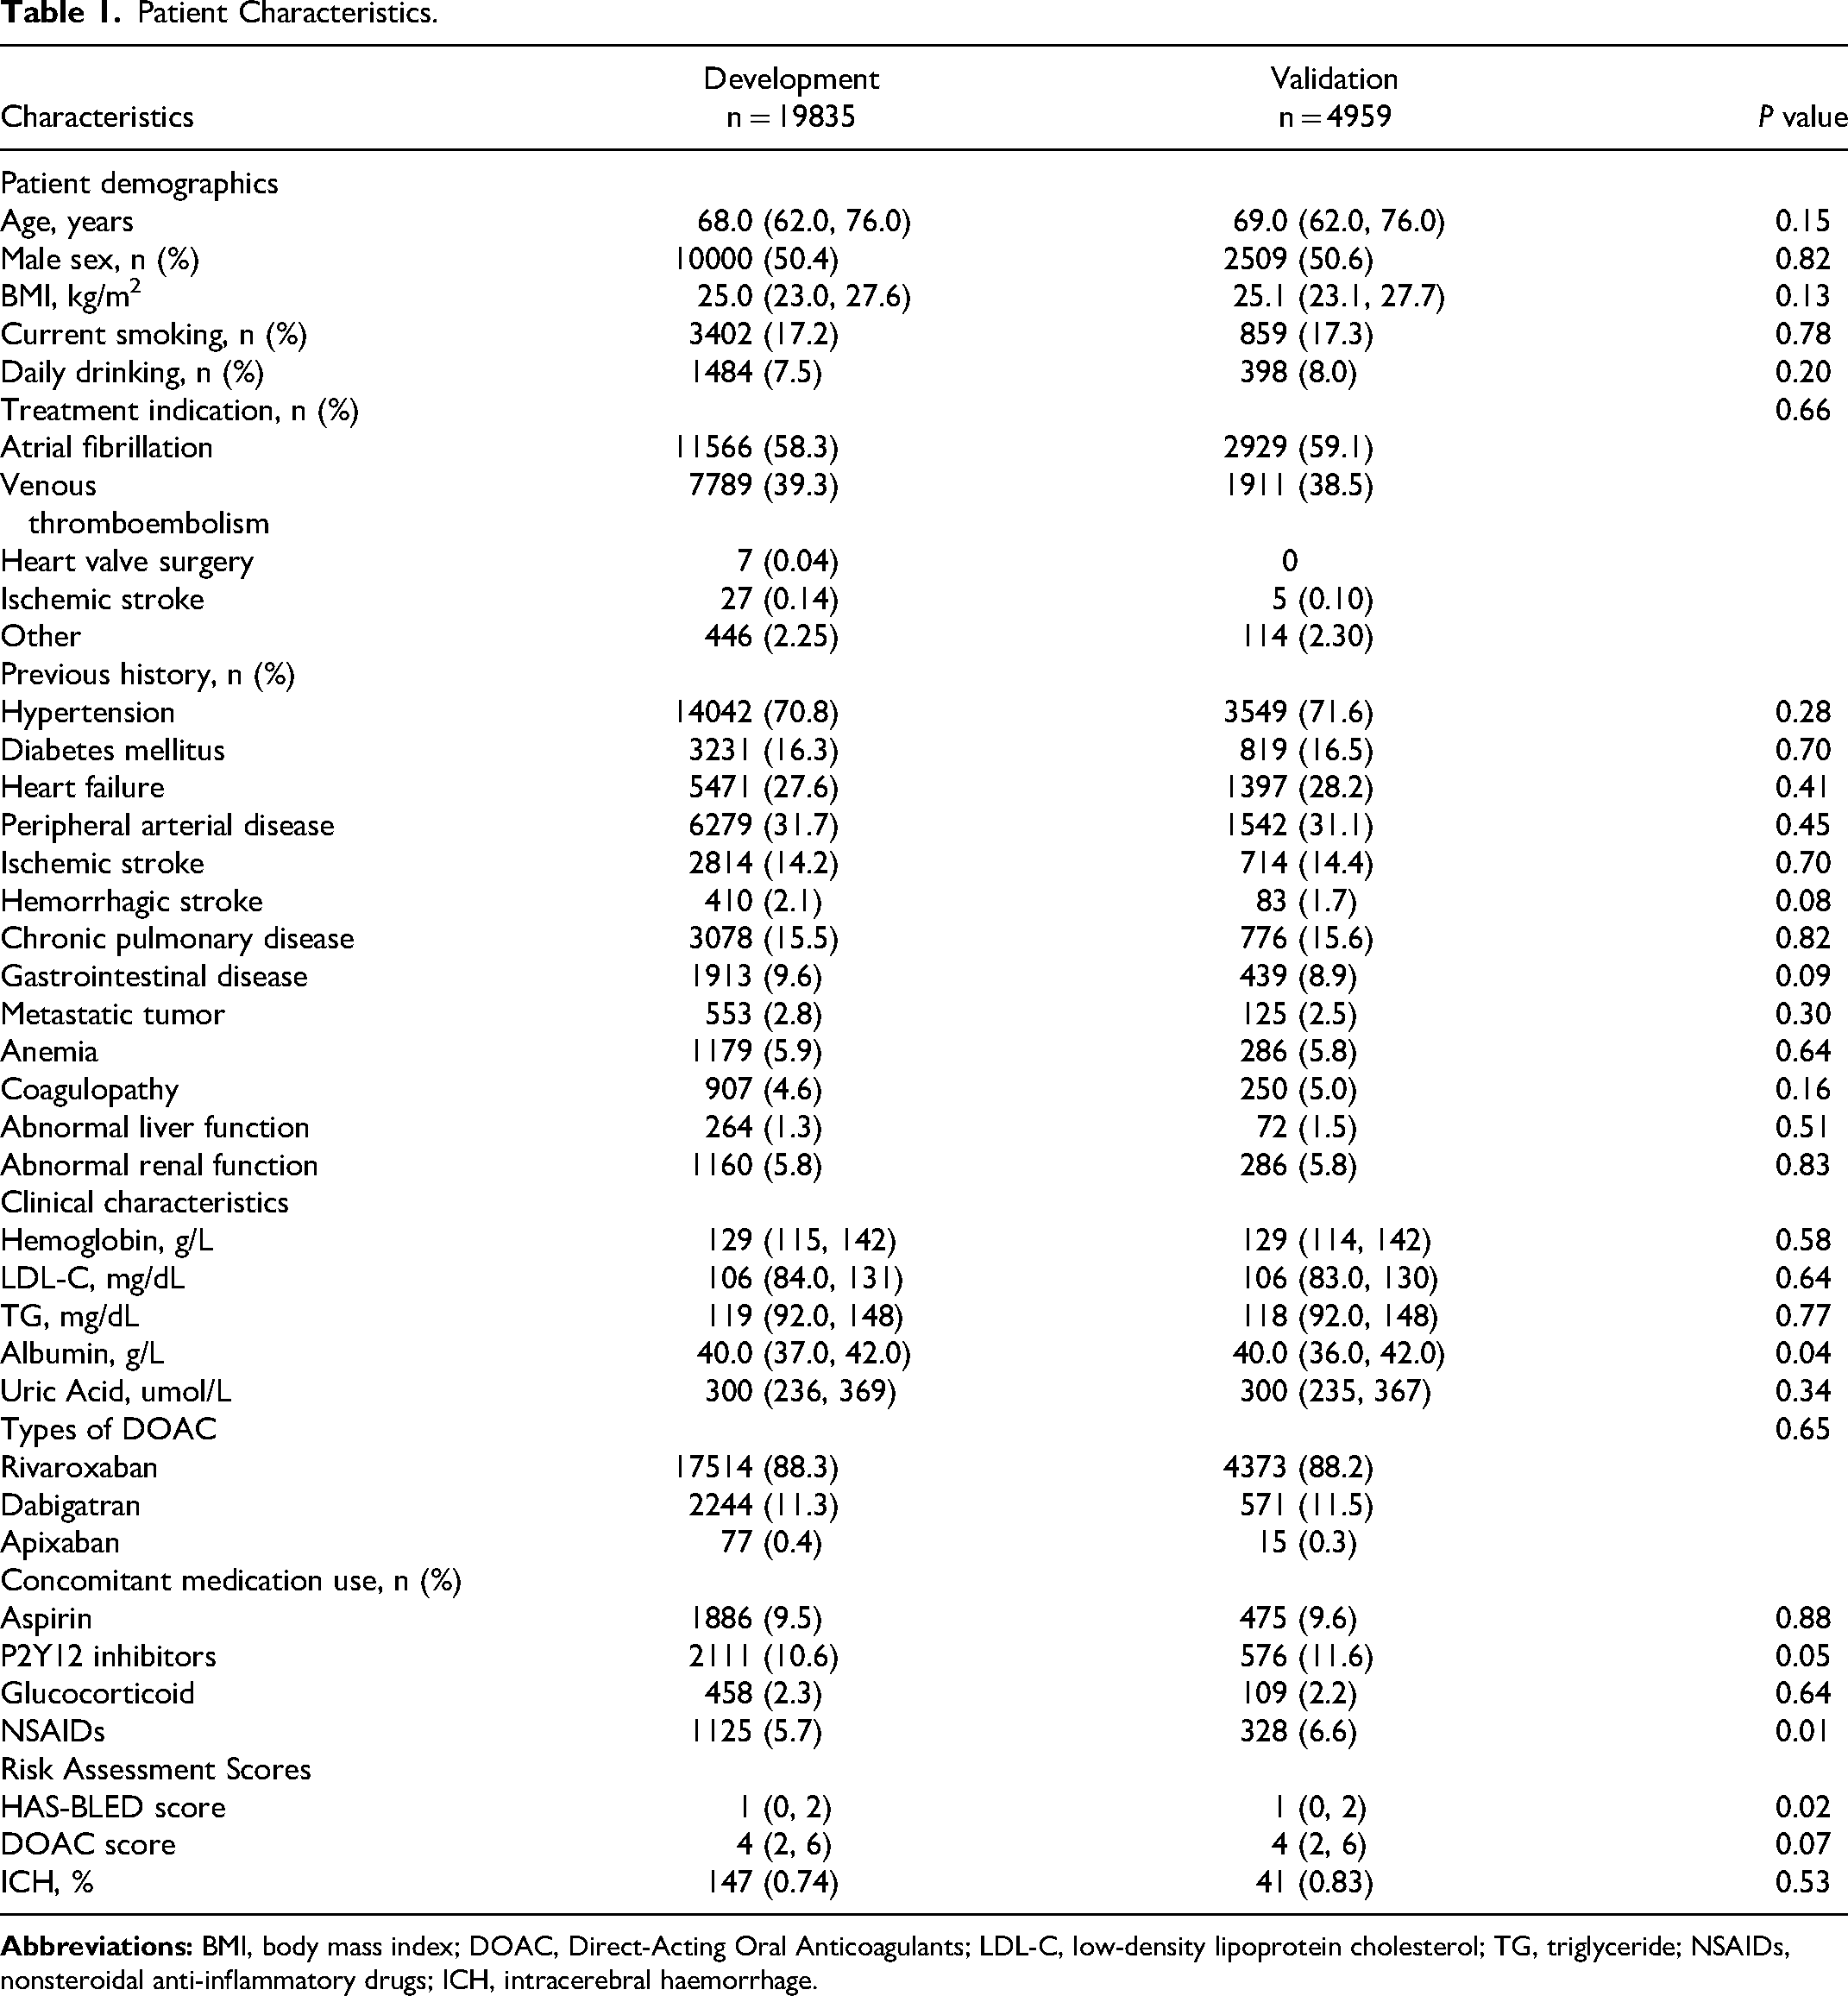
Patient Characteristics.
Feature Selection
Based on 19,835 patients in the development dataset, among 32 variables, 6 variables (history of hemorrhagic stroke, hypertension, LDL-C levels, history of VTE, history of PAD, and abnormal renal function) were selected as independent predictors with the forward stepwise logistic regression model. The same variables were selected as independent predictors with the LASSO model. The LASSO penalty parameter and clinical variable screening are presented in Figure S1 in the Supplemental Material. By using XGBoost, the top 14 most important features are depicted in Figure S2A in Supplemental Material. The model scoring analysis demonstrated optimal performance when the aforementioned six variables were utilized (Figure S2B in Supplemental Material). Therefore, 6 variables (history of hemorrhagic stroke, hypertension, age, history of PAD, LDL-C levels, and history of VTE) were selected as independent predictors with the XGBoost model. Then we combined the selected variables together as the full model. The variables and coefficients for each model were shown in
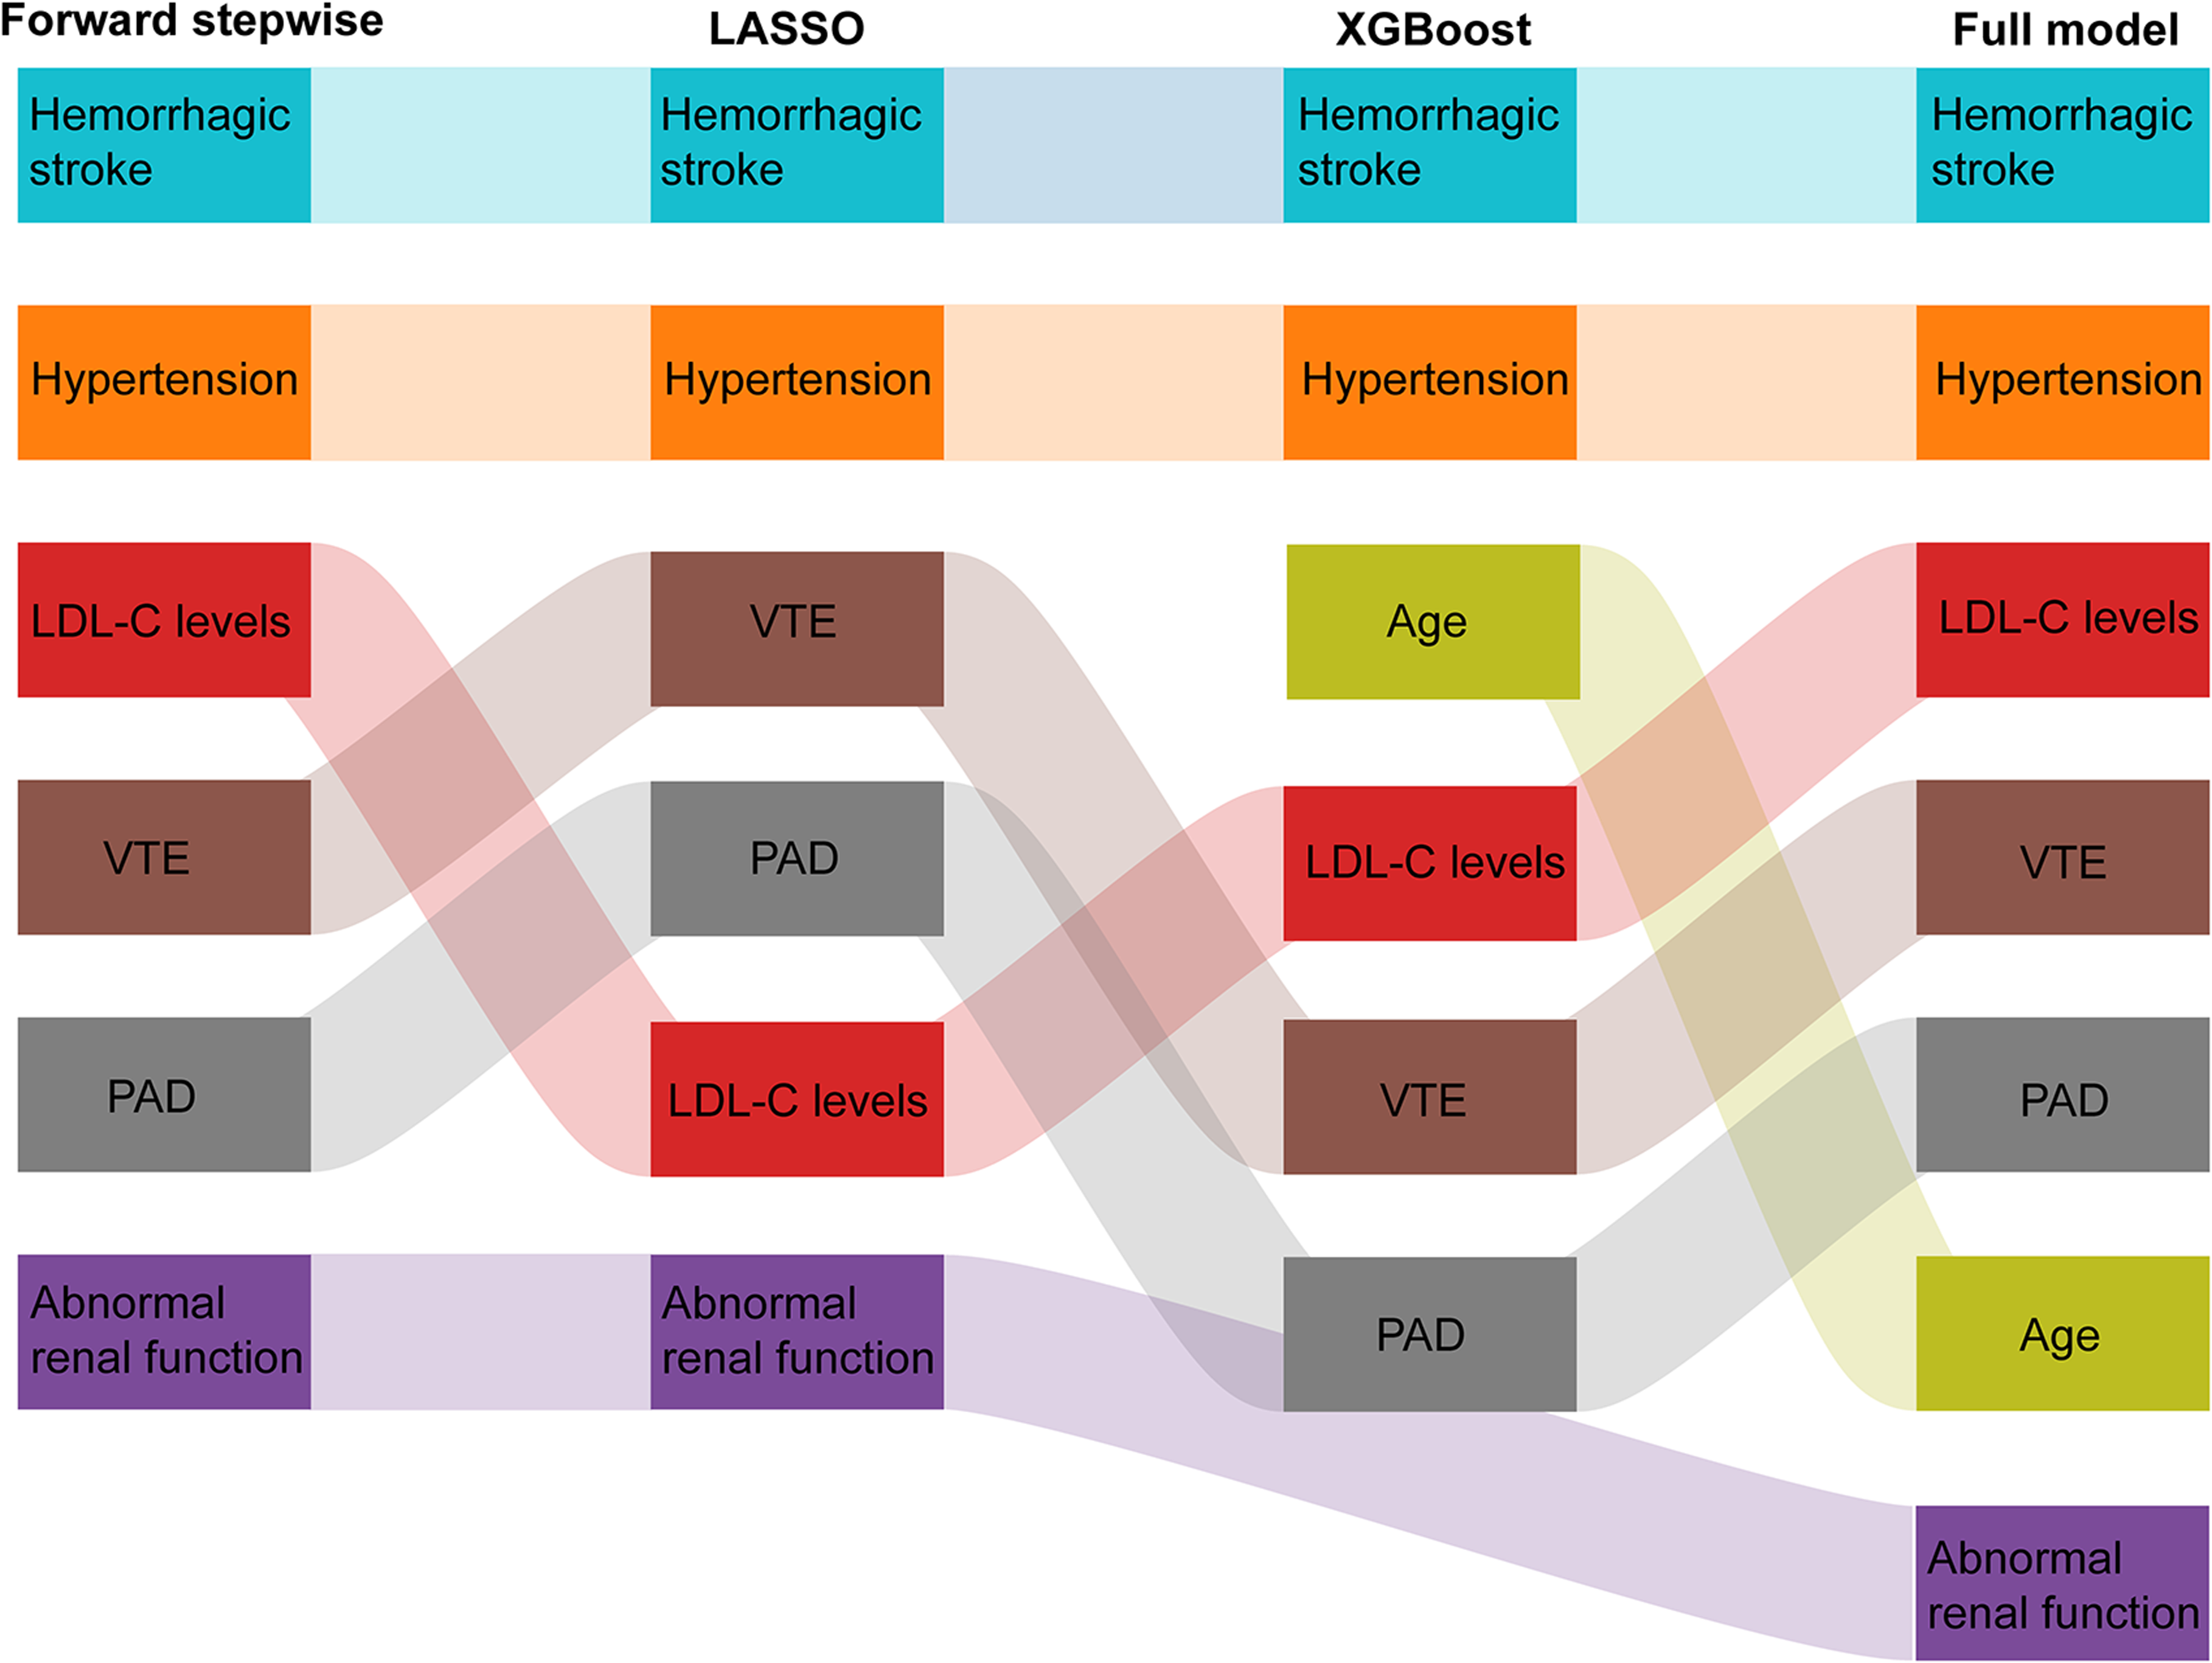
Variable selection across different statistical models for ICH risk prediction. This Sankey diagram illustrates the variable selection process using forward stepwise regression, LASSO, and XGBoost model, as well as the compilation of these variables into a full model for predicting ICH risk. Each column represents the set of variables chosen by the corresponding model, with the final column representing the aggregation of variables into a comprehensive full model. The flow of variables between the methods indicates their relative importance and selection consistency in the model development process. Abbreviation: LASSO = Least Absolute Shrinkage and Selection Operator; LDL-C = low-density lipoprotein cholesterol; PAD = peripheral artery disease; VTE = venous thromboembolism; XGBoost = eXtreme Gradient Boosting.
Performance and Comparison of Models
Considering the consistent variables screened by the forward stepwise model and the LASSO model, we combined the two models into one model. We then compared the performance of the forward/LASSO, XGBoost and the full model. Table S4 in Supplemental Material depicted the performance of the three models. The pseudo R-squared, Hosmer-Lemeshow Goodness-of-Fit test, AIC, and BIC are similar in the three models. The AUC was 0.68 (95% confidence interval [CI]: 0.64–0.73) (forward/LASSO model), 0.68 (95% CI: 0.64–0.73) (XGBoost model), and 0.69 (95% CI: 0.65–0.73) (full model) for the development dataset, respectively. There was no statistically significant difference in AUCs between the three groups (P = 0.287) (
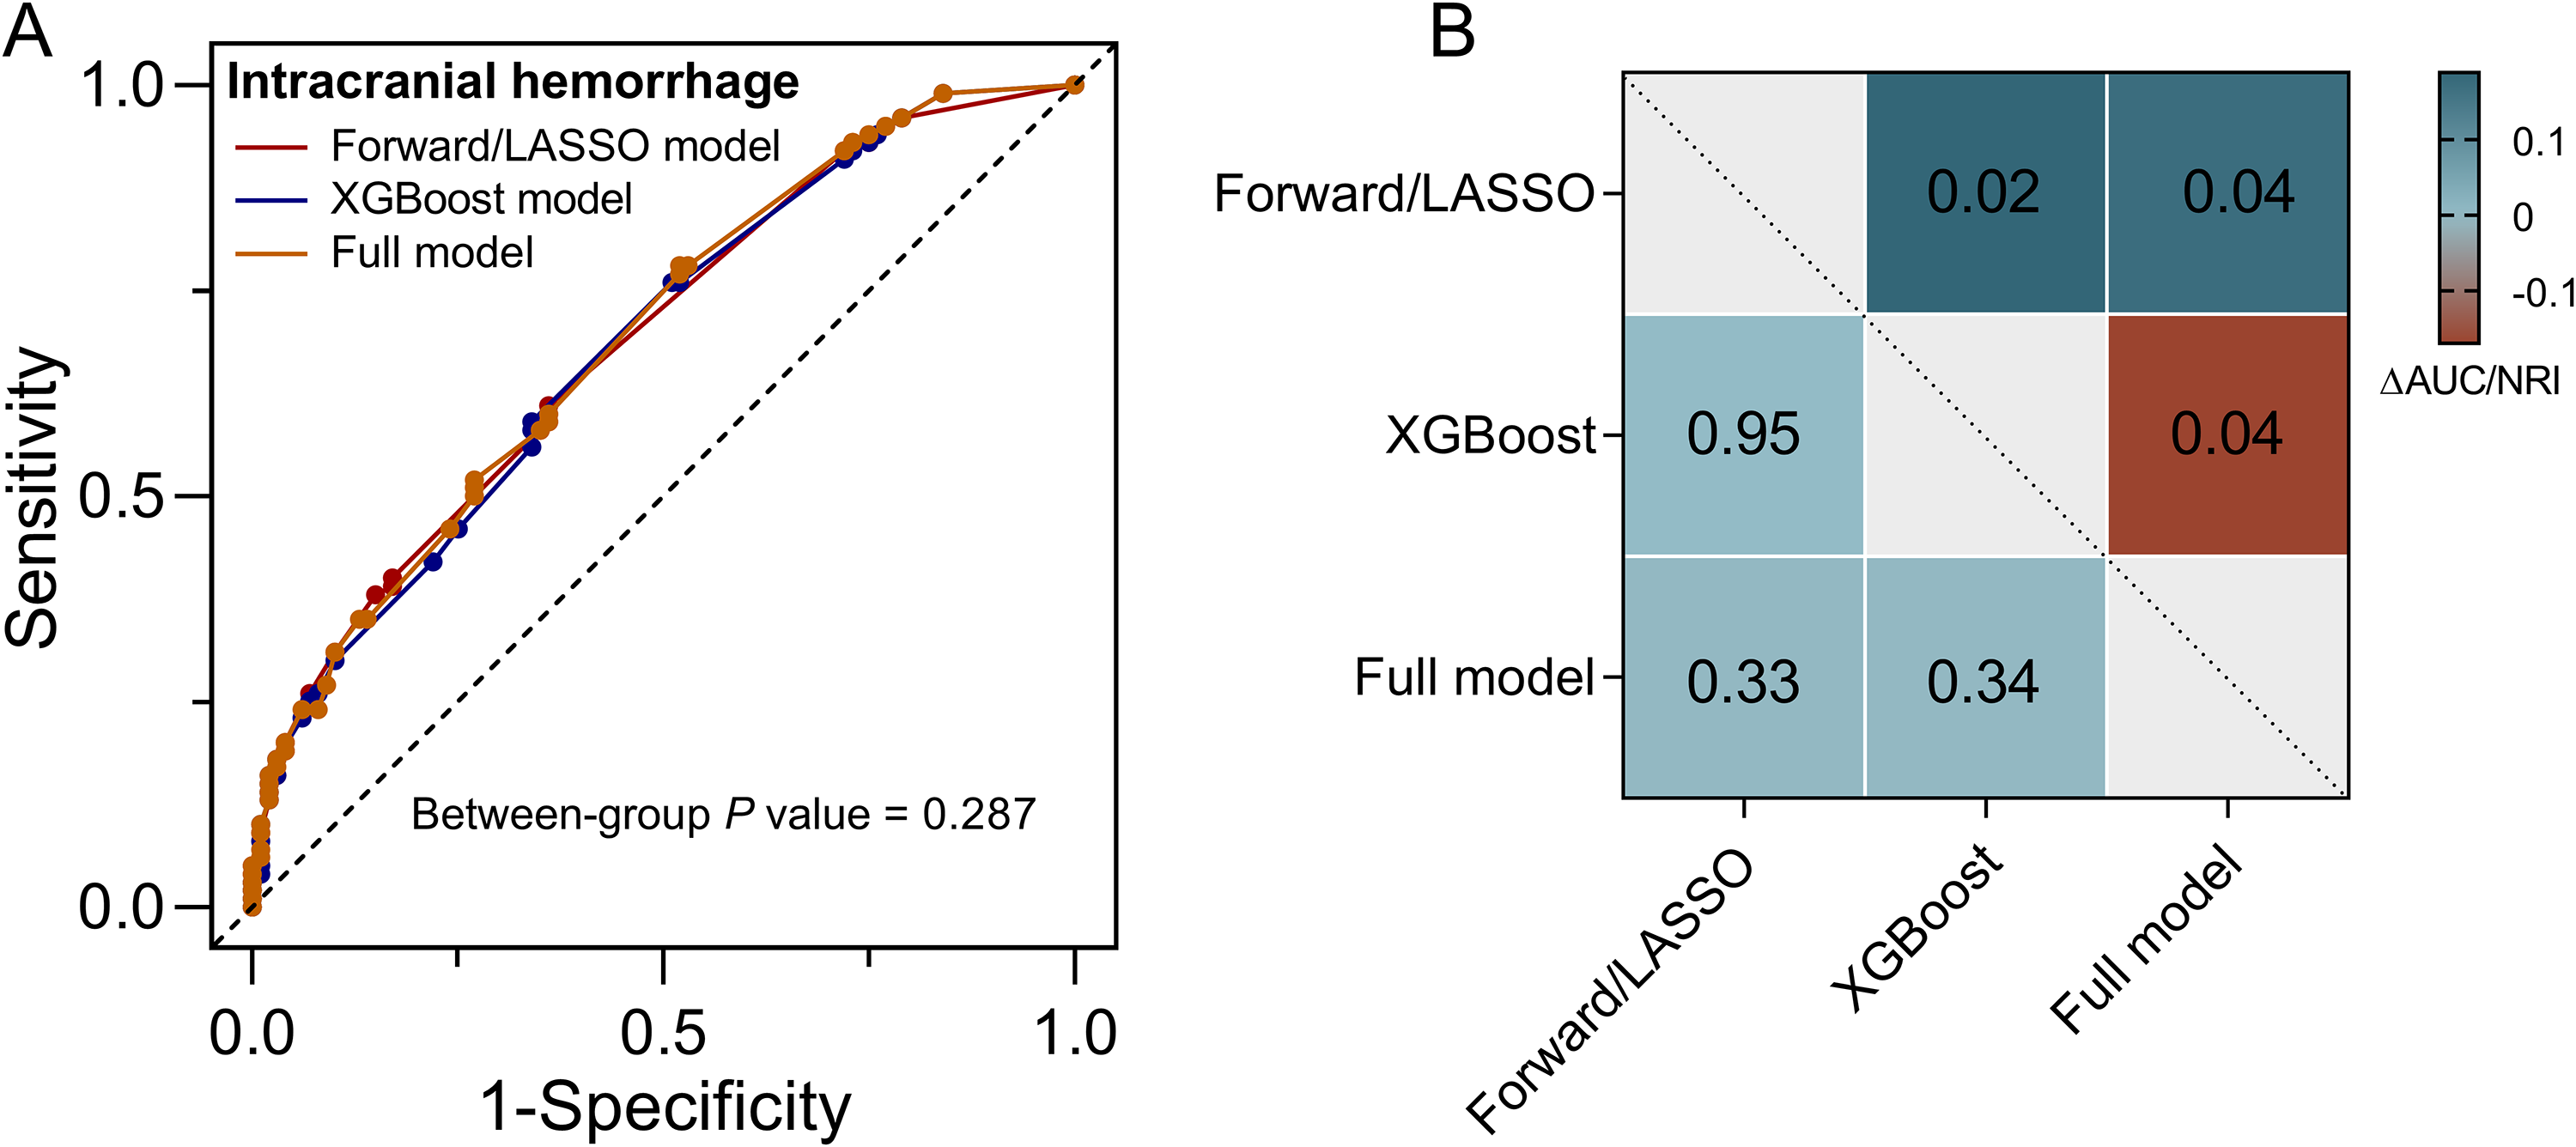
Comparison of model performances for predicting ICH.
Nomogram and Risk Categories
The XGBoost model for ICH in patients on OAC therapy with the six predictors described above is presented as a nomogram (
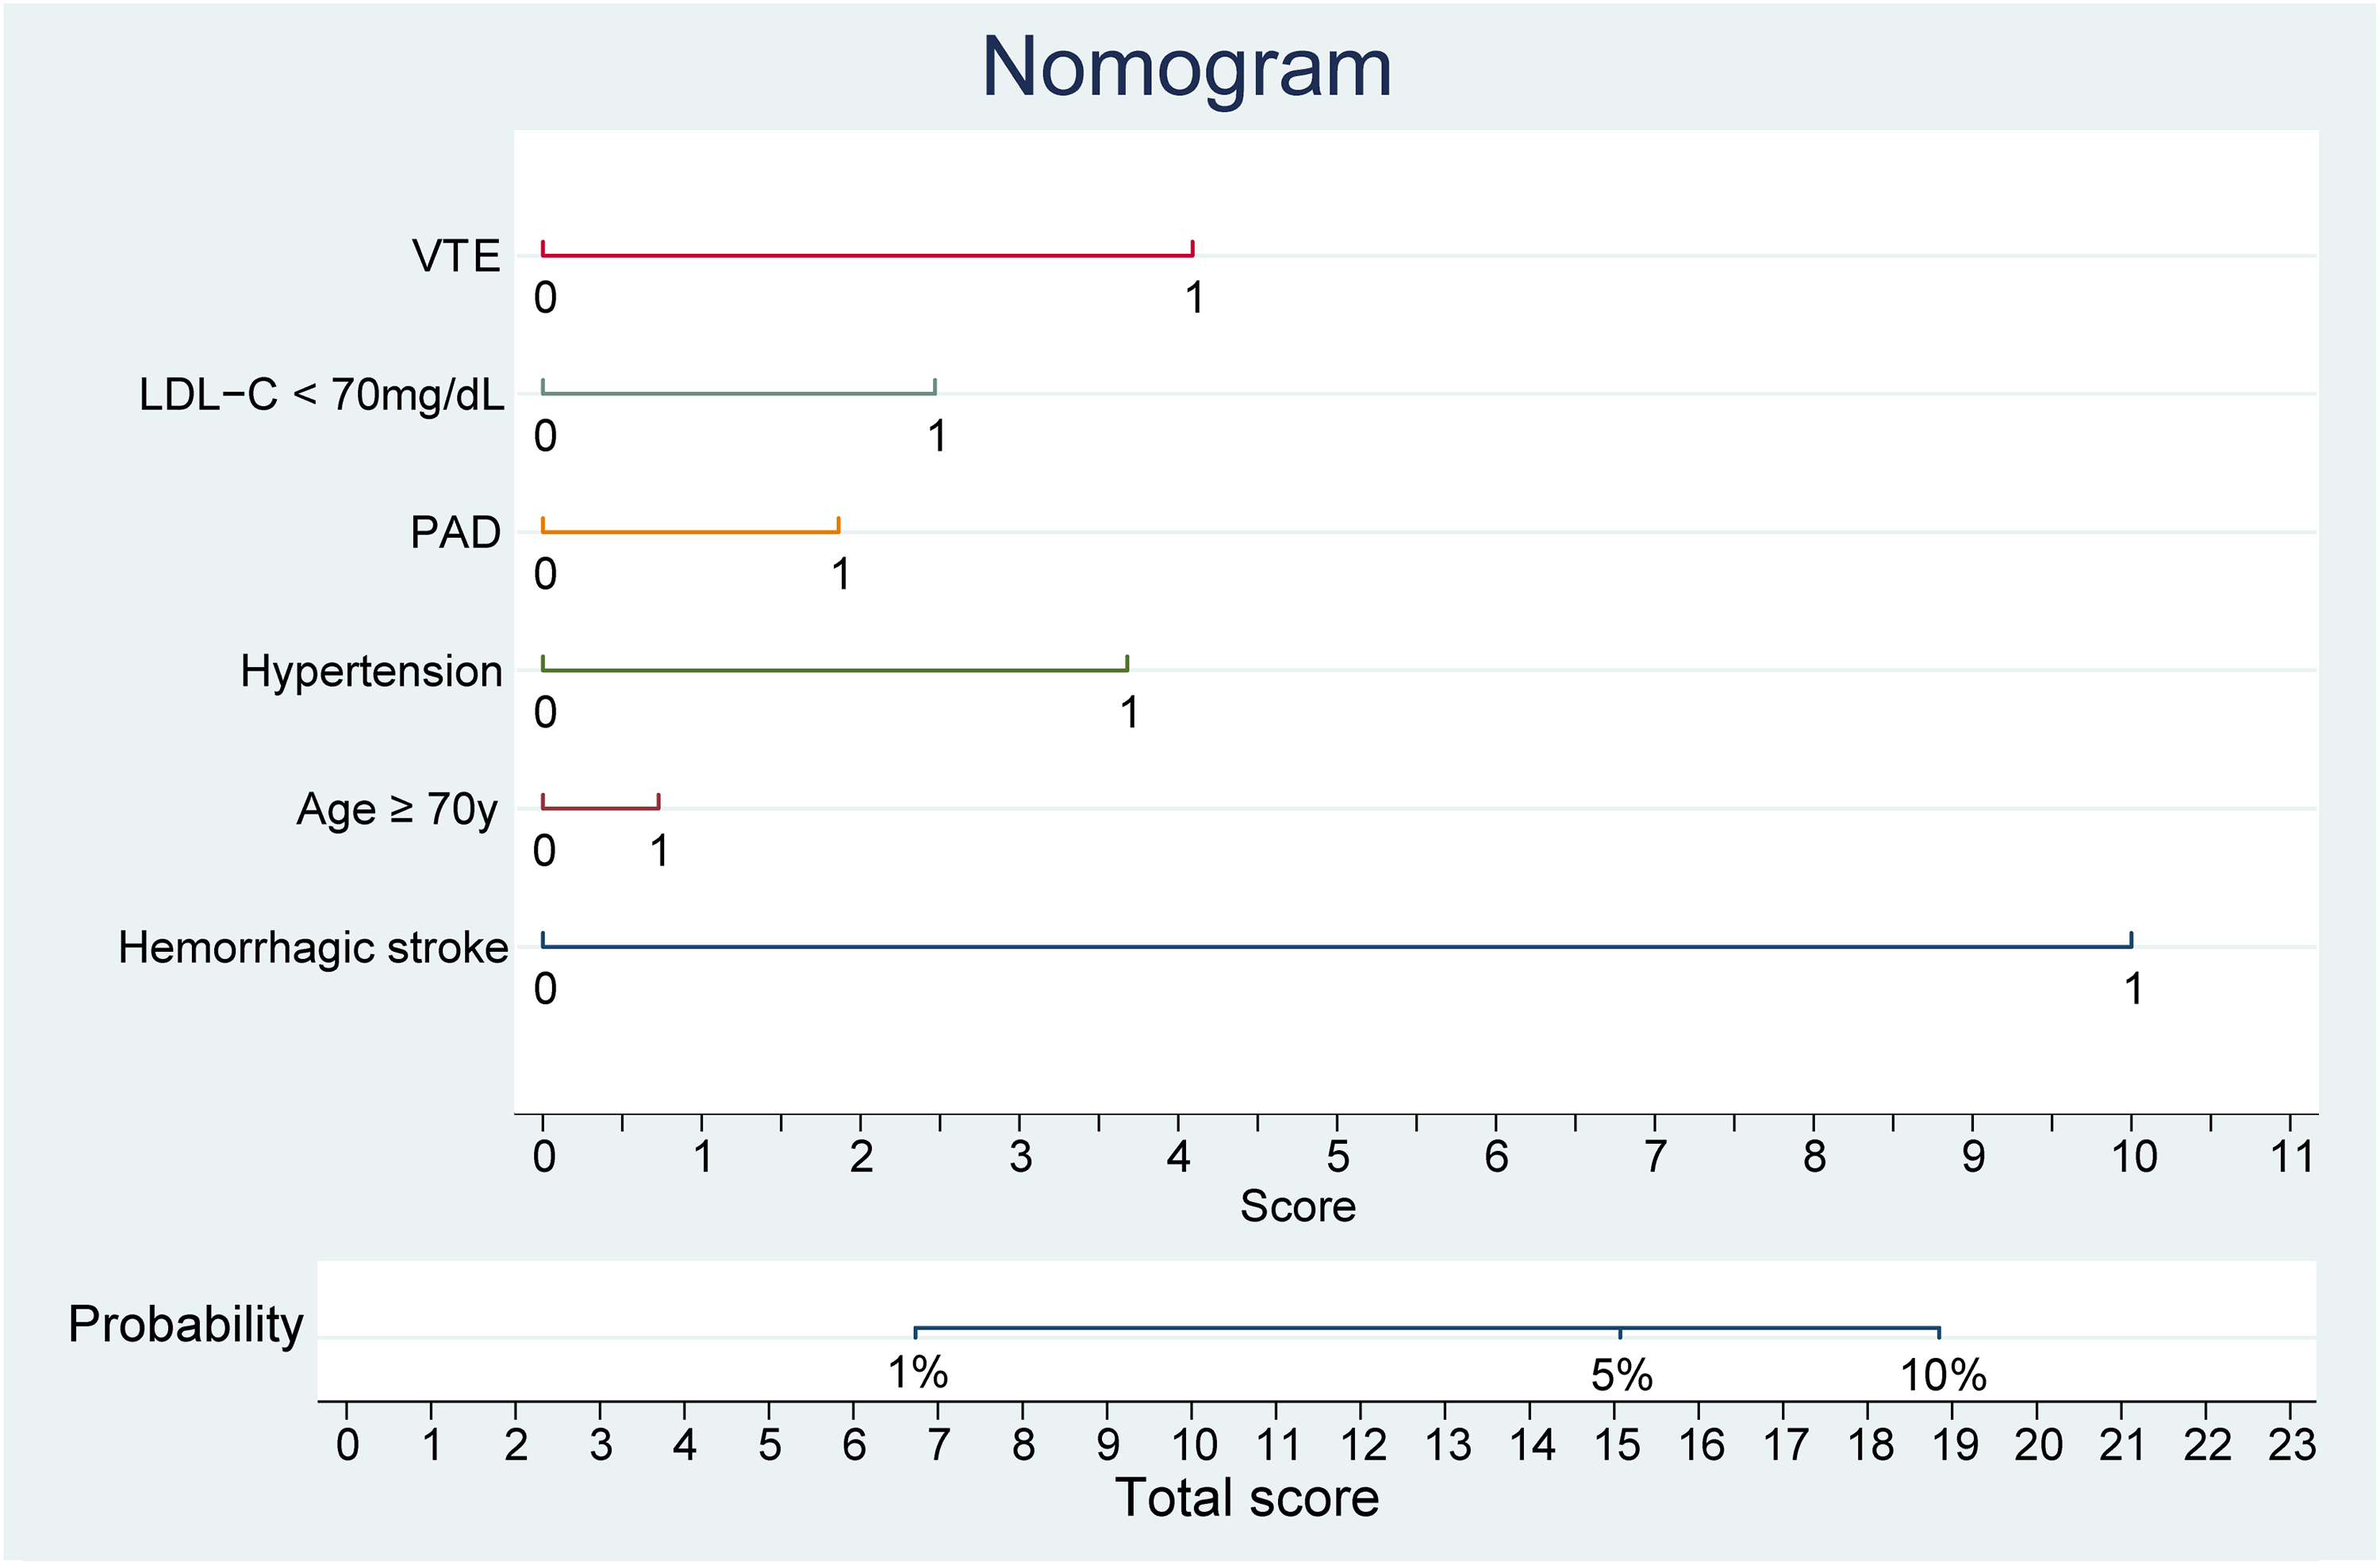
Nomogram for predicting the probability of ICH based on XGBoost model. This nomogram integrates the predictive factors identified by the XGBoost model to estimate the individual probability of ICH. Factors included are history of hemorrhagic stroke, age ≥ 70 years, hypertension, history of PAD, LDL-C levels < 70 mg/dL, and history of VTE. Each predictor's value corresponds to a point on the scale, and the sum of these points, represented on the ‘Total score’ line, correlates with the probability of ICH. The ‘Probability’ axis at the bottom translates the total score into the corresponding risk percentage, stratified into <1%, 1%–5%, and >5% risk categories. Abbreviation: LDL-C = low-density lipoprotein cholesterol; PAD = peripheral artery disease; VTE = venous thromboembolism.
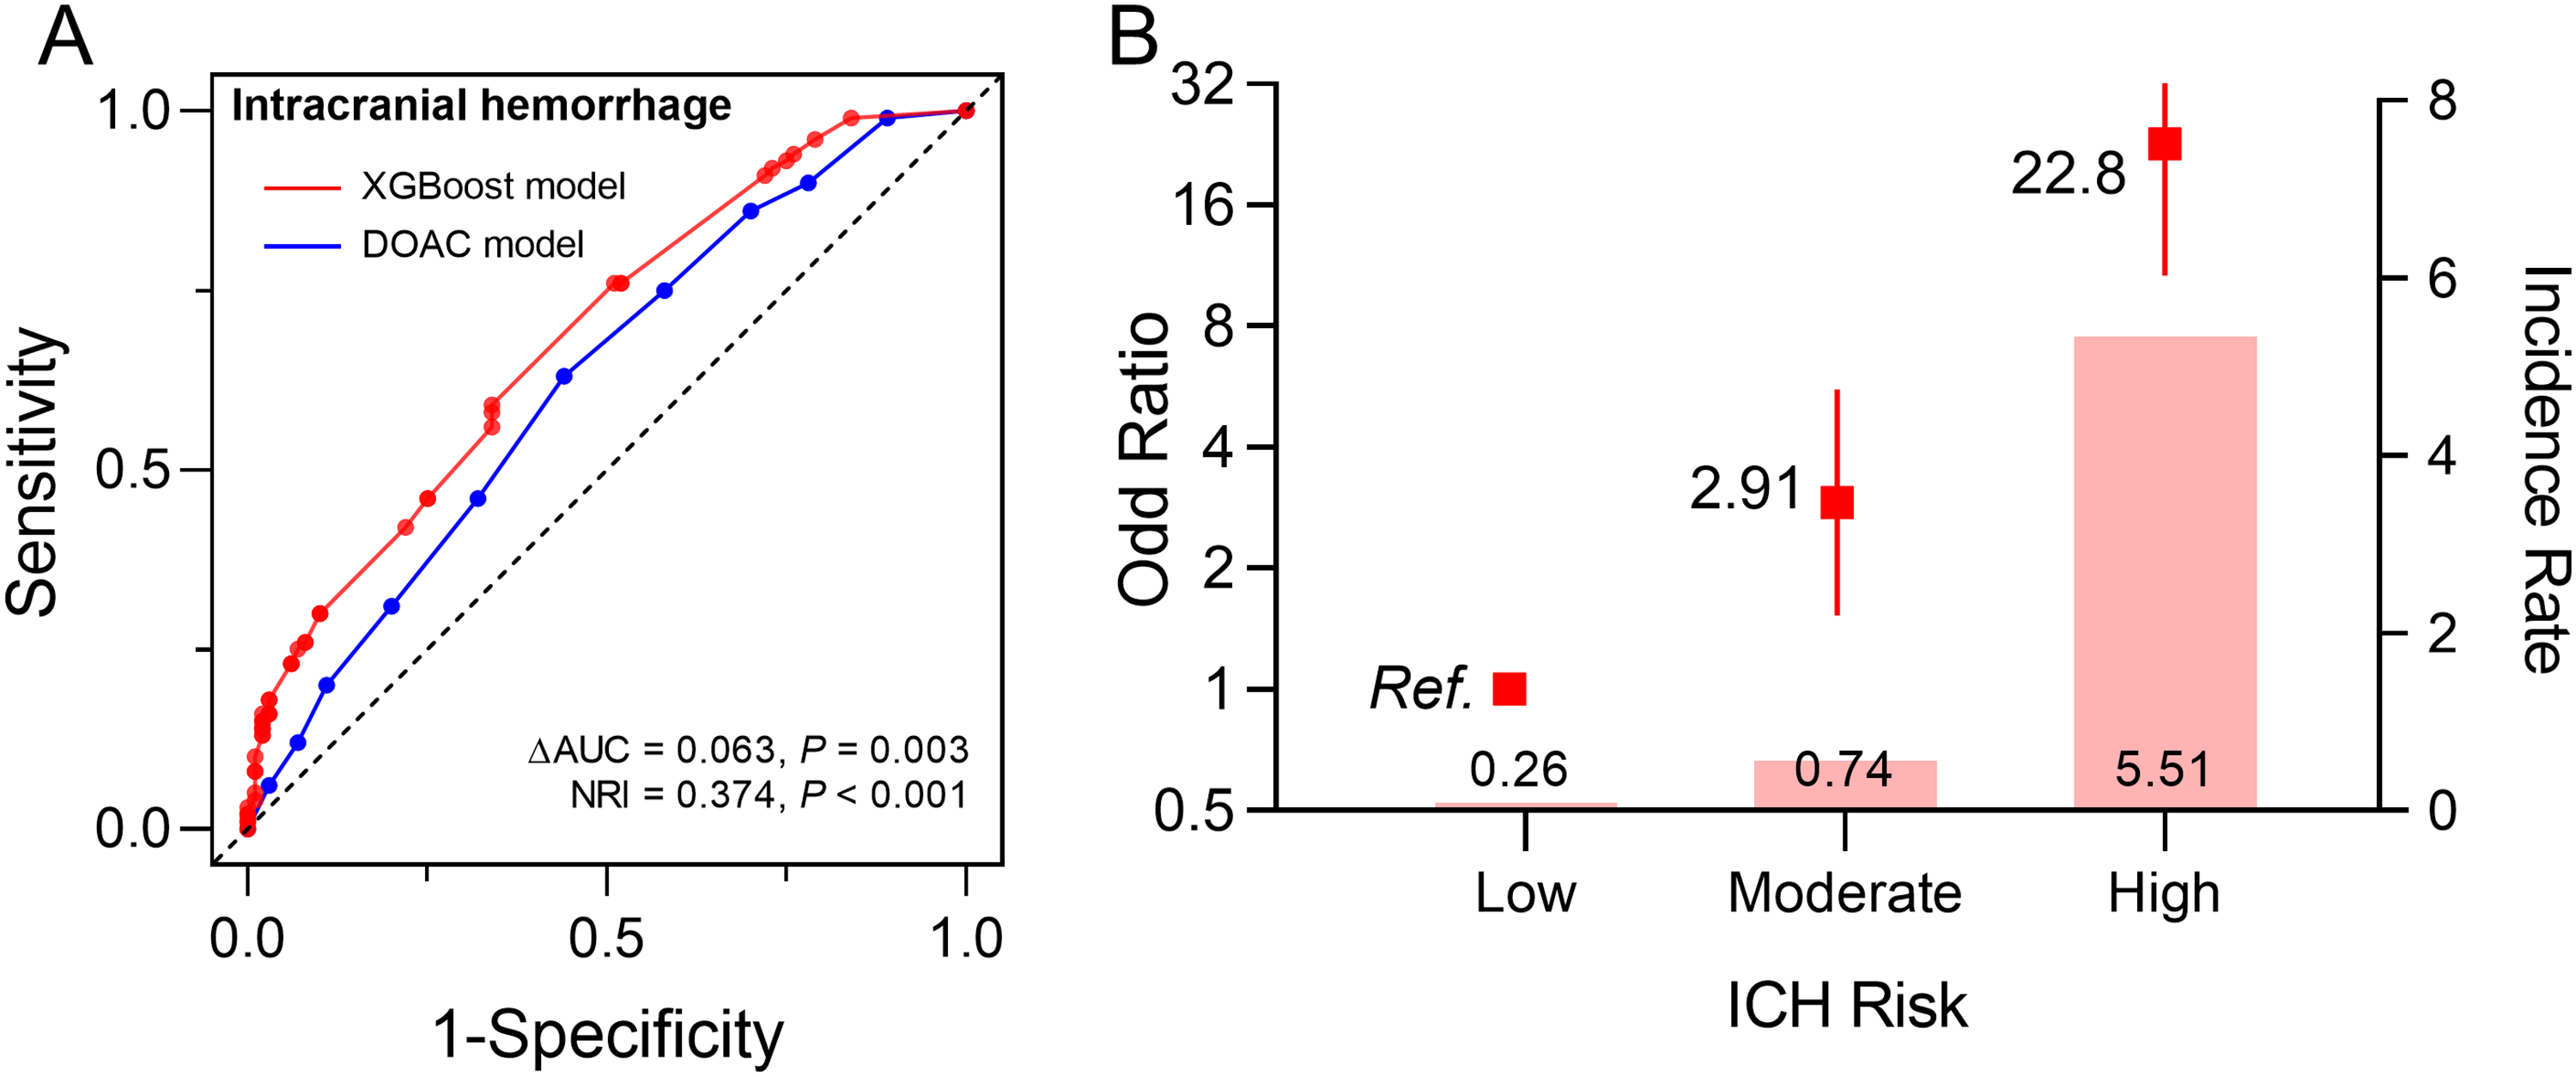
Performance and population risk stratification of the XGBoost model in the training set for ICH prediction.
Internal Validation of the Nomogram
The performance of the XGBoost model in the validation dataset was similar with that in the derivation dataset. In the validation dataset (4,959 participants), the AUC for the model was 0.68 (95% CI: 0.60–0.77), and the model for ICH improved model performance compared with the DOAC score (AUC: 0.58, 95% CI: 0.49–0.66 for DOAC score; ΔAUC =0.101, P = 0.030; NRI =0.490, P = 0.002) (
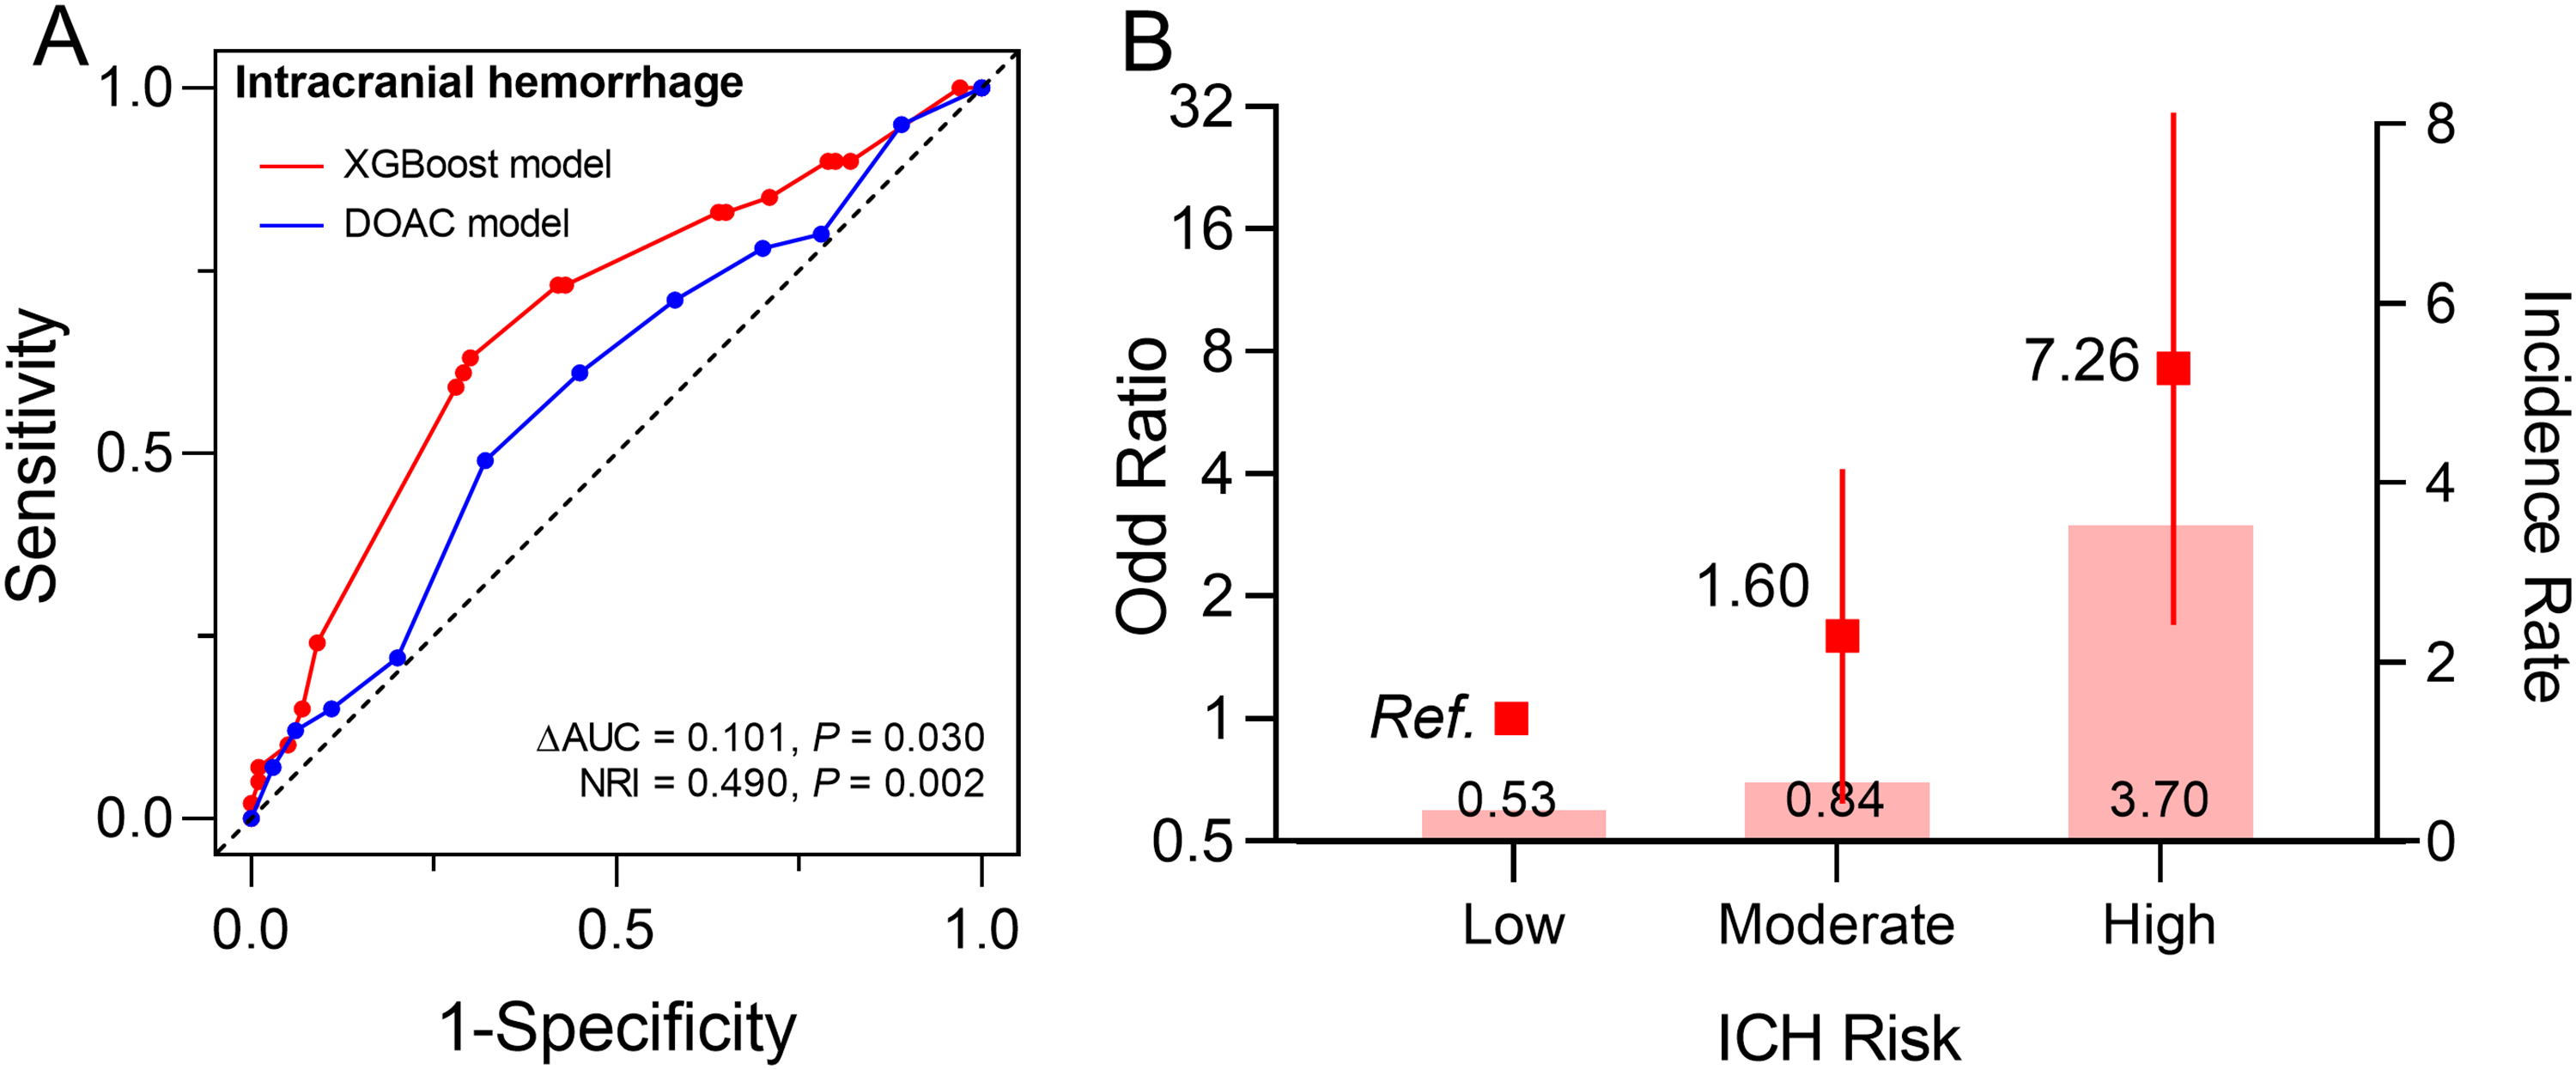
Evaluation of the XGBoost model's performance and risk stratification in the validation set for ICH prediction.
Subgroup Analysis
We evaluated the model's performance across different treatment indications and types of DOACs, demonstrating moderate discrimination in most cases (Table S5 in Supplemental Material). For treatment indications, the model performed similarly in both the AF and VTE groups, with AUC values ranging from 0.62 to 0.72 in the development and validation sets. The model achieved its best performance in the AF group within the validation set (AUC: 0.72, 95% CI: 0.63–0.80). Among the types of DOACs, the model performed better in the rivaroxaban group compared to the dabigatran group (AUC: 0.70, 95% CI: 0.66–0.74 vs AUC: 0.56, 95% CI: 0.42–0.69, respectively), possibly due to the small sample size of the dabigatran group, which limits the accurate estimation of the model's performance.
Discussion
Leveraging a large EHR-based cohort from a real-world population prescribed a DOAC therapy in China, we developed three models for predicting the risk of ICH: forward stepwise selection /LASSO, XGBoost, and a full model. While all three models demonstrated similar AUC performance, the XGBoost model outperformed the others in terms of NRI. The XGBoost model identified 6 independent risk factors of ICH (history of hemorrhagic stroke, hypertension, age, history of PAD, LDL-C levels, and history of VTE), with the constructed nomogram demonstrating moderate discrimination [AUC: 0.68 (0.64–0.73)], surpassing the existing DOAC scores (ΔAUC =0.063, P = 0.003; NRI =0.374, P < 0.001). We further stratified the risk scores, successfully identifying individuals at high, moderate, and low risk. Finally, the model demonstrated consistent predictive performance in an internal validation set.
Anticoagulation use has been increasing continuously in both Western 16 and developing nations, such as China17,18 owing to multiple factors, such as economic growth, an aging population, regional difference, and the burden of cardiovascular diseases. Over the past two decades, there has been a transition from VKAs to DOACs.19,20 However, prior DOAC usage among patients with ICH is associated with higher mortality compared to those not on any OACs, with DOAC-associated ICH often resulting in severe outcomes, including frequent hematoma expansion.21,22 Bleeding and ICH is also problematic in anticoagulated patients from east Asia, with much higher bleeding risks seen in these patients, when compared to non-Asian populations.23,24
Our initial variable selection process involved the forward stepwise logistic regression and LASSO models. Subsequently, we confirmed the superiority of the XGBoost model through comparative analysis. The XGBoost model is interpretable, representing an assembly of personalized decision trees that address intricate interplays among variables. Indeed, machine learning methods have demonstrated their effectiveness in predicting events with lower incidence rates.25,26
Irrespective of the score used, an individual patient's bleeding risk is based on the interaction of nonmodifiable and modifiable bleeding risks, although focusing solely on modifiable bleeding risk factors as a measure of predicting bleeding risk is an inferior strategy. 1 The bleeding risk factors documented in prior studies (comprising hypertension, low LDL-C, history of hemorrhagic stroke, age) are components of our developed score.27,28 Hypertension exhibits a strong association with ICH, being linked to deep perforating vasculopathy and cerebral amyloid angiopathy.29,30 Prior ICH events were also associated with future bleeding, indicating the presence of a potential bleeding lesion or diathesis. Additionally, VTE, characterized by chronic inflammation or dysfunction, 31 seems to be another contributing factor. PAD was associated with an increased risk of ICH in patients prescribed DOACs, 32 possibly due to decreased vascular endothelial function and increased vascular inflammation. Furthermore, multiple studies consistently indicated an association between reduced LDL-C levels and an elevated risk of hemorrhagic stroke.33–35 We previously also demonstrated that low levels of LDL-C (< 70 mg/dL) were associated with bleeding complication in patients treated with percutaneous coronary intervention (PCI) on high intensity antithrombotic therapy. 36 Previous data-driven bleeding prediction models have included LDL-C or cholesterol as predictive variables,37–40 showing that high cholesterol levels increase the risk of thrombosis, while low cholesterol levels increase the risk of bleeding. More importantly, the 2020 ESC Guideline for the Management of AF has identified low LDL as a modifiable risk factor for ICH. 27 Therefore, for patients at high risk of ICH, clinicians may consider adjusting lipid-lowering therapy to reduce bleeding risk. However, given the benefits of lipid-lowering therapy in improving atherosclerotic cardiovascular disease, we emphasize the need for individualized clinical decision-making after weighing the pros and cons.
From the nomogram, we can see that a history of hemorrhagic stroke is the most significant risk factor. Previous studies have shown that the incidence of ICH in the general population treated with DOAC is ∼1%. 41 However, in high-risk populations, such as those with a history of previous ICH, the incidence of recurrent ICH is ∼5% over 3 years. 42 Therefore, based on the scores corresponding to the predicted probabilities of 1% and 5% in the nomogram, we divided the population into low, medium, and high risk. The results show that this risk stratification can effectively identify individuals at high risk of ICH, providing guidance for clinical decision-making.
Strengths and Limitations
To the best of our knowledge, our model, despite its moderate discrimination, is the first to identify associations of ICH in a large EHR-based real-world cohort of patients initiated on DOAC therapy in China. This prediction derives from a large EHR-based cohort, unlike clinical trials which typically exclude patients with abnormal bleeding score variables, thus providing a comprehensive examination of the scoring performance by overcoming selection bias of the randomized controlled trials. Furthermore, our model assessed the maximum 3-year ICH risk, providing sufficient time for risk factors such as low LDL-C levels to clinically manifest associations. Finally, our model stands out for its integration and screening of multiple approach, ensuring a more robust and reliable prediction tool.
Our study has potential limitations. First, EHR data may contain inconsistencies, missing values, or inaccuracies due to variations in data entry, coding practices, or incomplete records, potentially impacting the model's accuracy. Second, our study only included patients who were newly prescribed OAC during their hospital stay. Although hospitalized patients can provide more comprehensive medical information, this approach may also introduce selection bias due to the exclusion of patients using OAC in an outpatient setting. Third, rivaroxaban accounts for 88% of all types of DOAC used. Therefore, due to the limited sample sizes and number of ICH events in other DOAC groups (only 18 individuals experienced ICH in dabigatran group), we did not have sufficient statistical power to develop predictive models for each individual DOAC type. Future research requires larger and more diverse cohorts to establish robust separate models for each type of DOAC. Finally, the model developed using data from a specific EHR system may not generalize well to other patient populations or healthcare settings, and this requires validation in external cohorts in subsequent studies.
Conclusion
In a real-world Chinese population using DOAC therapy, this study presents a reliable predictive model for ICH risk. The XGBoost model, integrating six key risk factors, offers a valuable tool for individualized risk assessment in the context of oral anticoagulation therapy.
Supplemental Material
sj-docx-1-cat-10.1177_10760296241271338 - Supplemental material for Development and Validation of a Predictive Model for Intracranial Haemorrhage in Patients on Direct Oral Anticoagulants
Supplemental material, sj-docx-1-cat-10.1177_10760296241271338 for Development and Validation of a Predictive Model for Intracranial Haemorrhage in Patients on Direct Oral Anticoagulants by Yuanyuan Liu, Linjie Li, Jingge Li, Hangkuan Liu, Geru A, Yulong Wang, Yongle Li, Ching-Hui Sia, Gregory Y. H. Lip, Qing Yang and Xin Zhou in Clinical and Applied Thrombosis/Hemostasis
Footnotes
Acknowledgements
Not Applicable.
Author Contributions
Yuanyuan Liu: Conceptualization (lead); Writing-original draft (equal). Linjie Li: Conceptualization (equal); Writing-original draft (lead); formal analysis (lead). Jingge Li: Software (lead); Formal analysis (equal). Hangkuan Liu: Methodology (lead); Writing-review and editing (equal). Geru A: Visualization (equal); Yulong Wang, Yongle Li, Ching-Hui Sia, Gregory Y. H. Lip: Writing-review and editing (equal); Qing Yang: Writing-review and editing (lead); Xin Zhou: Supervision (lead); Writing-review and editing (lead).
Data Availability
The data underlying this article were provided by Tianjin Health and Medical Data Platform by permission. Data will be shared on request to the corresponding author with permission.
Declaration of Conflicting Interests
The authors declared no potential conflicts of interest with respect to the research, authorship, and/or publication of this article.
Ethics Approval Statement
The analytic protocol was approved by the Tianjin Medical University General Hospital Ethical Committee (No. IRB2022-YX-235–01).
Funding
The authors disclosed receipt of the following financial support for the research, authorship, and/or publication of this article: This work was supported by the National Natural Science Foundation of China (82321001, 82320108001, 72274133 and 82270349) and Tianjin Key Medical Discipline (Specialty) Construction Project (Grant No. TJYXZDXK-069C).
Patient Consent Statement
To protect the privacy of each patient, all personal information was encrypted and de-identified. Therefore, informed consent for this study was waived.
Supplemental Material
Supplemental material for this article is available online.
References
Supplementary Material
Please find the following supplemental material available below.
For Open Access articles published under a Creative Commons License, all supplemental material carries the same license as the article it is associated with.
For non-Open Access articles published, all supplemental material carries a non-exclusive license, and permission requests for re-use of supplemental material or any part of supplemental material shall be sent directly to the copyright owner as specified in the copyright notice associated with the article.