
Abstract
Background
Aspirin is a widely used antiplatelet medication to prevent blood clots, reducing the risk of cardiovascular event. Healthcare providers need to be mindful of the risk of aspirin-induced bleeding and carefully balancing its benefits against potential risks. The objective of this study was to create a practical nomogram for predicting bleeding risk in patients with a history of myocardial infarction treating with aspirin.
Methods
A total of 2099 myocardial infarction patients with aspirin were enrolled. The patients were randomly divided into two groups, with a 7:3 ratio, for model development and internal validation. Boruta analysis was utilized to identify clinically significant features associated with bleeding. Logistic regression model based on independent bleeding risk factors was constructed and presented as a nomogram. Model performance was assessed from three aspects: identification, calibration, and clinical utility.
Results
Boruta analysis identified eight clinical features from 25, and further multivariate logistic regression analysis selected four independent risk factors: hemoglobin, platelet count, previous bleeding, and sex. A visual nomogram was created based on these variables. The model achieved an area under the curve of 0.888 (95% CI: 0.845-0.931) in the training dataset and 0.888 (95% CI: 0.808-0.968) in the test dataset. Calibration curve analysis showed close approximation to the ideal curve. Decision curve analysis demonstrated favorable clinical net benefit for the model.
Conclusions
Our study focused on creating and validating a model to evaluate bleeding risk in patients with a history of myocardial infarction treated with aspirin, which demonstrated outstanding performance in discrimination, calibration, and net clinical benefit.
Background
Aspirin is widely used to manage and prevent various diseases, especially coronary artery disease. 1 However, its use in myocardial infarction patients presents a challenge as it increases the risk of bleeding. 2 Striking a balance between preventing cardiovascular events and reducing bleeding risks is a significant concern. 3
In individuals without cardiovascular disease, aspirin usage has shown a decreased risk of cardiovascular events but an increased risk of major bleeding. 4 The next challenge in aspirin's role in primary prevention is identifying high-risk individuals who can benefit from using it as a preventive strategy. 5 While there are diverse risk scores available, their performance at an individual level is not perfect despite their success in specific populations. 6 Several bleeding risk scores have been developed to guide treatment selection and duration, offering valuable insights for clinical practice. 7 The ABC-bleeding risk score proves valuable in guiding decisions on the intensity and duration of combination antithrombotic therapy for patients with atrial fibrillation and coronary artery disease. 8 This bleeding score effectively stratifies bleeding and ischemic risk among diverse study populations, consistently providing a stratification of benefit-risk differences. 9 European guidelines emphasize a personalized approach to balance bleeding and ischemic risks instead of a generalized aspirin use strategy. 10 While PARIS and PRECISE scores are primarily recommended by American and European guidelines, they face limitations due to variability in patient cohorts.11,12 Recent advancements have introduced new clinical models to enhance the prediction of hemorrhagic events. These models incorporate widely used scoring systems like CHA2DS2-VASC score, 13 CRUSADE, 14 ACUITY-HORIZONS, 15 ARC-HBR, 16 BleeMACS, 17 GRACE score, 14 TIMI risk score, 18 and HAS-Bled score. 19 These scores assess a range of clinical characteristics, such as coronary anatomy, surgical procedures, genotyping, lifestyle factors, and treatment adherence. 20 With the existence of multiple bleeding risk scores, there is a pressing need for a precise clinical model that can tailor aspirin type and duration to minimize ischemic risk while avoiding an elevated risk of bleeding. Each score has its own merits and limitations based on the patient cohorts utilized for development and validation, making them suitable for specific patients, clinical contexts, and timeframes. 20 Finding the right balance between risks and benefits is a persistent challenge for clinicians, particularly in managing bleeding risk among myocardial infarction patients. Additional research is needed to establish the correlation between bleeding events and the use of bleeding risk scores.
The objective of this study was to create novel bleeding risk scores specifically for myocardial infarction patients using aspirin and evaluate their clinical predictive performance.
Methods
Aim and Design
The objective of this study was to create a practical nomogram for predicting bleeding risk in patients with a history of myocardial infarction treating with aspirin by case-control study.
Study Population
The study participants were selected from the Affiliated Dongyang Hospital of Wenzhou Medical University. Inclusion criteria included myocardial infarction patients with recorded aspirin usage in electronic medical records (EMRs) from January 2008 to December 2017. Exclusion criteria: individuals under 18 years old, with missing aspirin data. The study received ethical approval from the Ethics Committee of Affiliated Dongyang Hospital of Wenzhou Medical University (approval #2023-YX-408), and informed consent was waived. Before analysis, all patient medical data were anonymized and de-identified.
Outcome Definition
The study analyzed hospital EMRs discharge records to determine the occurrence of recorded bleeding events, including cerebral hemorrhage, gastrointestinal bleeding, mucosal bleeding, or other common types of bleeding, within 5 years following aspirin administration. When there is bleeding in the discharge diagnosis record of the EMR, we consider it as bleeding. Bleeding events were categorized as positive, while the absence of bleeding was classified as negative in this study.
Risk Factors
We gathered the following information from hospital EMRs for the subjects: sex, age, height, weight, body mass index (BMI), and past medical history including smoking, drinking, tumors (a record in the electronic medical database indicates tumor or cancer as part of the discharge diagnosis), diabetes, hypertension, surgical history (a record in the electronic medical database indicates surgical or operation as part of the discharge diagnosis), percutaneous coronary interventions (PCIs), previous bleeding events, cerebral infarction, use of gastric protective medicine (GPM), gastric ulcers, anticoagulant usage, portal hypertension, and various clinical test indicators such as white blood cell count (WBC), platelet count (PLT), peripheral hemoglobin (HGB), glomerular filtration rate (GFR), and cardiac ejection fraction (EF). The recorded values considered were the lowest within 1 month prior to starting aspirin. Other past medical histories were documented if they occurred before the initiation of aspirin.
Data pre-Processing
The clinical research big data underwent rigorous cleaning, including removal of outliers and imputation of missing values. Indicators with missing values over 20%, such as height, weight, BMI, EF, and GFR, were excluded from the analysis. Multiple imputation techniques were used for handling missing predictor values. 21 The data was divided into a training set (70% of the data) and a testing set (remaining portion) for model training and evaluation. The classification model was trained using the training set, and its performance was assessed using the testing set.
Model Building
The Boruta analysis was employed to identify clinically significant features related to bleeding. 22 On the right side of ShadowMax, eight indicators were recognized as important parameters influencing bleeding. These eight significant features underwent stepwise backward multivariate logistic regression analysis. Based on the independent bleeding risk factors, a logistic regression model was developed and presented as a nomogram.
Model Evaluation
The model's discriminatory performance was evaluated using sensitivity, specificity, and the area under the curve (AUC) of the ROC. Calibration was assessed through calibration curves. The effectiveness of the identified risk factors in predicting bleeding risk was verified using decision curve analysis (DCA), clinical impact curve (CIC), and net reduction curve (NRC). Additionally, the model was validated by comparing it to individual indicators in terms of discrimination. For a visual depiction of the model construction and validation process, refer to Figure 1 in the flowchart.
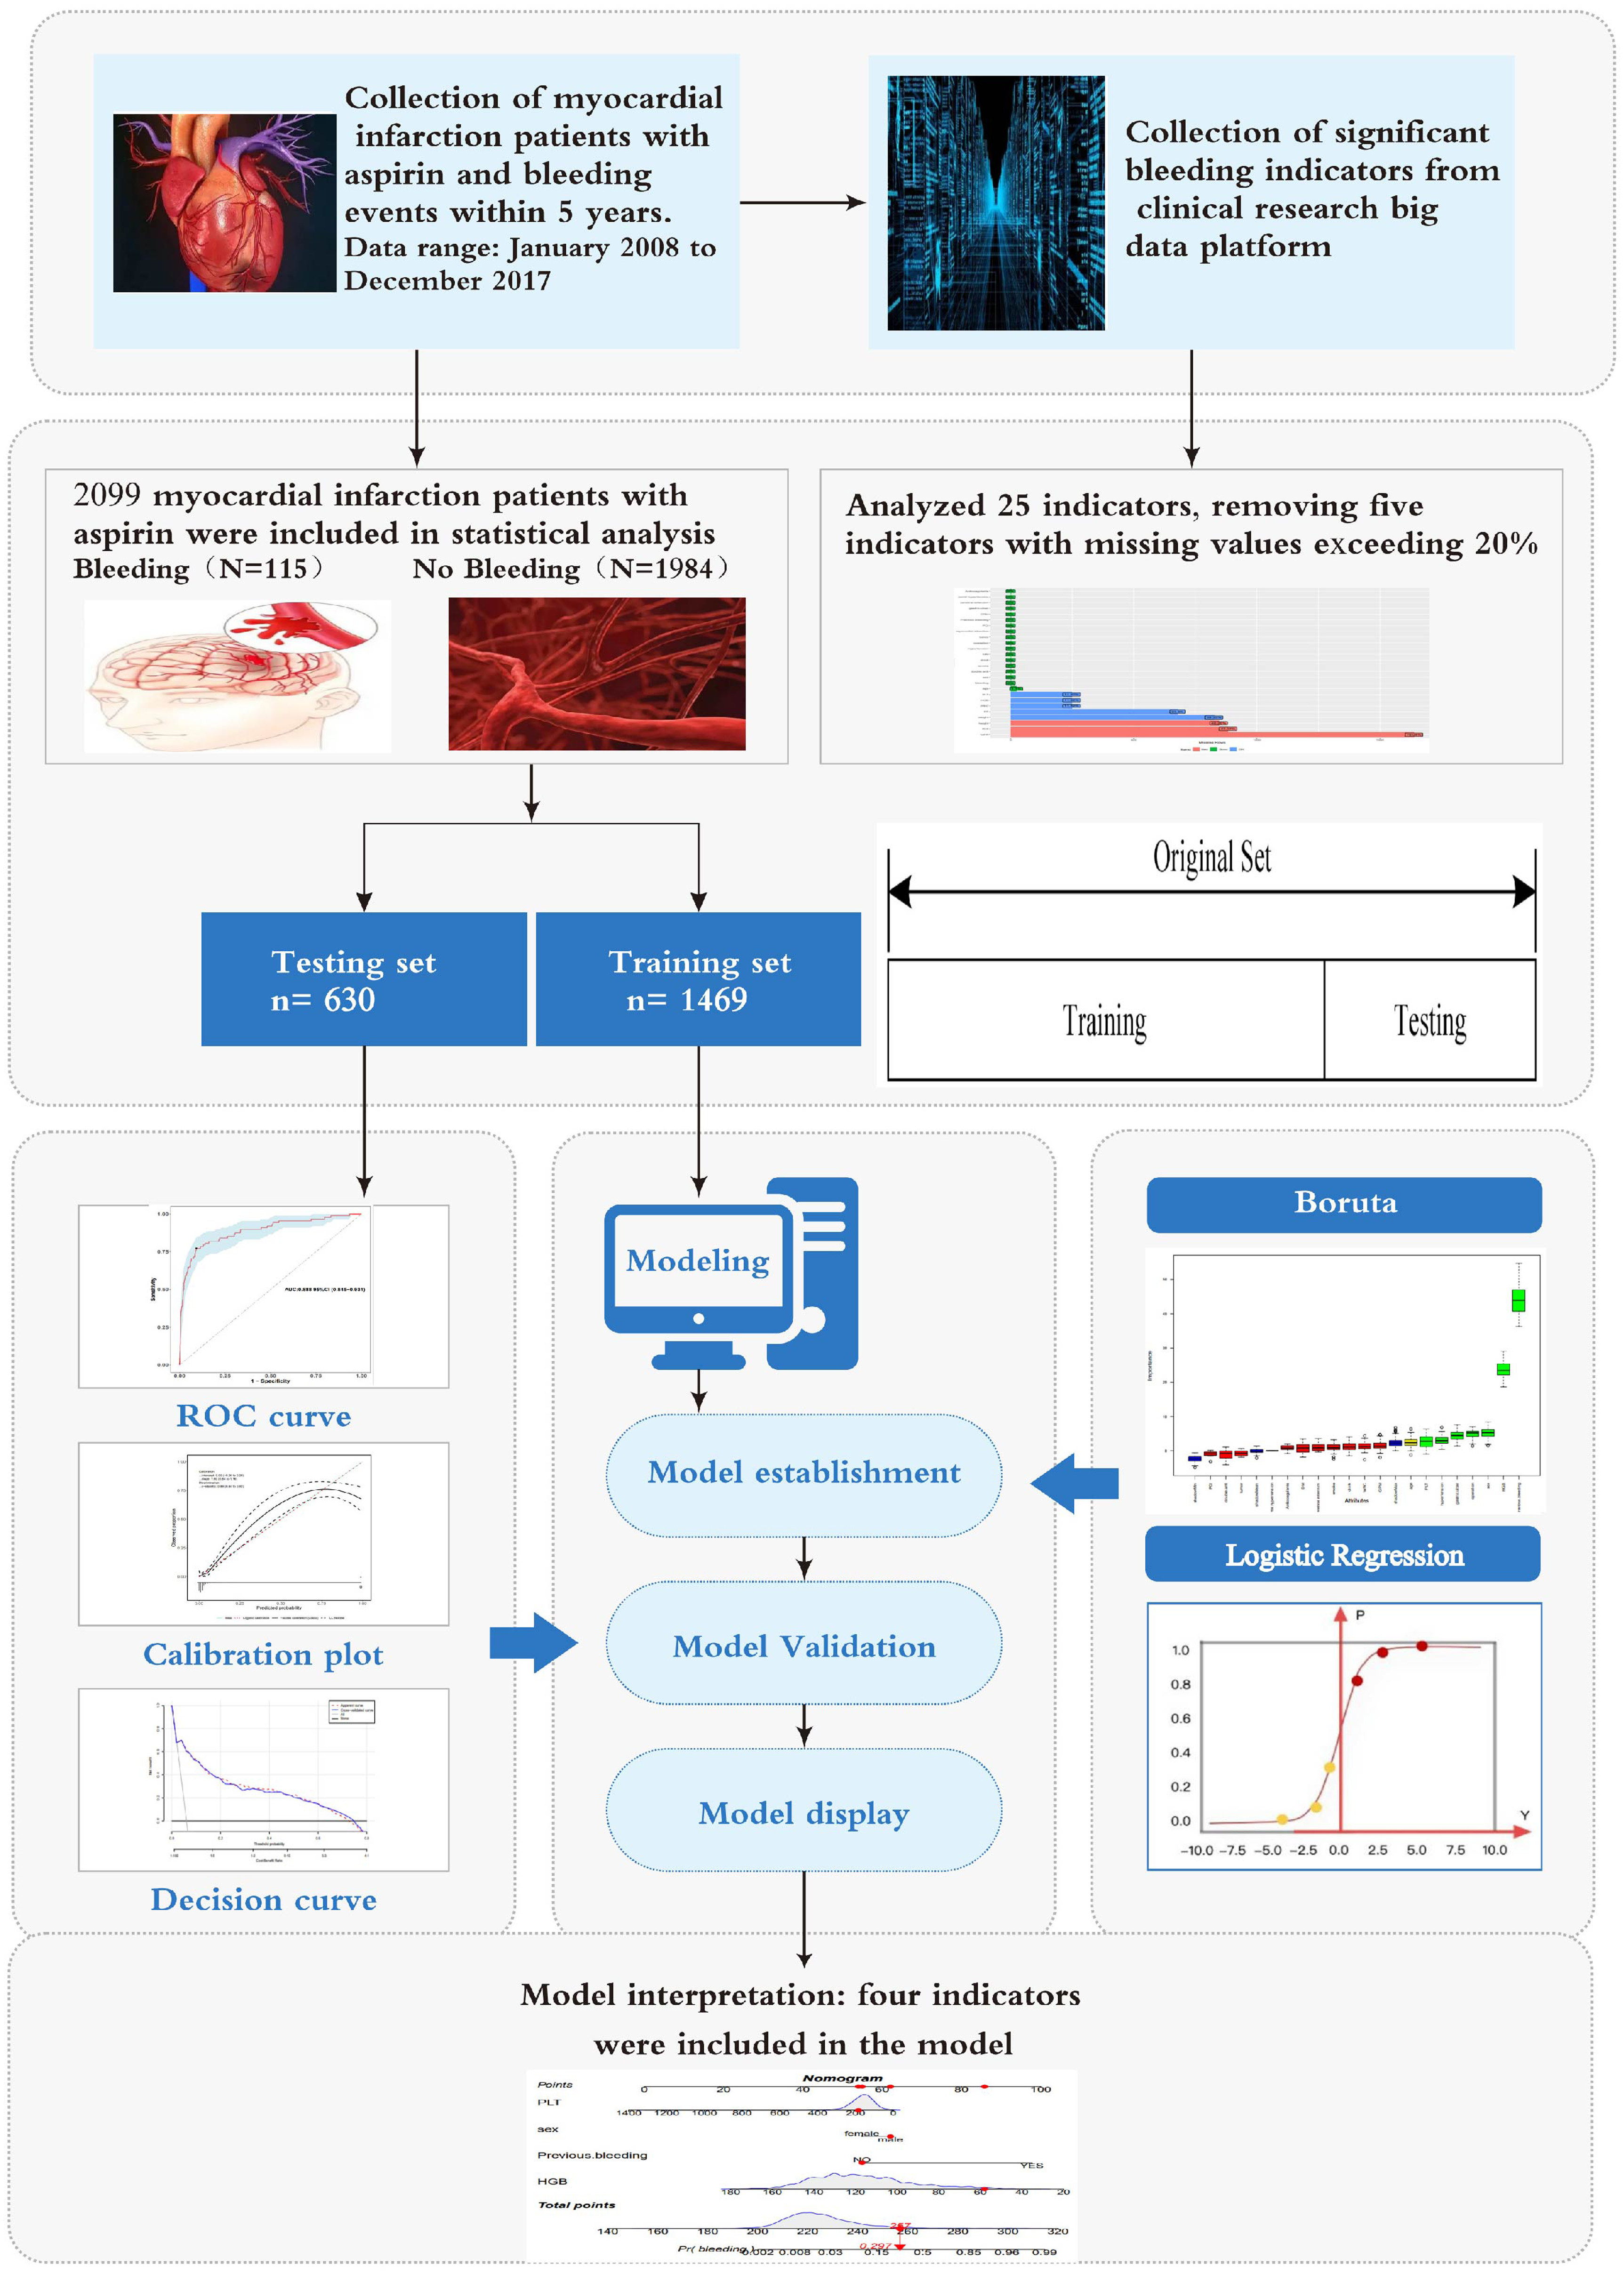
Study process flowchart.
Statistical Methods
Statistical analysis and data visualization were conducted using R4.2.1 software on Windows. Continuous variables were presented as means with standard deviations or medians with interquartile ranges, compared using Student's t-test or Mann-Whitney U test. Categorical variables were expressed as frequencies with percentages and compared using χ² test or Fisher's exact test. Multiple imputation techniques were implemented using the “mice” package. Baseline description and differences analysis utilized the “comparegroups” package, Boruta analysis utilized the “Boruta” package, and multivariable logistic regression used the “glm” package. The nomogram was created with the “regplot” package. Discrimination analysis involved the “pROC,” “ggROC,” and “fbroc” packages. Calibration assessment was performed with the “rms” and “riskregression” packages. DCA and CIC were carried out using the “rmda,” “dca.R,” and “dcurves” packages. Diagnostic evaluation utilized the “reportROC” package. All statistical tests were two-sided, and a significance level of P < 0.05 was considered statistically significant.
Results
Study Population Characteristics
This study included 2099 patients with a history of myocardial infarction treating with aspirin, among whom 115 experienced bleeding events. Among the 25 variables examined, WBC, HGB, PLT, height, weight, BMI, EF, and GFR were continuous variables. Variables with missing information in over 20% of patients (height, weight, BMI, EF, and GFR) were excluded, resulting in 20 variables with less than 20% missing data (detailed in Appendix 1). No significant differences were observed between cohorts with and without bleeding regarding sex, dual antiplatelet therapy, smoking, drinking, diabetes, tumor, PCI, portal hypertension, and anticoagulant usage. However, significant differences were evident between the cohorts with and without bleeding in terms of hypertension, operation, previous bleeding, WBC, HGB, PLT, GPM, gastric ulcer, and cerebral infarction. Table 1 presents the baseline characteristics of patients with a history of myocardial infarction treating with aspirin. A random 7:3 division allocated patients to the training set (n = 1469) and the testing set (n = 630). Table 2 shows the baseline characteristics of patients in both sets, indicating no significant differences for each indicator between the two cohorts.
Baseline Characteristics of Subjects.
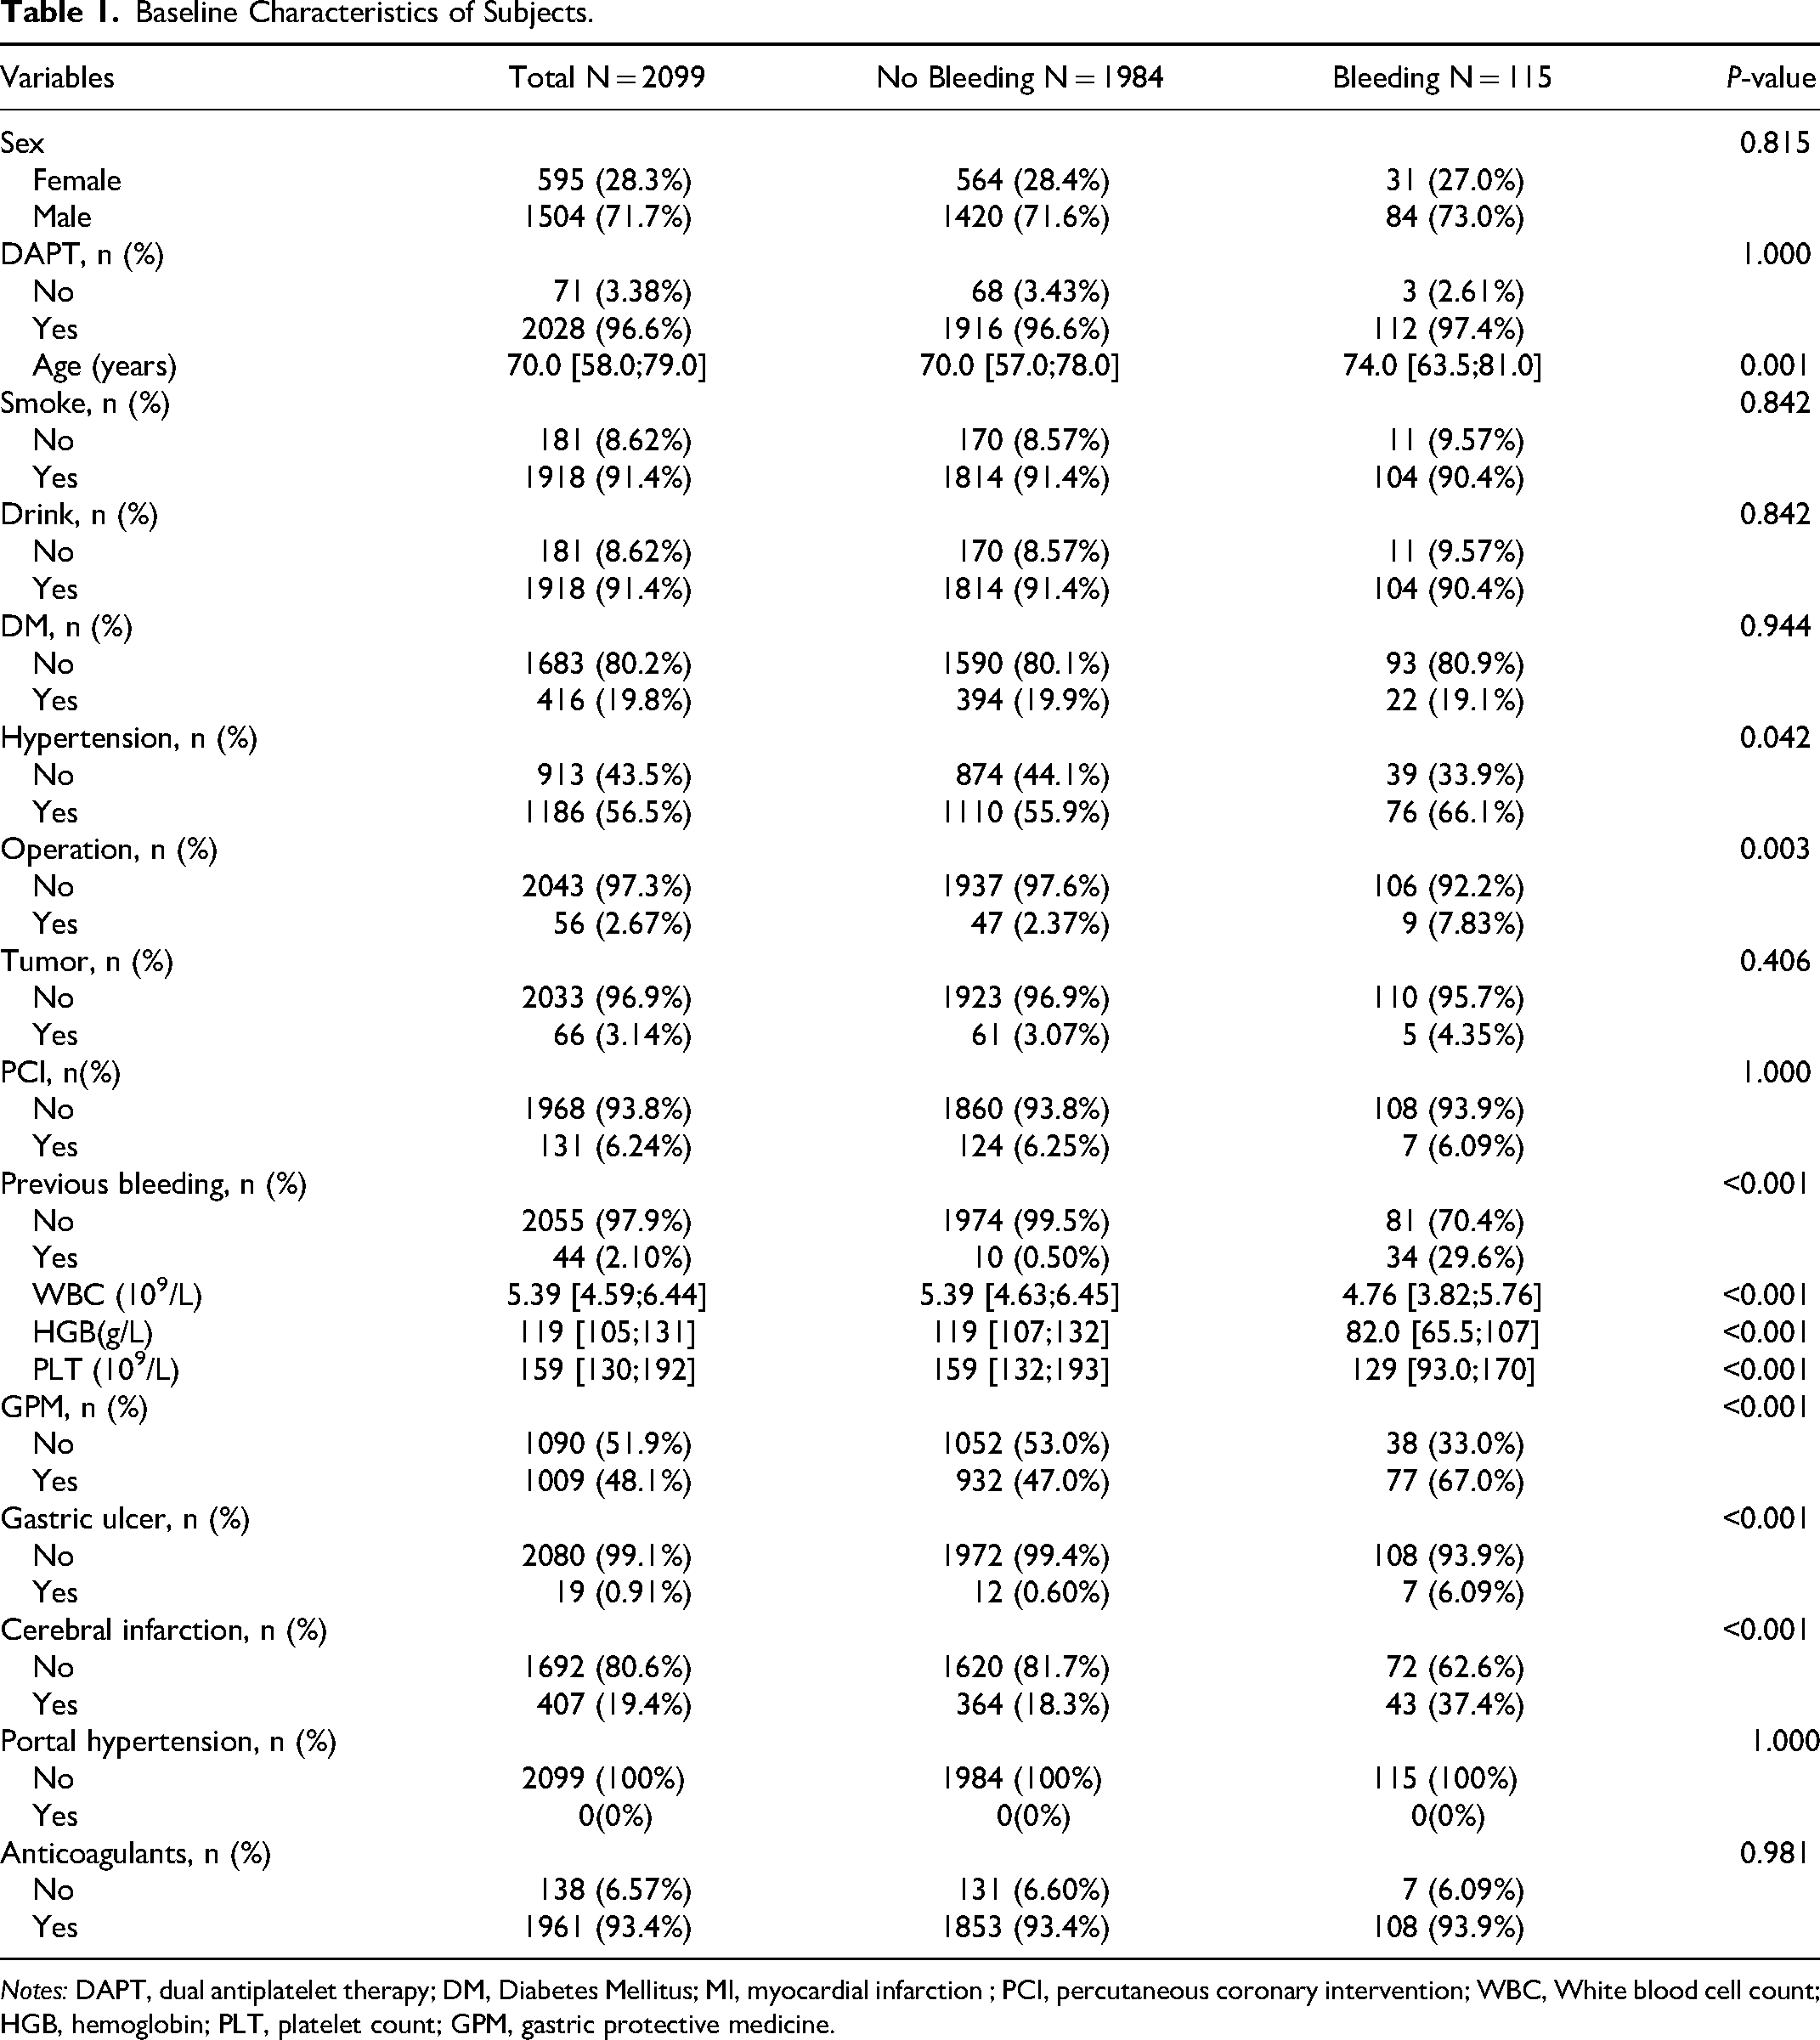
Notes: DAPT, dual antiplatelet therapy; DM, Diabetes Mellitus; MI, myocardial infarction ; PCI, percutaneous coronary intervention; WBC, White blood cell count; HGB, hemoglobin; PLT, platelet count; GPM, gastric protective medicine.
The Baseline Characteristics of the Training and Testing set.

Notes: DAPT, dual antiplatelet therapy; DM, Diabetes Mellitus; MI, myocardial infarction; PCI, percutaneous coronary intervention; WBC, white blood cell count; HGB, hemoglobin; PLT, platelet count; GPM, gastric protective medicine.
Selected Predictors and Construction Model
Using Boruta analysis (Figure 2), we identified eight important variables (age, PLT, hypertension, gastric ulcers, operation, sex, HGB, and previous bleeding) for inclusion in the model. These variables were used in multivariate logistic regression modeling, and after the “backward” process, four variables remained in the final models. A nomogram model was constructed based on these four variables: HGB, PLT, previous bleeding, and sex (Table 3). In the training cohort, our model achieved a sensitivity of 77.3%, specificity of 90.7%, positive predictive value of 34.5%, and negative predictive value of 98.4%.
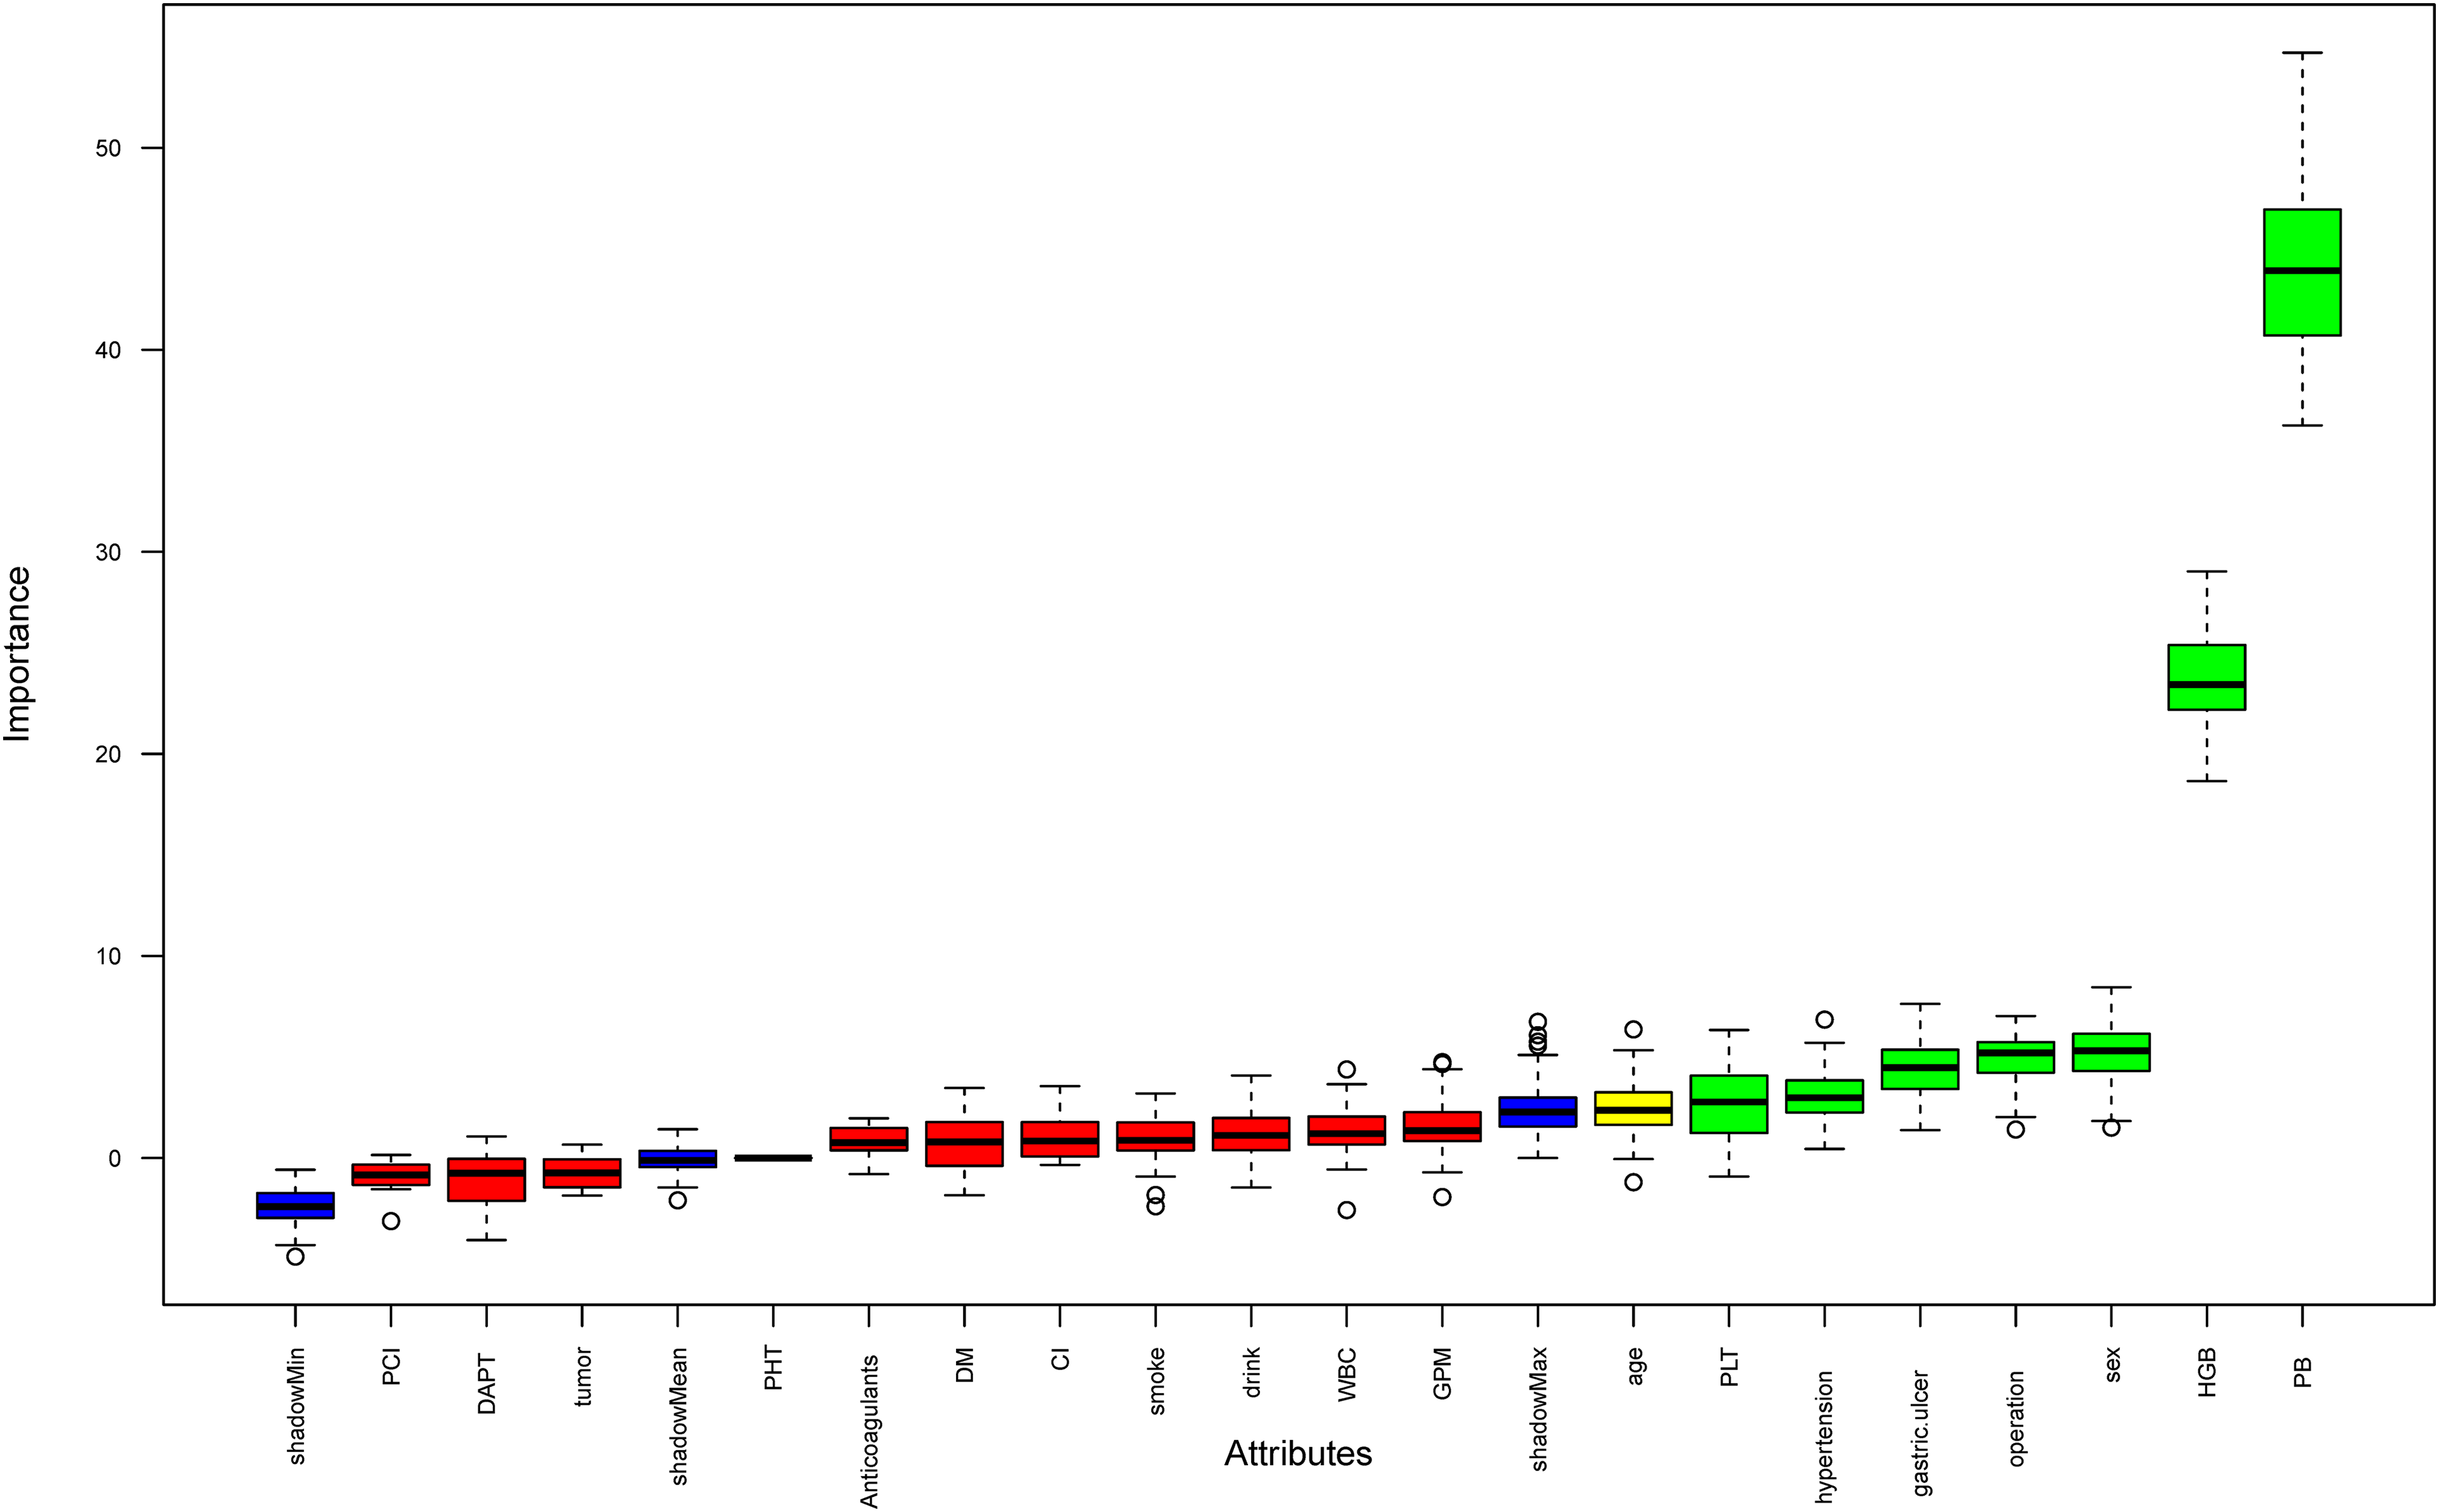
Variable selection was conducted using Boruta analysis. On the right side of ShadowMax, eight indicators were recognized as important parameters influencing bleeding. Notes: PCI, percutaneous coronary intervention; DAPT, dual antiplatelet therapy; PHT, portal hypertension; DM, Diabetes Mellitus; CI, cerebral infarction; WBC, white blood cell count; GPM, gastric protective medicine; PLT, platelet count; HGB, hemoglobin; PB, previous bleeding.
Final Model Coefficients.
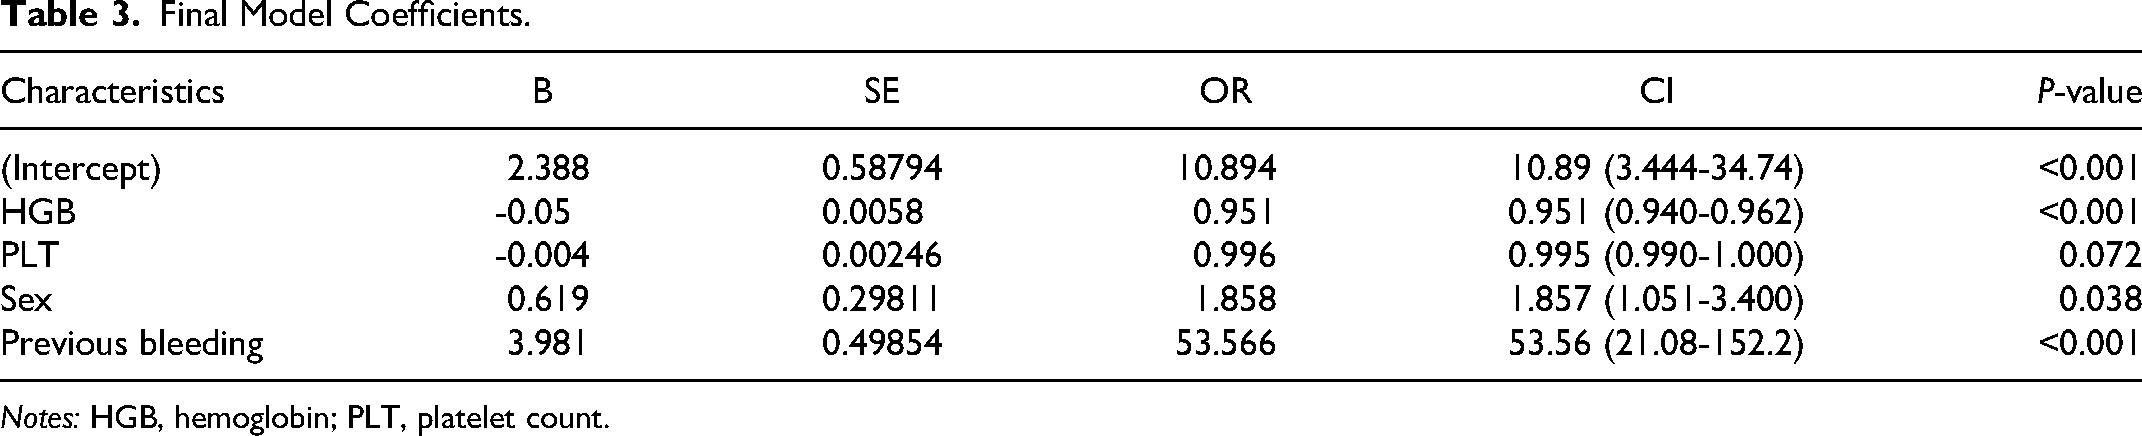
Notes: HGB, hemoglobin; PLT, platelet count.
Model Visualization
The nomogram in Figure 3 visually predicts bleeding risk in patients with a history of myocardial infarction treating with aspirin. Each risk factor's value corresponds to a specific number of points along the vertical lines. Total points are obtained by summing up points from all risk factors. To determine bleeding prediction for a specific myocardial infarction patient, a vertical line is drawn from the total points axis, intersecting with the corresponding probability on the nomogram. For instance, if a male myocardial infarction patient has no previous bleeding, a PLTs of 200 × 109/L, and an HGB level of 55 g/L, the total score would be 257. Drawing a vertical line from the total score intersects the probability axis at approximately 0.297, indicating an estimated bleeding probability of 29.7% (Figure 3).
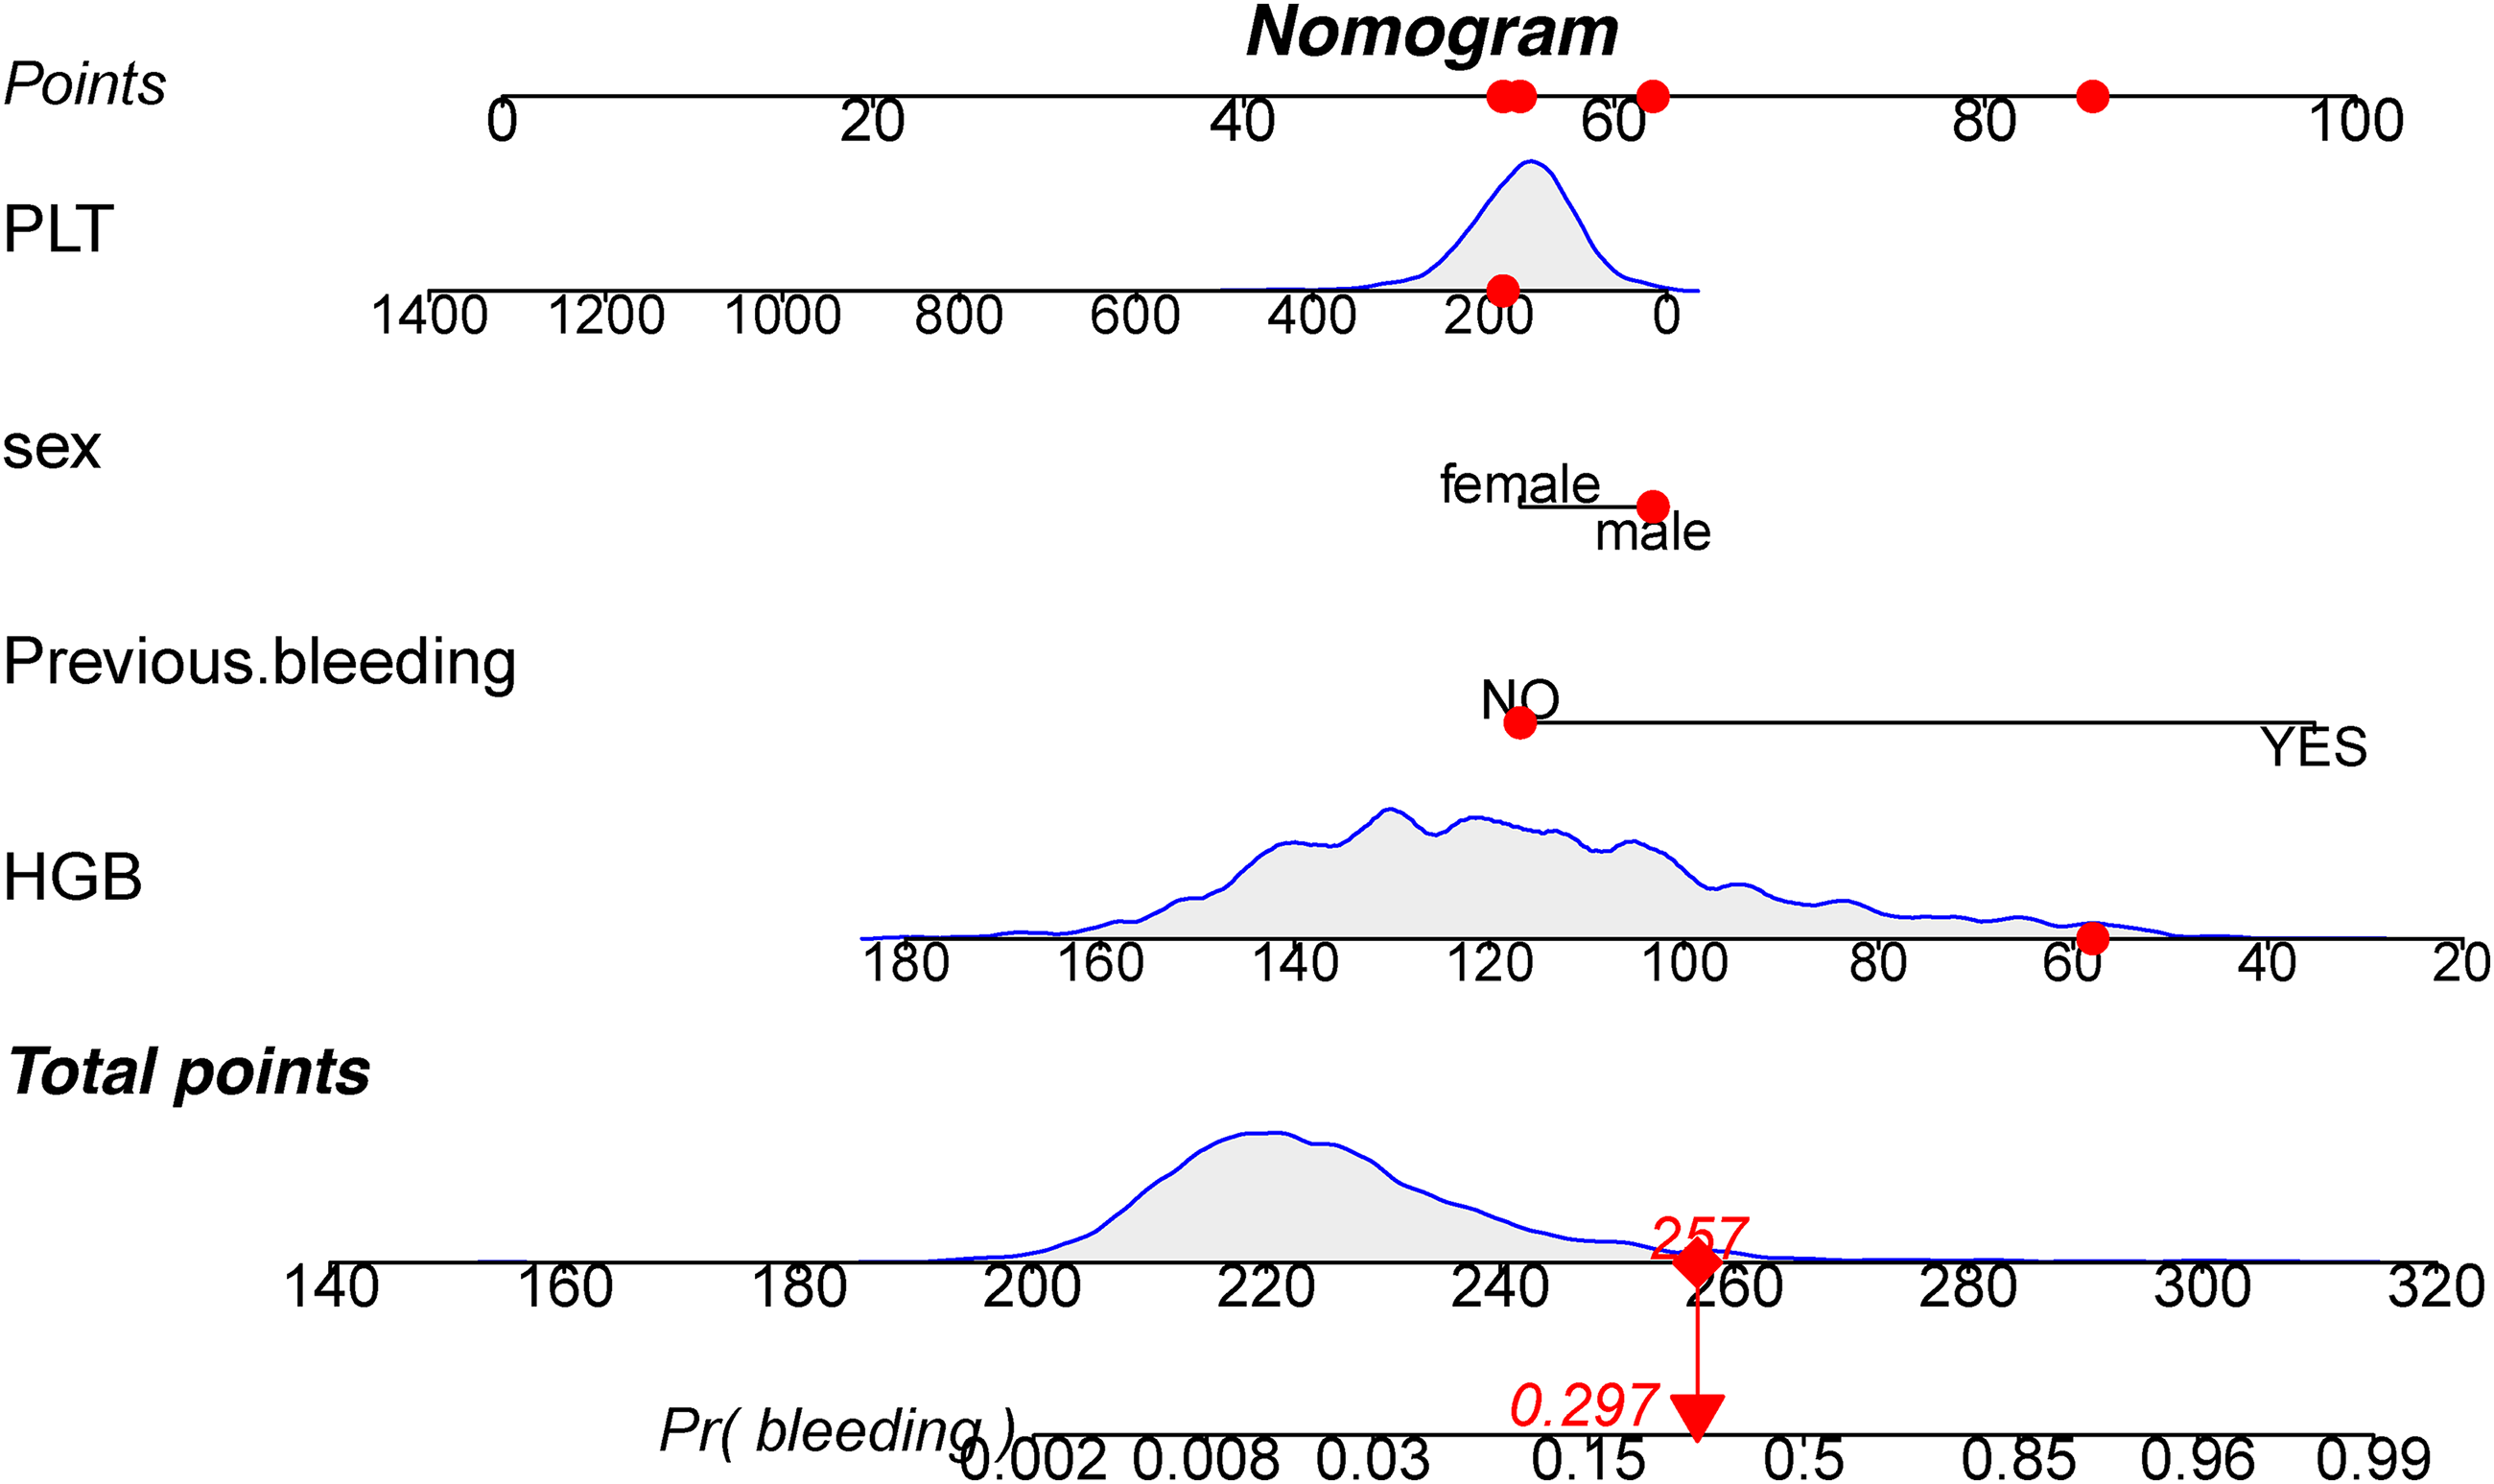
Development of a nomogram based on logistic regression analysis using a combination of four indicators. A total score of 257 corresponds to a bleeding probability of 0.297 (highlighted in red). HGB: hemoglobin; PLT: platelet count.
Model Validation
Model discrimination was assessed using the AUC of the ROC curve. In Figure 4a, the training dataset showed an AUC of 0.888 (95% CI: 0.845-0.931), while in Figure 4b, the testing dataset exhibited an AUC of 0.888 (95% CI: 0.808-0.968). Calibration curves in Figure 4c and d demonstrated excellent agreement between predicted bleeding probability and actual observations in both the training and testing sets. The Hosmer and Lemeshow goodness of fit test also indicated good consistency. Figure 5 displayed DCA, CIC, and NRC results for the developed model. DCA confirmed a favorable net benefit in predicting bleeding risk in myocardial infarction patients. The threshold probability ranged from 3.0 to 78% in the training dataset (Figure 5a) and 2.0 to 79% in the testing dataset (Figure 5b). Lower risk thresholds corresponded to higher net benefits. However, CIC analysis revealed that decreasing the risk threshold increased false positive rates and unnecessary interventions (Figure 5c, d). Therefore, considering both DCA and CIC results is crucial for making optimal decisions, striking a balance between high net benefit and low false positive rate. NRC plots in Figure 5e and f demonstrated a good fit for the model in both the training and testing sets.
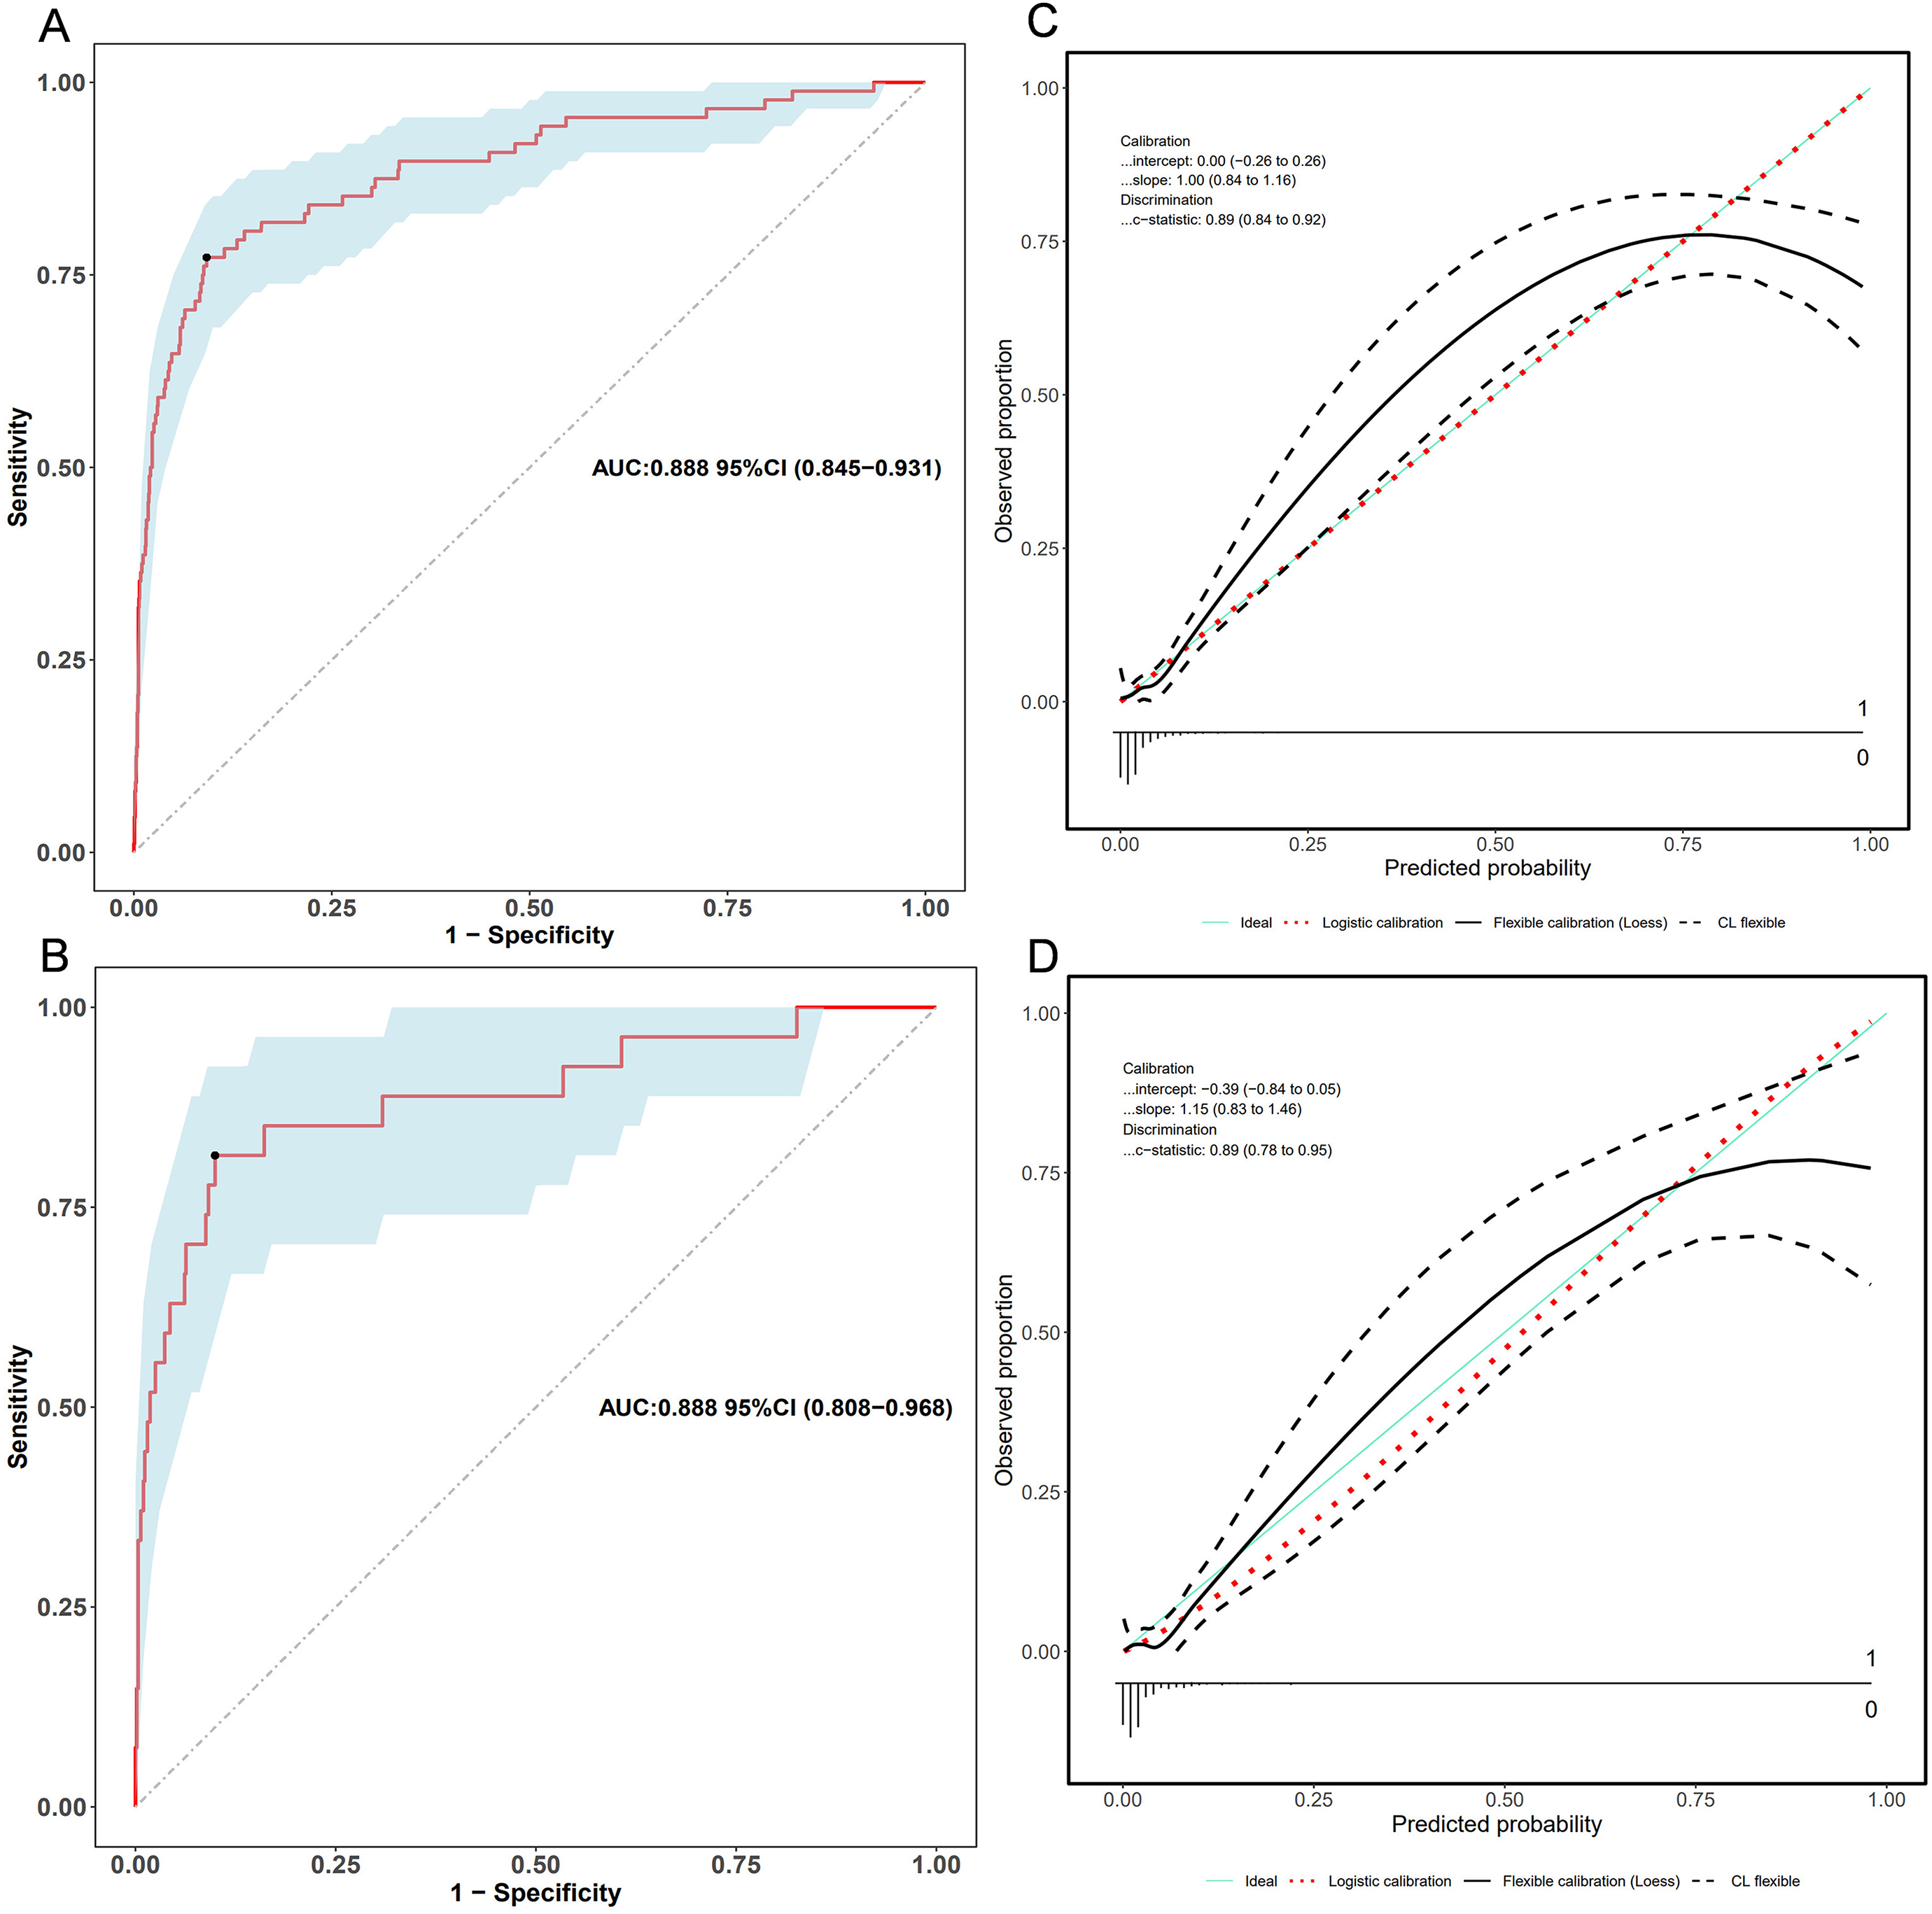
ROC and calibration curves of the nomogram. (a) ROC curves in the training set and (b) in the validation set. (c) Calibration curves in the training set and (d) in the validation set. Calibration curves illustrate the correspondence between predicted bleeding risk (x-axis) and actual diagnosed cases (y-axis). The blue diagonal dotted line represents perfect predictions by an ideal model. The red dashed line represents the performance of the training set and validation set. A closer alignment between the red dashed line and diagonal dotted lines suggests better prediction performance.
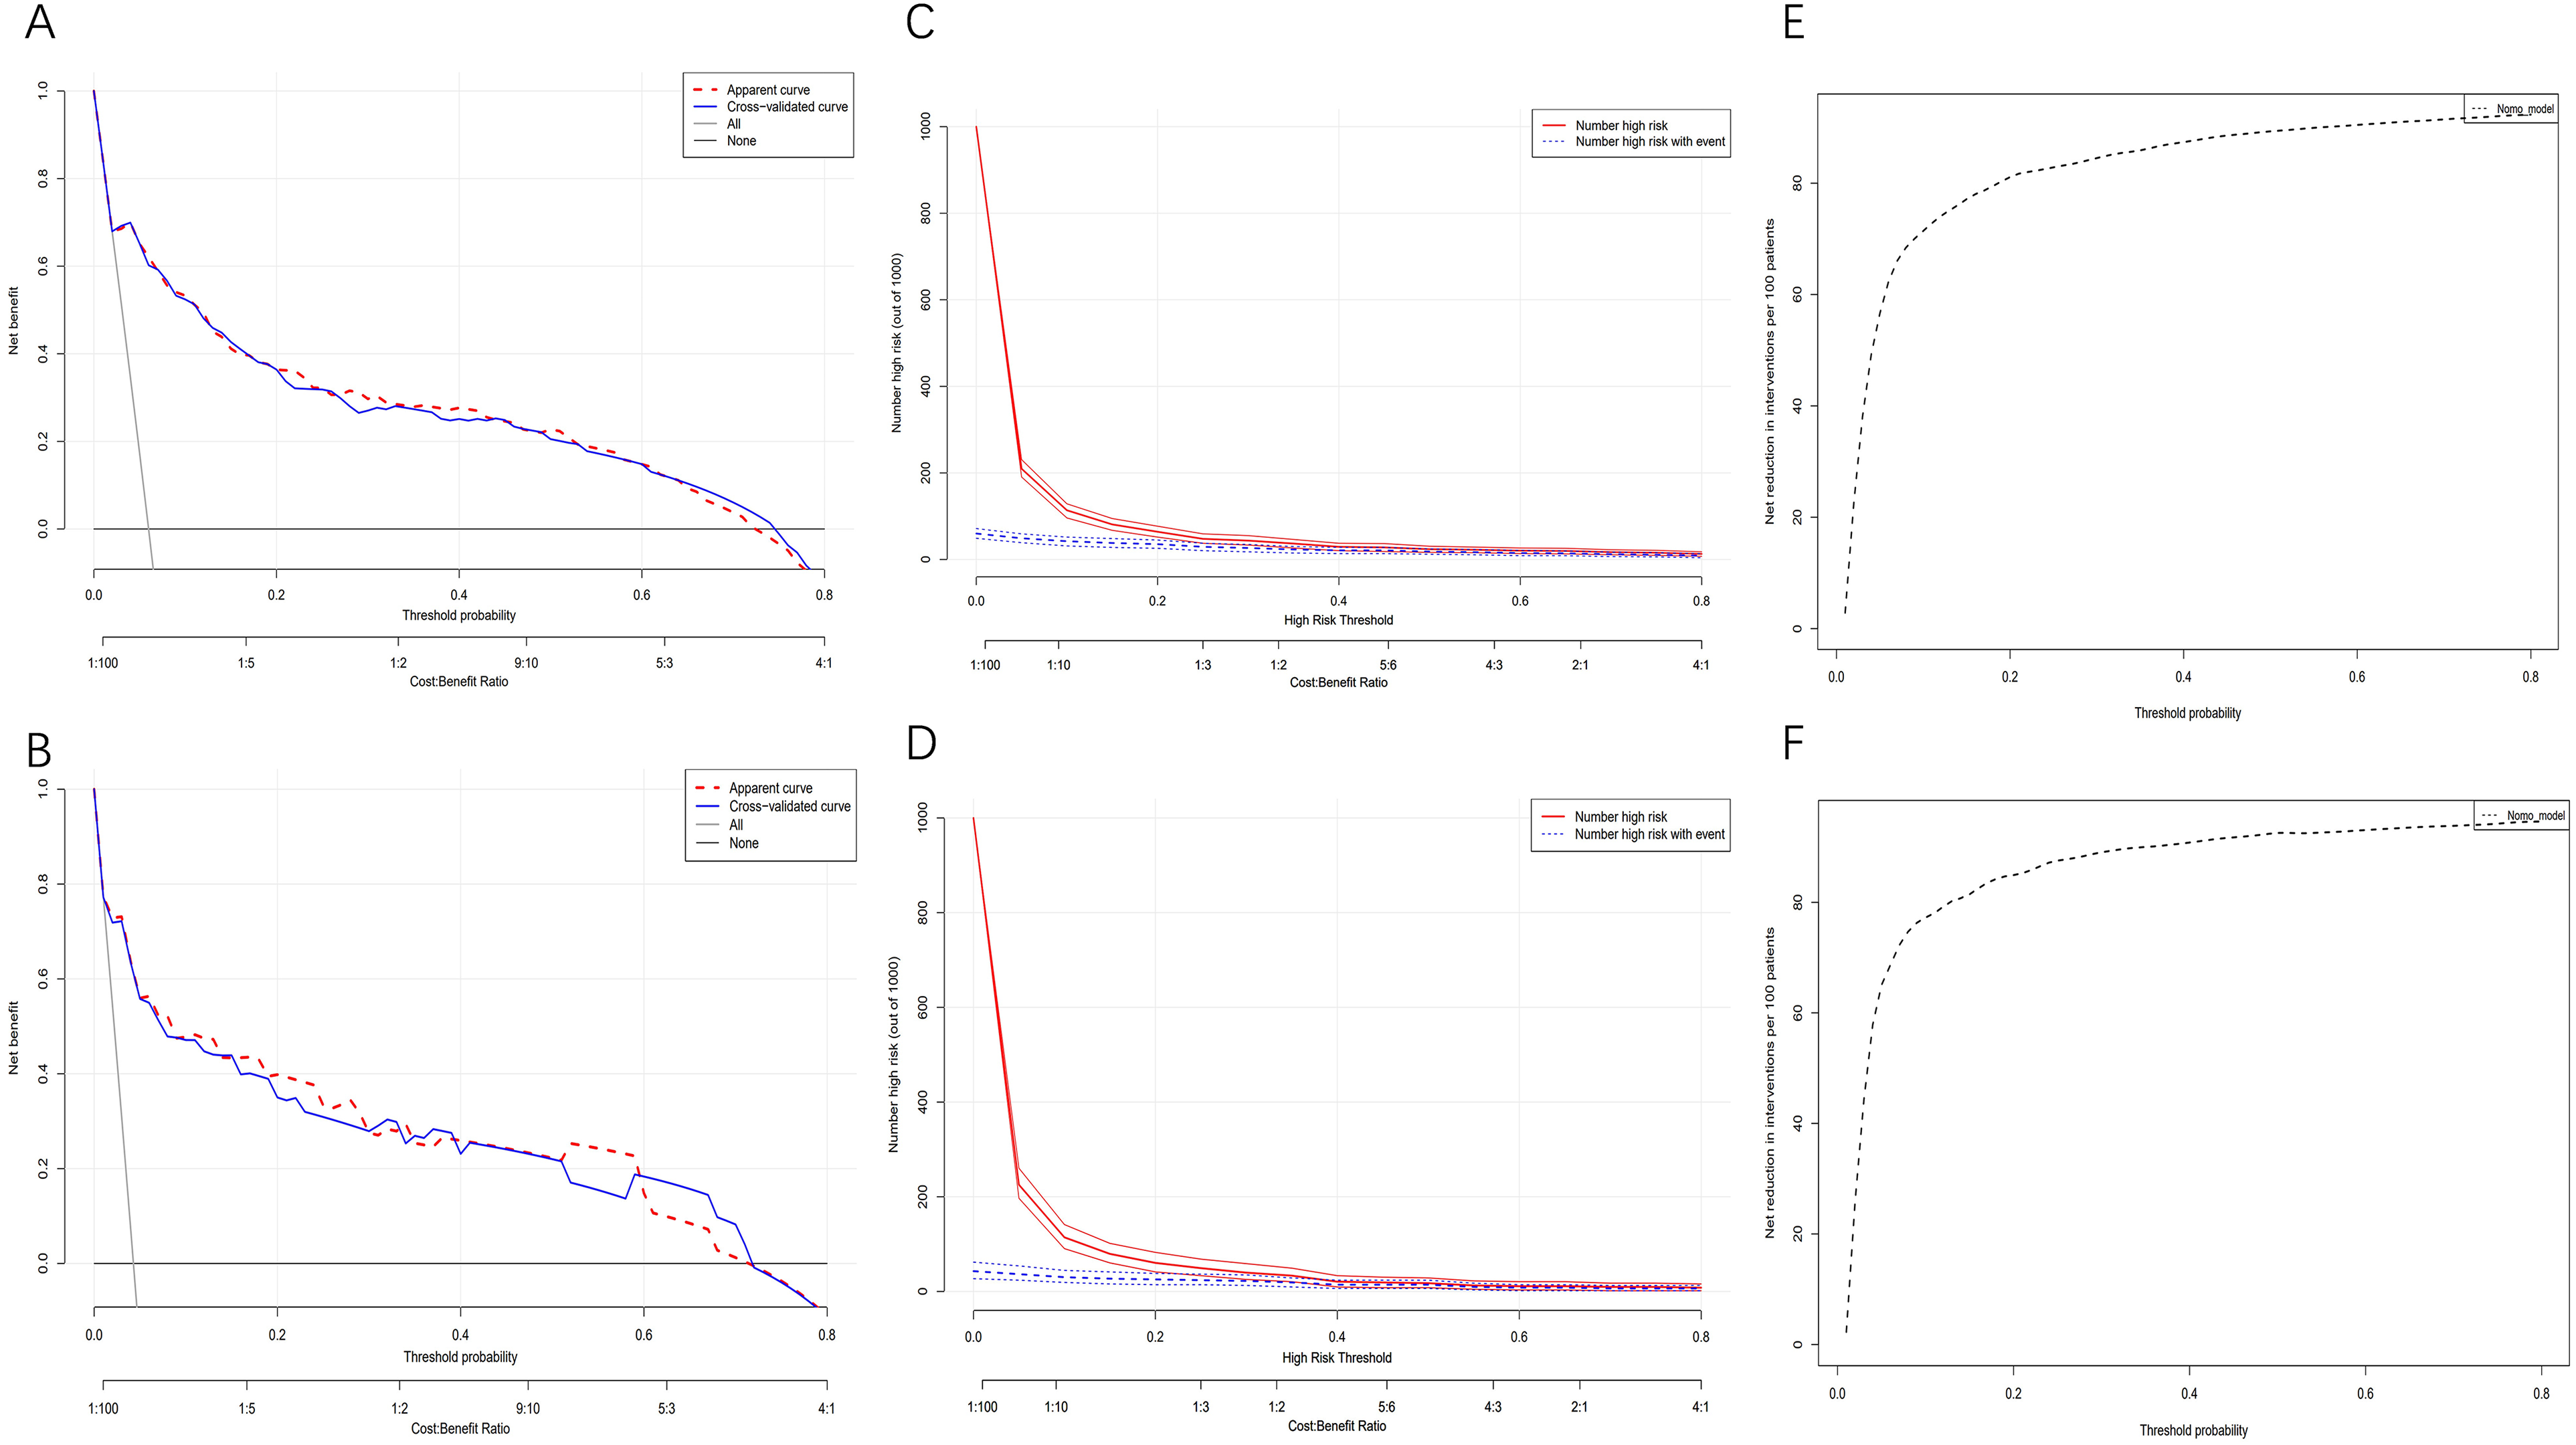
Decision curve analysis (DCA), clinical impact curves (CICs), and the net reduction curves (NRCs) of the nomogram. (a) DCA in the training set; (b) DCA in the validation set; (c) CIC in the training set; (d) CIC in the validation set; (e) NRC in the training set; (f) NRC in the validation set. In DCAs, the y-axis represents net benefit. The horizontal lines “None” and “All” assume no or all participants had bleeding, respectively. Our predictive model is represented by the red line. In CICs, the red curve indicates the number of individuals classified as high risk by the model at different threshold probabilities, while the blue curve shows the number of true positives (individuals with the outcome). NRCs represent the number of patients that could be reduced under the same effect size using a specific threshold probability of diagnosis, indicated on the x-axis.
Model Compare with Single Indicator
We conducted a comparison between our constructed model (nomogram) and a single indicator in terms of discriminative ability. Figure 6 clearly demonstrates that our model outperforms the single indicator.
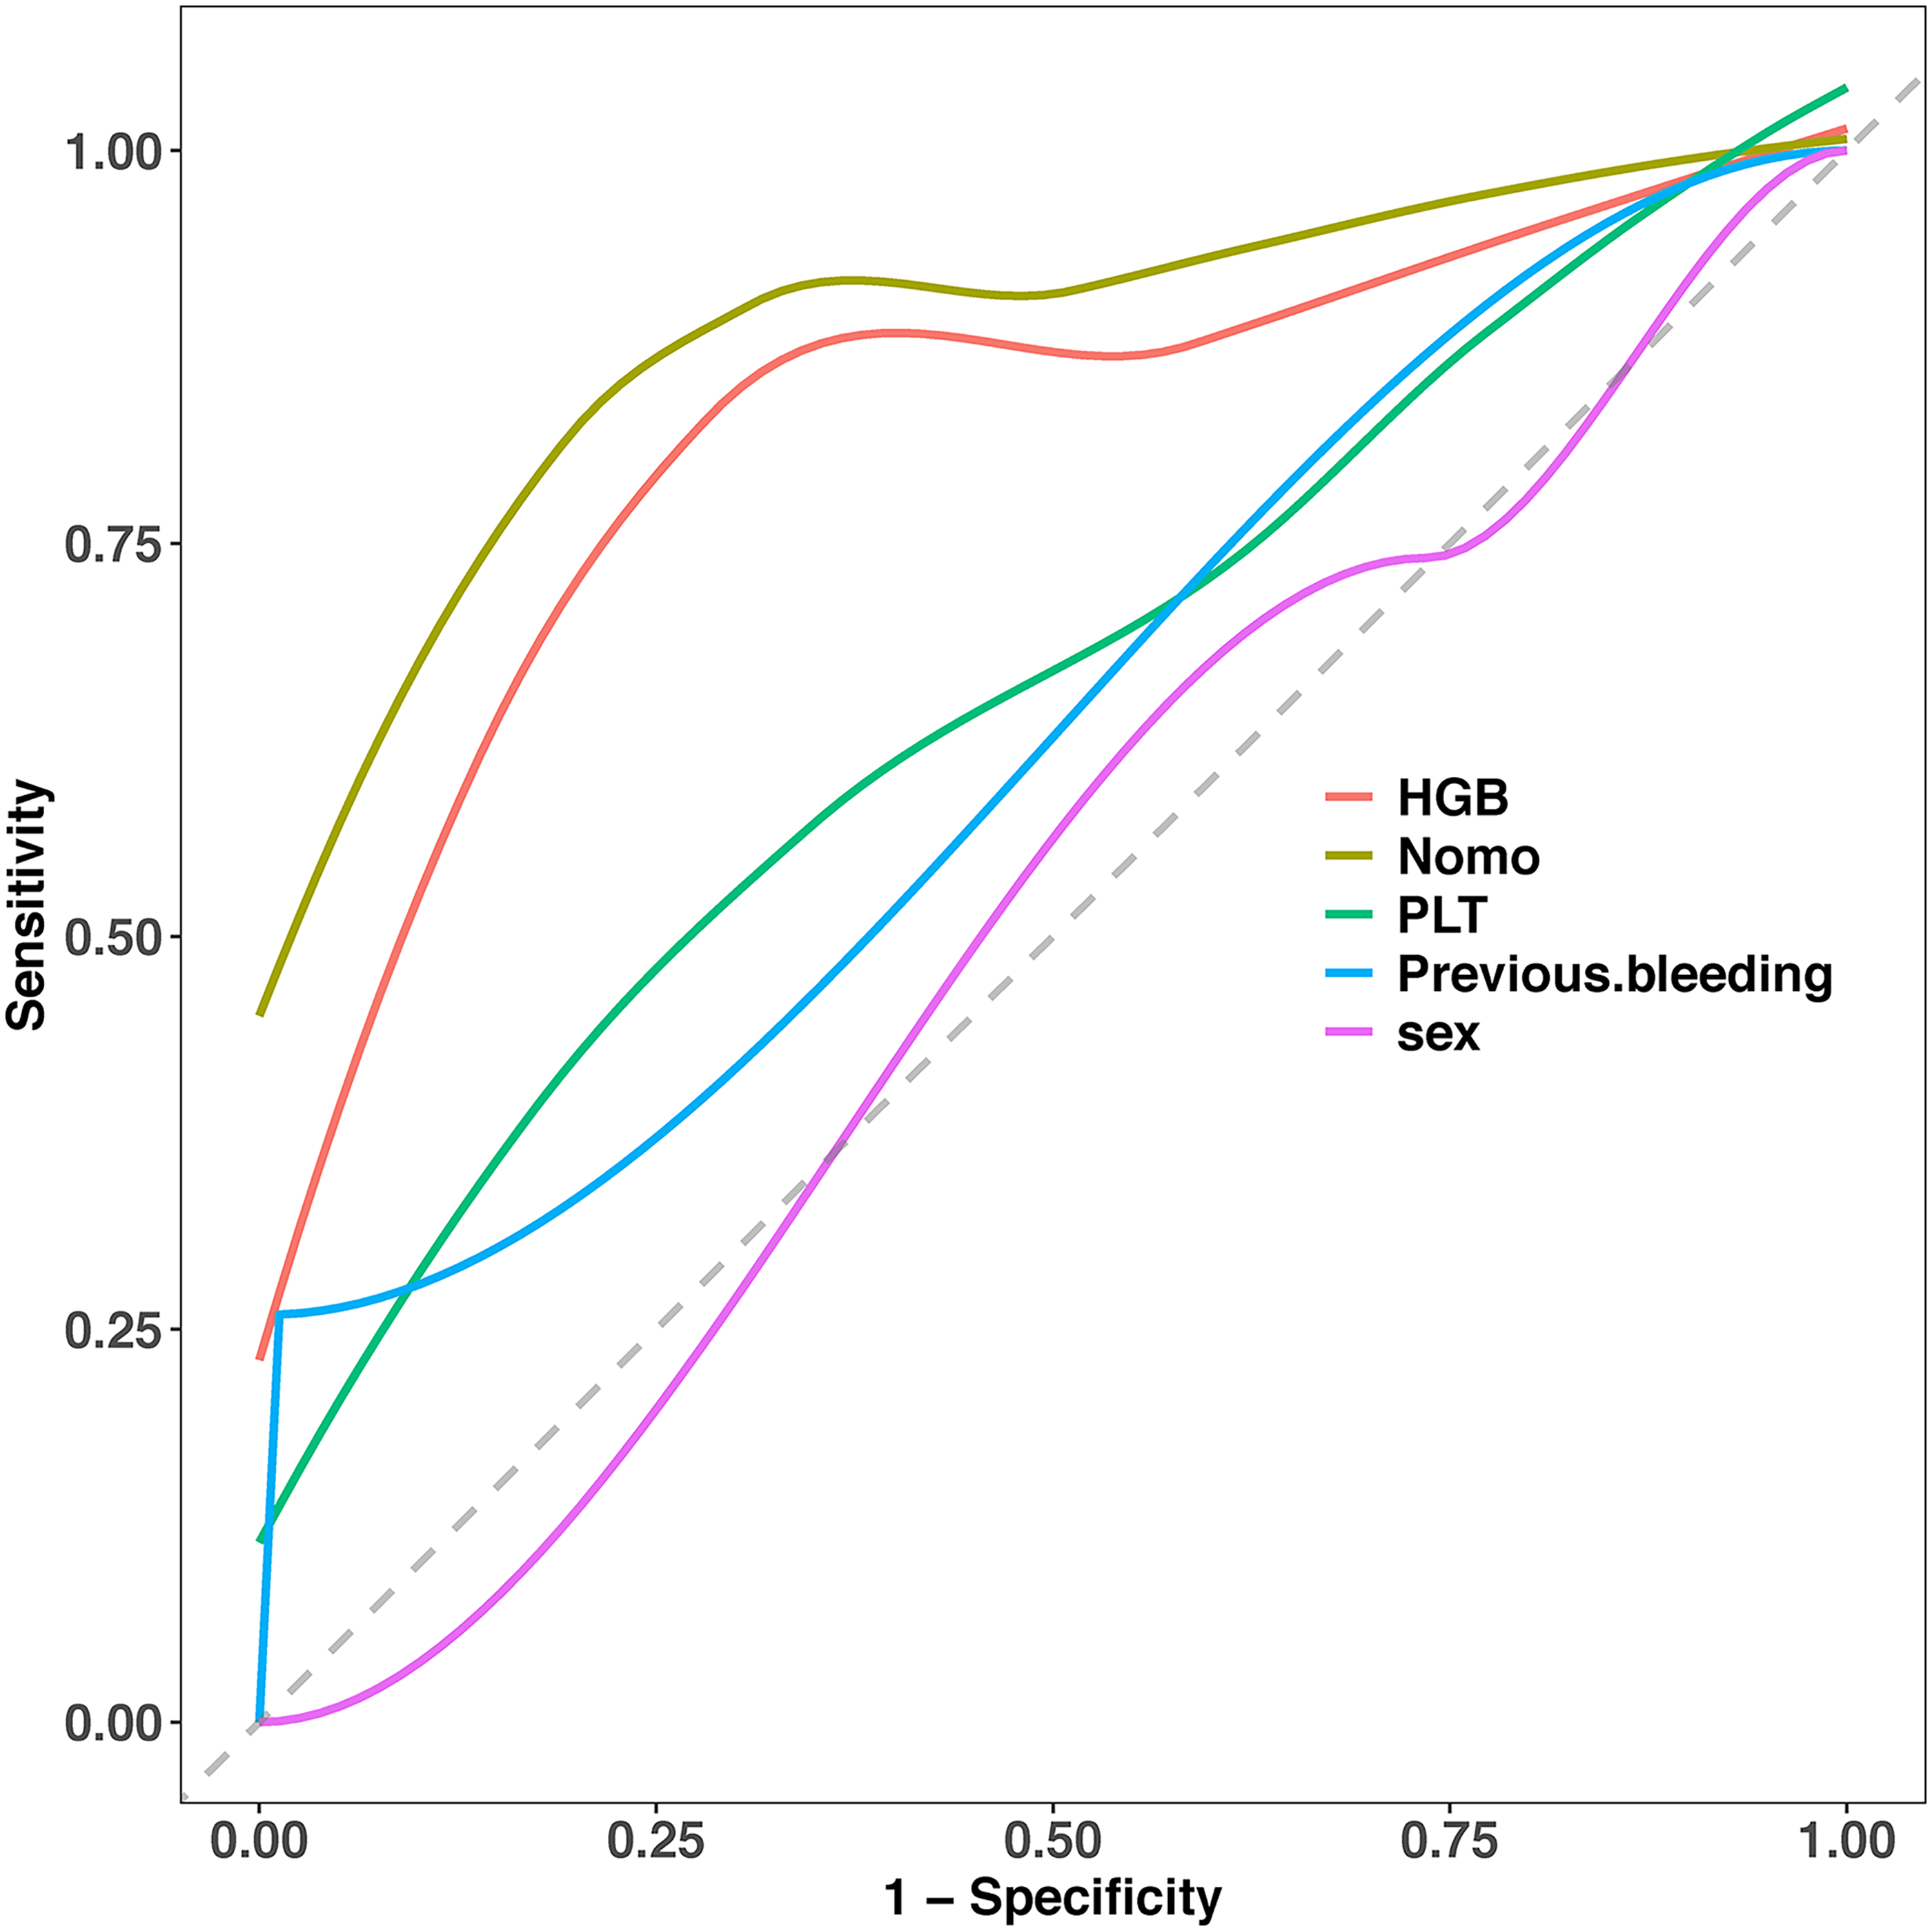
Comparison between nomogram and individual indicators.
Discussion
In this study, we developed and validated a model to assess bleeding risk in patients with a history of myocardial infarction treating with aspirin. The final model incorporated four indicators: HGB, PLT, previous bleeding, and sex. Our model exhibited excellent discrimination, calibration, and net clinical benefit. The nomogram derived from the logistic regression analysis visually represents the results, serving as a useful tool for clinicians to estimate bleeding risk in patients with a history of myocardial infarction treating with aspirin.
Multiple factors have been identified as influential in bleeding among aspirin users, including HGB, 23 PLT, 24 previous bleeding, 23 sex 25 cerebral infarction, 26 and gastric ulcer. 27 With the aim of incorporating comprehensive information, our risk models for predicting bleeding considered these factors.
Previous research has consistently highlighted the significance of decreased HGB levels as a strong predictor of major bleeding.28,29 Our study reaffirmed the critical role of HGB as an important indicator for assessing bleeding risk. Additionally, we identified PLT levels as another significant predictor, with lower levels indicating higher bleeding risk and poorer prognosis. 30 Our predictive model aligned with findings from previous studies, confirming the association between these factors and bleeding risk. Previous bleeding has long been recognized as a crucial factor in guiding treatment plans for aspirin users, 23 and our risk model further supported its contribution to increased bleeding risk in myocardial infarction patients. Furthermore, sex has been recognized as a potential predictor of bleeding, 25 with male sex independently associated with bleeding risk, consistent with prior research.
Tailored management strategies are essential for effectively addressing the varying bleeding risks in patients with a history of myocardial infarction treating with aspirin. While various bleeding scoring systems, including the HAS-BLED score, 31 ATRIA score, 32 TIMI score, CRUSADE score, Glasgow Blatchford Score, and Rockall Score, are utilized in clinical settings, they exhibit limitations due to their reliance on semi-quantitative scoring methods, which can be cumbersome. Moreover, these systems are tailored to specific patient populations. In the comparison with existing models used in clinical practice, our described model stands out due to several key factors. Firstly, unlike many existing semi-quantitative scoring systems, our model employs a quantitative approach, which allows for a more precise and granular assessment of bleeding risk. This quantitative methodology enhances the accuracy of risk calculation, especially when compared to the more subjective nature of the existing scoring systems. Additionally, our model incorporates a comprehensive set of indicators commonly employed in clinical evaluations, thereby capturing a wider spectrum of patient-specific factors. This broader inclusion of relevant parameters contributes to a more thorough and accurate assessment of bleeding risk, surpassing the limitations of the targeted nature of existing scoring systems. Moreover, the demonstrated high AUC of 88% signifies the robust predictive performance of our model, indicating its superior accuracy in clinical applicability when contrasted with the performance of existing systems. This high AUC value underscores the model's ability to effectively discriminate between patients at different levels of bleeding risk, further substantiating its superiority over the comparably limited predictive abilities of current scoring systems. Our predictive model, developed using Boruta analysis, incorporates key variables like HGB, PLT, previous bleeding, and sex. The model's results are visualized through a user-friendly nomogram, enabling clinicians to estimate individual bleeding risk and make personalized treatment decisions. For example, if a male myocardial infarction patient has a total score of 257, the estimated bleeding probability would be 29.7%. Given the importance of aspirin as a cornerstone antiplatelet drug in coronary disease management, the model's ability to accurately assess bleeding risk becomes pivotal in guiding its usage. By precisely identifying patients at higher bleeding risk, the model allows for a more nuanced approach to aspirin therapy, enabling clinicians to make informed decisions regarding its initiation, continuation, or potential alternative treatments. In the context of high bleeding risk patients, we suggest a personalized approach to antiplatelet therapy based on the model's recommendations. This tailored strategy may involve considering alternative antiplatelet agents, such as P2Y12 inhibitors or newer antiplatelet medications, which offer a potentially favorable risk-benefit profile in high bleeding risk individuals. By leveraging the model's insights, clinicians can pivot towards antiplatelet therapies that align with the patient's individual bleeding risk profile, thereby optimizing the balance between thrombotic protection and bleeding avoidance.
However, it is essential to acknowledge the limitations of our study. Firstly, the retrospective design prevents establishing causal relationships, highlighting the need for prospective validation of the predictive models developed. Secondly, the presence of missing data for certain variables could introduce bias, although we mitigated this by excluding variables with missing information in over 20% of patients. Furthermore, our study specifically focused on myocardial infarction patients, necessitating further investigation to generalize our findings to other patient populations.
Our study focused on creating and validating a model designed to evaluate bleeding risk in patients with a history of myocardial infarction treated with aspirin. The model which integrated four key indicators—HGB, PLT, previous bleeding, and sex—demonstrated outstanding performance in terms of discrimination, calibration, and net clinical benefit. Additionally, the nomogram derived from logistic regression analysis provides a visual representation of the findings, offering clinicians a valuable tool to estimate bleeding risk. To validate its reliability and effectiveness in routine clinical practice, external validation of our models across diverse patient cohorts is recommended for future research.
Supplemental Material
sj-pdf-1-cat-10.1177_10760296241262789 - Supplemental material for A Practical Nomogram for Predicting the Bleeding Risk in Patients with a History of Myocardial Infarction Treating with Aspirin
Supplemental material, sj-pdf-1-cat-10.1177_10760296241262789 for A Practical Nomogram for Predicting the Bleeding Risk in Patients with a History of Myocardial Infarction Treating with Aspirin by Jin Jing, Lei Wanling and Wang Maofeng in Clinical and Applied Thrombosis/Hemostasis
Footnotes
Authors’ Contributions
All the authors contributed to this manuscript and approved the submitted version of the manuscript. W MF conceived and designed the research strategy. JJ, LWL, and WMF wrote the manuscript text. LWL and WMF collected the clinical data. JJ and WMF contributed to the analysis and interpretation of the data.
Availability of Data and Materials
The datasets generated during and/or analyzed during the current study are available from the corresponding author on reasonable request.
Declaration of Conflicting Interests
The authors declared no potential conflicts of interest with respect to the research, authorship, and/or publication of this article.
Ethics Approval and Consent to Participate
This study received approval from the Medical Ethics Committee of the Affiliated Dongyang Hospital of Wenzhou Medical University (approval #2023-YX-408). Informed consent was waived, and patient records/information were anonymized and deidentified before analysis.
Funding
The authors disclosed receipt of the following financial support for the research, authorship, and/or publication of this article: This work was supported by the Zhejiang Provincial Outstanding Youth Science Foundation, (grant number LTGY23H200002).
Supplemental Material
Supplemental material for this article is available online.
References
Supplementary Material
Please find the following supplemental material available below.
For Open Access articles published under a Creative Commons License, all supplemental material carries the same license as the article it is associated with.
For non-Open Access articles published, all supplemental material carries a non-exclusive license, and permission requests for re-use of supplemental material or any part of supplemental material shall be sent directly to the copyright owner as specified in the copyright notice associated with the article.