
Abstract
Background:
Hyperlipidemia is one of the independent risk factors for the onset of coronary heart disease (CHD), and our aim is to construct a coronary risk prediction model for patients with hyperlipidemia based on carotid ultrasound in combination with other risk factors.
Methods:
The nomogram risk prediction model is based on a retrospective study on 820 patients with hyperlipidemia. The predictive accuracy and discriminative ability of the nomogram were determined by receiver operating characteristic (ROC) curves and calibration curves. The results were validated using bootstrap resampling and a prospective study on 39 patients with hyperlipidemia accepted at consenting institutions from 2021 to 2022.
Result:
In the modeling cohort, 820 patients were included. A total of 33 variables were included in univariate logistic regression. On multivariate analysis of the modeling cohort, independent factors for survival were sex, age, hypertension, plaque score, LVEF, PLT, and HbAlc, which were all selected into the nomogram. The calibration curve for probability of survival showed good agreement between prediction by nomogram and actual observation. The area under the curve (AUC) of the nomogram model was 0.881 (95% CI 0.858∼0.905), with a sensitivity of 79% and a specificity of 81.7%. In the validation cohort, the AUC was 0.75, 95% CI (0.602∼0.906). The sensitivity, specificity, positive predictive value (PPV), negative predictive value (NPV) and accuracy of this model were 54.16%, 80%, 81.25%, 52.17% and 64.1%. This model showed a good fitting and calibration and positive net benefits in decision curve analysis.
Conclusion:
A nomogram model for CHD risk in patients with hyperlipidemia was developed and validated using 7 predictors, which may have potential application value in clinical risk assessment, decision-making, and individualized treatment associated with CHD.
Introduction
Coronary heart disease (CHD) refers to the heart disease caused by coronary artery atherosclerosis, resulting in lumen stenosis or occlusion, myocardial ischemia, hypoxia or necrosis. CHD constitutes the leading cause of mortality worldwide. 1 According to the World Health Organization (WHO), ischemic heart disease will account for 13.1% of all deaths worldwide in 2030. Studies have shown that hyperlipidemia is one of the main risk factors for CHD. 2 Compared with people with normal total cholesterol level, patients with hyperlipidemia have about twice the risk of cardiovascular disease (CVD). 3
There are many models for predicting the risk of CHD, but there are few models for predicting the risk of CHD in hyperlipidemia patients. The current risk models for CHD are mainly traditional risk factors, such as gender, 4 age, 5 smoking, 6 obesity, 7 hypertension, 8 diabetes, 9 and so on. With clinical research, more and more new risk factors have been found, such as carotid intima-media thickness, homocysteine, platelets, and so on. In this study, we attempt to combine carotid ultrasound with traditional risk factors to construct, and validate, an intuitive and practical nomogram model for CHD risk prediction in hyperlipidemia patients. It is the hope that such a model may provide help for early risk assessment and prevention in this specific population.
Nomograms are commonly applied to estimate prognosis in medicine. With the ability to generate an individual numerical probability of a clinical event by examining risk factor variables, nomograms provide a clinical decision-making tool useful for personalized evaluations and prognosis. Their use is widespread on the internet and in medical journals and are increasingly being used by physicians and patients.
Methods
Patients and Study Design
A retrospective study was conducted on 820 patients with hyperlipidemia who were admitted to the Cardiology Department of Dongzhimen Hospital, Beijing University of Chinese Medicine from January 2018 to December 2020 (Beijing, China). Because this is a retrospective study, there might not be details in the charts, and only the conclusion of CT scan or the coronary angiography was considered to determine whether the patient has CHD. In the modeling cohort, there were 536 patients in the CHD group and 257 in the control group.
Inclusion criteria included the following: aged between 18 and 85; conforms to the diagnosis of hyperlipidemia in the Guidelines for the Prevention and Treatment of Dyslipidemia in Chinese Adults (2016 Revised Edition); carotid ultrasound results were available; coronary artery disease history is clear, coronary angiography or coronary CT can confirm or exclude CHD. Exclusion criteria were as follows: patients with secondary hyperlipidemia were clearly diagnosed; incomplete record of case information. The diagnostic criteria of hyperlipidemia: TC ≥ 5.2 mmol/L or LDL-C ≥ 3.4 mmol/L, or TG ≥ 1.7 mmol/L, with or without HDL-C < 1.0 mmol/L.
From January 2021 to February 2022, a prospective study was conducted on consecutive hyperlipidemia patients in the same medical institution with the same inclusion and exclusion criteria. These patients constitute the validation cohort of this study.
Procedures
Our study consists of 2 stages. The first stage is a retrospective study. We first collected clinical information from 820 patients in the modeling cohort using a case record table containing 33 variables. Then logistic regression analysis was used to screen meaningful independent risk factors and construct binary logistic regression equation. Finally, nomogram is drawn with R software to visualize the model. We use receiver operating characteristic (ROC) curve and correction curve to evaluate the discrimination and accuracy of the model. The second stage is a prospective study. We used 39 patients in the validation cohort to externally validate the nomogram model and draw the clinical decision curve and clinical impact curve to comprehensively evaluate the clinical applicability of the model (see Figure 1).

Model construction process diagram.
Statistical Analysis
Missing data processing: eliminate the variables with deletion rate >10%, and fill in the variables with deletion rate less than 10%, in which the continuous variables are filled according to the mean value and the classified variables are filled according to the mode.
IBM SPSS Statistics for Windows, version 26.0 was used for statistical analysis. The measurement data in line with the normal distribution were presented as mean ± standard deviation (
Univariate and multivariate logistic regression were used to identify risk factors, and the continuous variables finally included in the regression equation were transformed into classified variables. A nomogram was formulated based on the results of multivariate analysis and by using the package of rms in R version 4.1.2. 10 Goodness of fit of this nomogram was tested by the Hosmer–Lemeshow test. Clinical utility of this nomogram was assessed by calibration curve and decision curve analysis (DCA). To evaluate the predictive value of this model, accuracy and the area under the curve (AUC) from a ROC curve analysis was calculated. The larger the AUC, the more accurate was the prognostic prediction. 11 During the external validation of the nomogram, the total points of each patient in the validation cohort were calculated according to the established nomogram, then logistic regression in this cohort was performed using the total points as a factor, and finally, the AUC and calibration curve were derived based on the regression analysis. All statistical tests were 2-tailed and P < .05 was considered statistically significant.
Result
Comparison of Clinical Data Characteristics
A total of 820 patients were enrolled in this study, including 563 in the CHD group (332 males and 231 females) and 257 in the control group (113 males and 144 females). There were differences in age, sex, nation, smoking history, hypertension, diabetes, family history of hypertension, mean IMT, plaque score, LVEF, HGB, PLT, ALB, TC, TG, LDL-C, HDL-C, C1q, GLU, BUN, CR, HCY and HbA1c between the 2 groups. The difference was statistically significant (P < .05), as summarized in Table 1.
Comparison of Demographic and Clinical Data Between CHD Group and Control Group.

Abbreviations: LVEF, left ventricular ejection fraction; HGB, hemoglobin; PLT, platelet; GLU, glucose; BUN, blood urea nitrogen; CR, creatinine; UA, uric acid; ALB, albumin; TC, total cholesterol; HDL-C, high-density lipoprotein cholesterol; LDL-C, low-density lipoprotein cholesterol; TG, triglyceride; C1q, complement 1q; HCY, homocysteine; HbAlc, glycosylated hemoglobin; CHD, coronary heart disease; BMI, body mass index; IMT, intima-media thickness.
a Representative P value was statistically significant.
Univariate and Multivariate Binary Logistic Regression Analyses
Although the univariate logistic regression analysis showed that the P values of “nation,” “family history of hypertension,” TC, TG, HDL-C, LDL-C were less than .05, it did not conform to the clinical reality. We excluded them from multivariate logistic regression analysis. Variables with P < .1 in univariate logistic regression analysis were selected into multivariate logistic regression analyses. Results (Table 2) showed that Sex (P = .011, OR = 1.865), Age (P = .011, Age(1) P = .27, OR = 1.276; Age(2) P = .003, OR = 2.211), Hypertension (P < .001, OR = 2.207), Plaque score (P = .002, OR = 1.226), LVEF (P = .001, OR = 0.964), PLT (P = .05, OR = 0.997), HbAlc (P < .001, OR = 1.738) were independent factors for CHD.
Univariate and Multivariate Binary Logistic Regression Analyses.

Abbreviations: LVEF, left ventricular ejection fraction; HGB, hemoglobin; PLT, platelet; GLU, glucose; BUN, blood urea nitrogen; CR, creatinine; UA, uric acid; ALB, albumin; TC, total cholesterol; HDL-C, high-density lipoprotein cholesterol; LDL-C, low-density lipoprotein cholesterol; TG, triglyceride; C1q, complement 1q; HCY, homocysteine; HbAlc, glycosylated hemoglobin; CHD, coronary heart disease; BMI, body mass index; IMT, intima-media thickness; “-” represents that the univariate analysis results representing this variable were inconsistent with the clinical practice, so the variable was not included in the multivariate analysis.
a Representative P value was statistically significant.
The ROC curve of the regression model and 7 variables were drawn (Figure 2), and the cutoff value of the continuous variable was determined according to the Youden index to convert the continuous variable into a categorical variable as shown in Table 3.
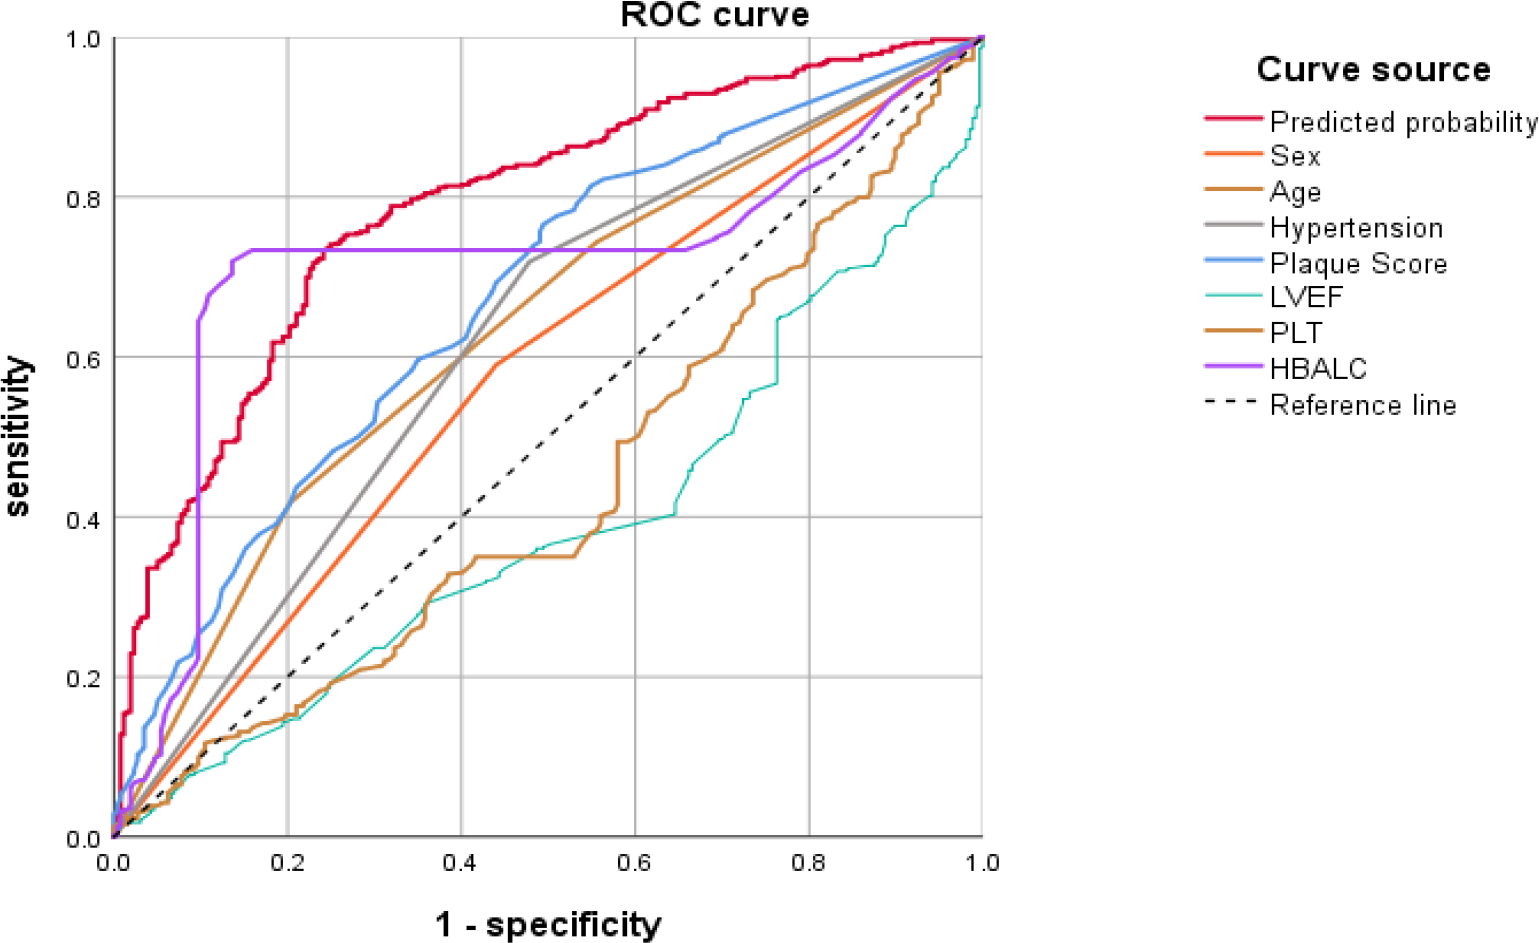
ROC curve analyses of the regression model and 7 variables.
AUC Tests for Multivariate Analysis and Variables.

Development of Predictive Nomogram Model for CHD
To display this predictive model more institutively, a nomogram with 7 factors as previously mentioned was constructed (Figure 3). Matching points of every parameter in the nomogram would be added up to obtain a total score, based on which the risk of CHD was evaluated. For example, a 75-year-old male patient with hyperlipidemia (56 points), with a history of hypertension (31 points), a plaque score of 3.4 mm (25 points), the HbAlc was 7% (100 points), the left ventricular ejection fraction was 70% (0 points), and the platelet count was 300 × 109/L (0 points), would score a total of 212 points, which corresponding to >95% predictive risk and meant strong intendency for CHD.

A nomogram model for predicting CHD risk in hyperlipidemia patients.
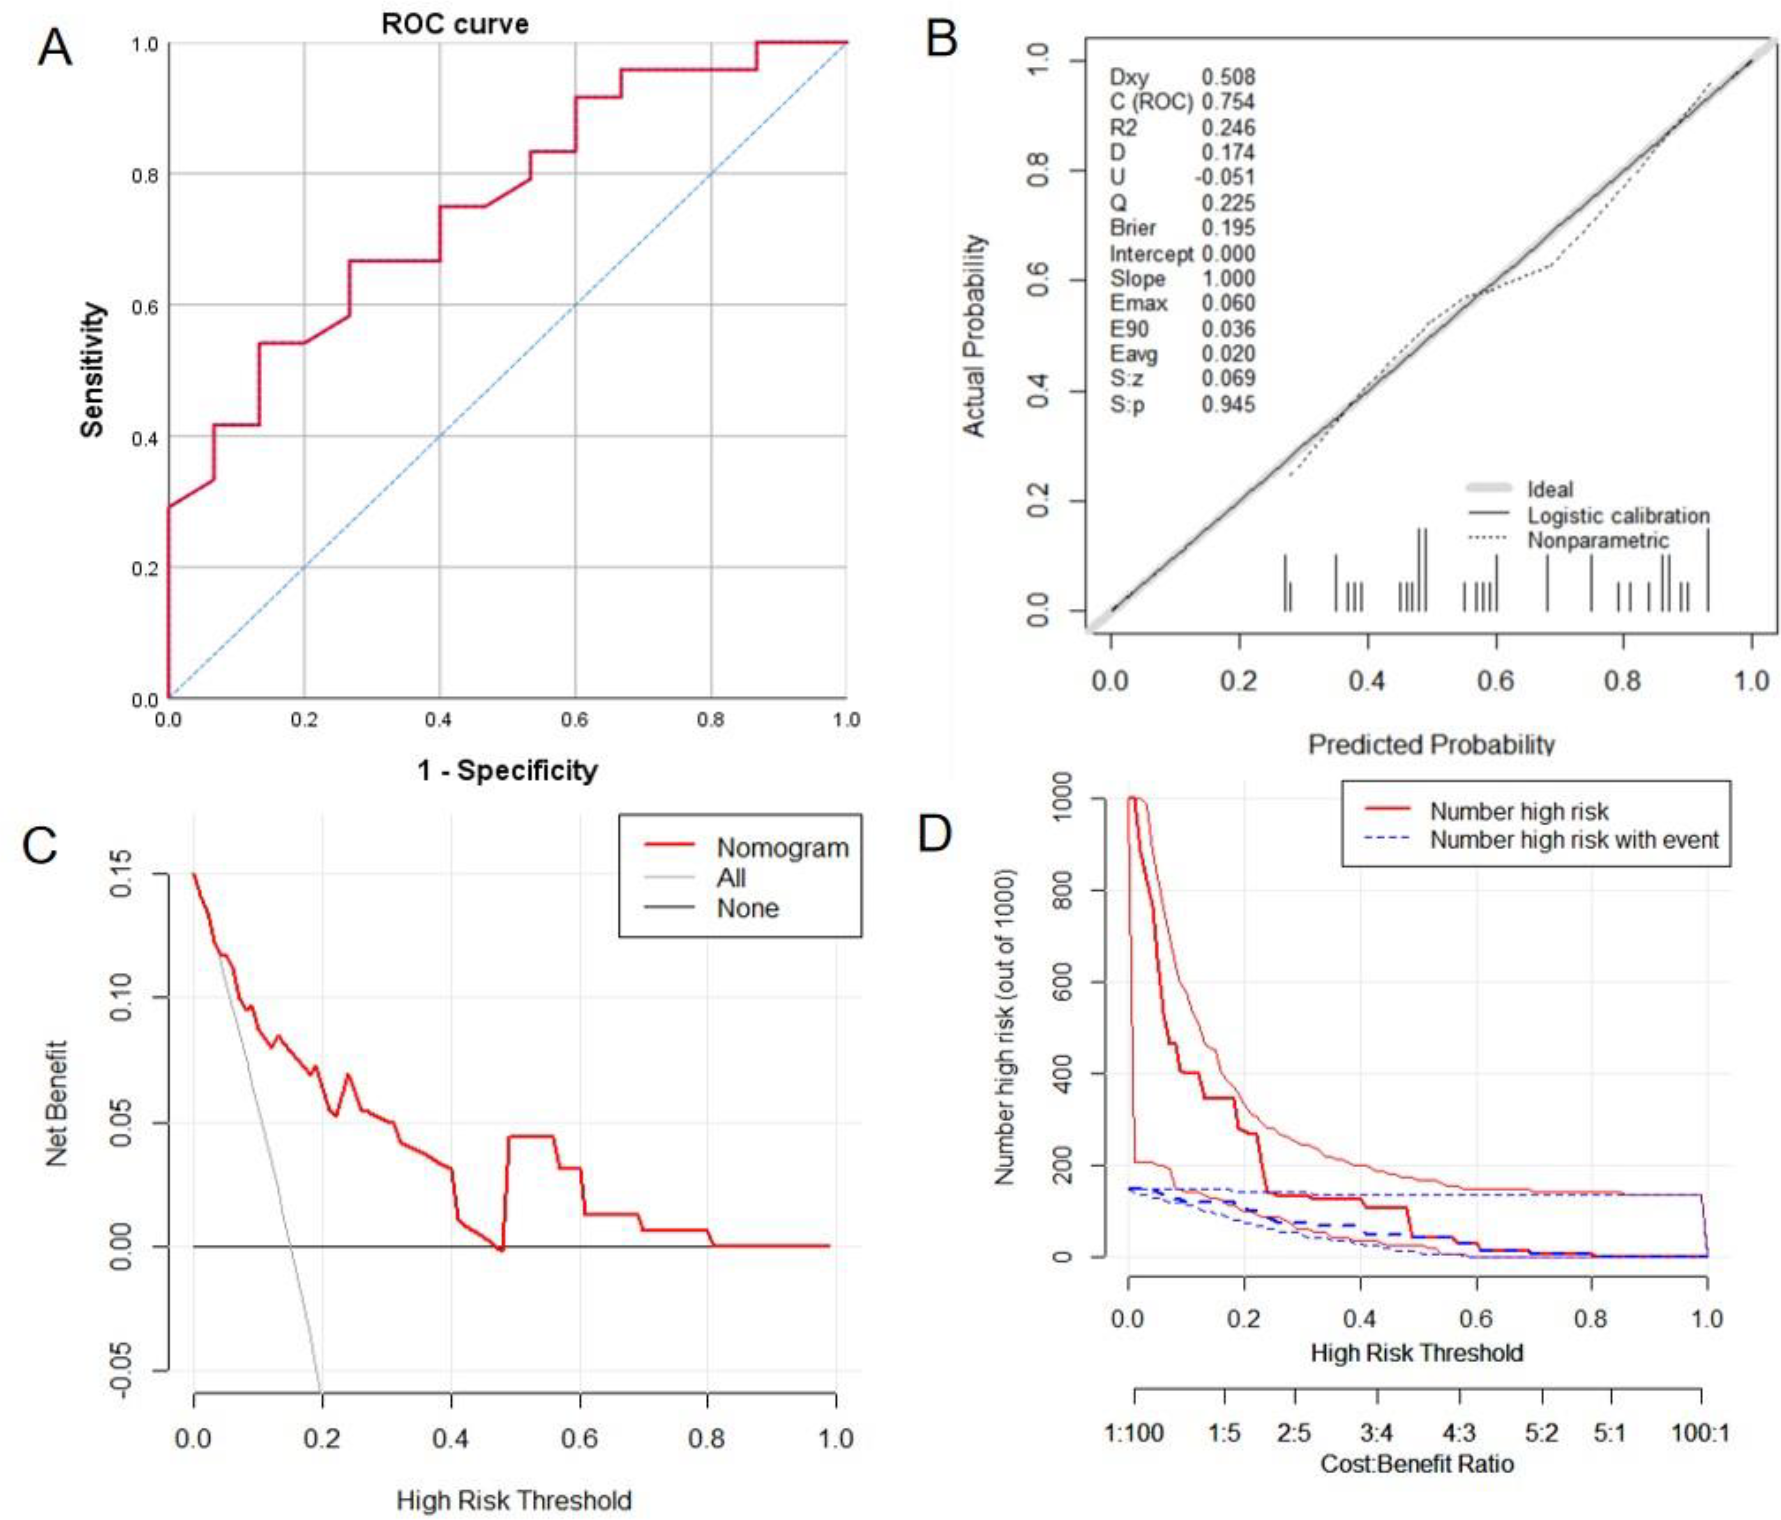
The P value of Hosmer–Lemeshow test was .563, indicating a goodness of fit. The calibration curve was shown in Figure 4B, which means that the CHD predicted by nomogram is basically consistent with the actual situation. The ROC curve was demonstrated in Figure 4A. The AUC of the nomogram was 0.881 (95% CI 0.858-0.905). When the prediction probability of 64% is selected as the best critical value, the corresponding sensitivity and specificity are 79% and 81.7%, respectively. The positive predictive value (PPV), negative predictive value (NPV) and accuracy of the model were 85.6%, 73.2% and 82.1%. The DCA was shown in Figure 4C, in which the nomogram performs good and can help make useful clinical decisions. The clinical impact curve is shown in Figure 4D. When the threshold probability is in the range of 40% to 60%, the curve between the predicted number of patients and the actual number of patients is very close, and the 95% CI is also relatively narrow, indicating the accuracy of the model prediction, high clinical applicability and high net return for patients.

Evaluation of the nomogram model. A, Receiver operating characteristic curve of nomogram. B, Nomograph calibration curve. The solid line represents the performance of the nomogram, and the dotted line represents the ideal model. The closer the 2 lines are, the better the prediction accuracy of the nomogram. C, Decision curve analysis of prediction model. The solid red line represents the prediction model, the gray line represents all patients with CHD, and the horizontal line represents all patients without CHD. This figure describes the expected net benefit per patient relative to the nomogram prediction of coronary heart disease risk. With the extension of the model curve, the net benefit increases. D, The clinical impact curve of the prediction model. The red curve indicates the number of people classified as high risk by the nomogram model under each threshold probability; The blue curve represents the number of true positives under the threshold probability.
Validation of Predictive Nomogram Model for CHD
Table 4 shows the test results of clinical data of patients in validation cohort and modeling cohort. Except for the difference in HbAlc level between the 2 groups (P < .05), no statistical difference was found in other data (P > .05), indicating that the data of the 2 cohorts are well comparable.
Comparison of Clinical Data Between Validation Cohort and Modeling Cohort.

a Representative P value was statistically significant.
According to the nomogram model, the 39 patients in the validation cohort were scored, and the ROC curve was drawn with the total score as the diagnostic variable. The ROC curves result showed that the AUC was 0.75 (95% CI, 0.602∼0.906), see Figure 5A. A widely accepted criterion is that AUC below 0.6 is low discrimination, 0.6 to 0.75 is medium discrimination, and above 0.75 is high discrimination. The results show that although the AUC has decreased slightly after validation of the validation cohort data, it’s still acceptable. When choosing this nomogram model predicted the risk of 0.64 (120 points) as optimal cutoff value, corresponding sensitivity and specificity were 54.16% and 80%. The PPV, NPV and accuracy of this model were 81.25%, 52.17% and 64.1%. Hosmer–Lemeshow test’s P value was .945, indicating a satisfactory goodness-of-fit. The calibration curve is demonstrated in Figure 5B, the DCA is shown in Figure 5C and the Clinical Impact Curve is shown in Figure 5D. Compared with the modeling cohort, the prediction accuracy of the validation cohort decreased slightly, and the clinical net benefit decreased, but it still has a certain clinical application value.
Evaluation of nomogram external verification results. A, Receiver operating characteristic curve for the external verification. B, External verification calibration curve. The solid line represents the performance of the nomogram, and the dotted line represents the ideal model. The closer the 2 lines are, the better the prediction accuracy of the nomogram. C, Decision curve analysis for the external verification. The solid red line represents the prediction model, the gray line represents all patients have CHD, and the horizontal line represents no patients have CHD. This figure describes the expected net benefit per patient relative to the nomogram prediction of coronary heart disease risk. With the extension of the model curve, the net benefit increases. D, Clinical Impact Curve for the external verification. The red curve indicates the number of people classified as high risk by the nomogram model under each threshold probability; the blue curve represents the number of true positives under the threshold probability.
Discussion
This study analyzed 33 potential variables of 820 hyperlipidemia patients. The following independent risk factors were identified: sex, age, hypertension, plaque score, LVEF, PLT, and HbAlc. A simple and easy-to-use prediction nomogram for CHD using multivariate analyses was developed. Seven variables were filtered out for the nomogram using logistic regression. The nomogram showed an excellent diagnostic performance (AUC = 0.881) and yielded a sensitivity of 79% and specificity of 81.7% at the optimal cutoff value. The model is verified by bootstrap sampling and external verification. Besides, this prediction model showed superior performance when used in the clinical setting based on the results of the decision curve analysis and clinical impact curve.
Many studies have shown that age is an independent risk factor for CHD. 5 This study also draws a consistent conclusion. The risk of CHD in patients aged 60 to 69 years is about 1.2 times that in patients aged <60 years; the risk of CHD in patients aged ≥70 years is about 2.3 times higher than that in patients aged <60 years. Corresponding to the nomogram, the score of patients aged ≥70 years increased by about 22 points compared with patients aged 60 to 69 years. It shows that age is very important for the incidence of CHD. This is related to arteriosclerosis caused by age and natural aging of human organs.
As an independent disease, hypertension has the same risk factors as CHD, and the 2 diseases often affect each other. Hypertension is one of the independent risk factors of CHD. When hypertension and CHD coexist, the risk of cardiovascular disease death increases. Half a century ago, Framingham and other studies found that both systolic and diastolic blood pressure were risk factors for cardiovascular and cerebrovascular diseases. 12 This study also found that the risk of CHD in patients with hypertension was about 2.3 times higher than that in patients without hypertension. The mechanism may be related to the increase of intravascular flow velocity and shear force caused by hypertension, which further leads to the damage of vascular endothelium, which just provides conditions for lipid deposition and aggravates the process of atherosclerosis. Therefore, maintaining a stable blood pressure level can prevent the occurrence of CHD to a certain extent.
Atherosclerosis is a slow-moving, systemic pathological change. As a part of peripheral arteries, carotid artery has similar damage factors, pathogenesis and pathophysiological mechanism to coronary atherosclerosis. Based on this, we believe that the degree of carotid atherosclerosis and plaque formation can reflect the situation of coronary atherosclerosis to a certain extent, which is also the focus of this study. The 2010 ACC guidelines 13 included carotid intima-media thickness in the risk assessment model for atherosclerotic cardiovascular events in moderate-risk asymptomatic adults. Lekakis et al 14 found that the PPV of CHD diagnosed by IMT ≥8 mm was 85%, and the NPV was 66%. The index of average IMT was also included in this study. In univariate analysis, it was suggested that the average IMT was significantly correlated with the occurrence of CHD (P < .001). However, in the process of multivariate regression analysis, the average IMT was not included in the equation. It was considered that it may have an impact on it when analyzed together with other risk factors. Plaque score as an independent risk factor of CHD was included in the final nomogram. According to the nomogram, the score of plaque score >2.6 mm is 25 points. A study of patients with familial hypercholesterolemia 15 also came to a similar conclusion: carotid plaque score was significantly associated with CHD, while IMT was not. An outcome study 16 shows that amount of carotid plaque assessed by carotid plaque imaging significantly improves cardiovascular risk prediction beyond the PROCAM risk equation. The close relationship between carotid plaque and CHD may be related to their similar pathogenesis. Age, male, smoking, hypertension, and so on are all risk factors for carotid atherosclerosis and coronary atherosclerosis.
The risk factor contributing the most in the nomogram is HbAlc, and the score of HbAlc ≥ 6.5% is 100 points. This is not difficult to understand. In the latest diabetes guideline, 17 HbAlc > 6.5% has been used as one of the diagnostic criteria. In this study, the proportion of patients with CHD and diabetes mellitus is 41.6%, which is next to the number of CHD complicated with hypertension. In clinic, patients with hyperlipidemia are also more likely to be complicated with abnormal blood glucose, which is related to the metabolic function of the body. Studies have shown that diabetes mellitus is 2 to 4 times more risk of CHD than nondiabetes patients. The incidence of CHD may be related to the internal environment disorder, inflammatory factor release, endothelial dysfunction, abnormal platelet function and coagulation dysfunction caused by hyperglycemia.
The results of this study show that the platelet count of 213 × 10 9 /L is valuable for distinguishing CHD patients. Platelet count ≤213 × 10 9 /L, the nomogram score was 28 points, while >213 × 10 9 /L is 0. The platelet level of normal people is 100 to 300 × 10 9 /L. Some studies have also shown that low platelet levels may increase the risk of thrombosis in addition to increasing the risk of bleeding. The platelet volume of patients with thrombocytopenia increases correspondingly. The mean platelet volume (MPV) is positively correlated with the activity, the larger the volume, the higher the platelet activity, the stronger the adhesion with the vascular wall, and the higher the potential risk of thrombosis. The Dongfeng Tongji cohort 18 also found that lower levels of MPV and platelet distribution width were significantly associated with lower risk of CVD and CHD. Studies have confirmed that patients with thrombocytopenia have a corresponding increase in platelet volume, and the average platelet volume is positively correlated with activity. The larger area, the higher the platelet activity, the stronger the adhesion to the vascular wall, and the higher the potential risk of thrombosis. The Dongfeng-Tongji Cohort studied the relationship between platelets parameters and cardiovascular disease. 18 They also found that lower levels of mean platelet volume and platelet distribution width were significantly related to lower risks of CVD and CHD. So, this study shows that lower platelet levels in the normal range is associated with a higher risk of CHD. We consider that the reason for this difference may be related to the fact that patients with CHD are more likely to receive antiplatelet drugs, such as aspirin. However, as an anti-platelet aggregation drug, the probability of thrombocytopenia caused by aspirin is very small, and it mostly affects the function of platelets. More research may be needed to clarify the reasons.
The earliest research on CHD risk prediction model can be traced back to the well-known Framingham risk factors predicting CHD risk published in 1998. 19 At present, there are many CHD risk prediction models at home and abroad. These models are based on different countries and races, and the prediction factors in the models are also different. Foreign well-known risk assessment models include SCORE plan, 20 the research object is the European population, and the main risk factors include age, gender, TC, HDL-C, blood pressure, smoking, and so on. the ACU of the model is 0.71 to 0.84. Reynolds Risk Scoring System 21 mainly studies European Americans. In addition to traditional risk factors, hs-CRP and HbAlc are also included as risk factors. China’s China-PAR risk prediction model 22 mainly studies the risk factors of gender, age, living area, waist circumference, TC, HDL-C, blood pressure, antihypertensive drugs, diabetes, smoking, family history, and so on. The AUC of the published gender specific equation was 0.794 (95% CI, 0.775-0.814) for men and 0.811 (95% CI, 0.787-0.835) for women.
The present study has some strengths. Firstly, this study focuses on patients with hyperlipidemia, which is more targeted. The visualization of the model as nomogram is more practical in clinical practice, which is helpful for the early identification and early intervention of high-risk groups of CHD, which is of great significance for the prevention and treatment of CHD. Secondly, we included new risk factors such as carotid plaque, LVEF and HbAlc, which are easier to obtain clinically and reduce the pain of invasive examination. Third, we use clinical decision curve and clinical impact curve to evaluate the clinical decision-making ability of the model, not just AUC. AUC only focuses on the accuracy of model prediction, and cannot tell us whether the model is worth using. The clinical decision curve, first used by Dr Andrew Vickers, 23 can help physicians make better decisions by evaluating the net benefits of patients under different prediction probabilities. Finally in addition to internal bootstrap validation, this study also uses external data to verify the effectiveness of the nomogram, and more comprehensively evaluates the clinical practicability of the model. The nomogram was found to have good positive net benefits by decision curve analysis.
In contrast, this study has several limitations. First, the risk factors for CHD such as smoking history, BMI, diabetes history, family history of hypertension and family history of hyperlipidemia have not been included in the equation. In the process of data analysis, we tried different regression methods, and the results were slightly different each time. In addition to the differences in various statistical methods, it is also considered to be related to the nature of retrospective studies and small samples. Secondly, due to the short duration of the study and the impact of the COVID-19 epidemic, the sample size of the external validation queue of the nomogram was too small, which directly led to the decline in the efficiency of the nomogram compared with the modeling cohort. It is still necessary to conduct robust external validation on large samples. Finally, this study is a retrospective cross-sectional study. If there is a prospective study with long-term follow-up and a more detailed evaluation of multiple endpoint events, it may be more meaningful for the follow-up work.
Conclusion
In this study, we retrospectively obtained carotid ultrasound data and clinical data of patients with hyperlipidemia, and screened out 7 coronary heart disease risk factors, including gender, age, hypertension, plaque score, LVEF, PLT, and HbAlc. Based on this, we established a Nomogram model for predicting CHD risk in patients with hyperlipidemia. Through external data validation, the model has good discrimination, calibration, and prediction capabilities. It can be used to identify CHD high-risk patients and guide the development of individualized diagnosis and treatment programs. This new nomogram model is important for CHD risk estimation, improving the communication between patients and physicians, and clinical decision-making.
Footnotes
Authors’ Note
All data generated or analyzed during this study are included in this published article and its supplementary information files. This study was retrospective and did not involve interventions in patients. With the permission of the Ethics Committee of Dongzhimen Hospital, Beijing University of Chinese Medicine, the need for informed consent can be waived.
Acknowledgments
Thanks for the financial support of the National Key Research and Development Program of China for this study. All authors would like to thank for the manuscript help.
Author Contributions
Yuanyuan Zeng: data collection, data analysis, writing-original draft; Jing Zhao: data collection; Tingting Yao: data collection; Jieqiong Weng: data collection; Mengfei Yuan: data collection; Xiaoxu Shen: writing-review and editing.
Declaration of Conflicting Interests
The author(s) declared no potential conflicts of interest with respect to the research, authorship, and/or publication of this article.
Funding
The author(s) disclosed receipt of the following financial support for the research, authorship, and/or publication of this article: This study was supported by The National Key Research and Development Program of China, Grant/Award Number: 2017YFC1700206.