
Abstract
Acute upper gastrointestinal bleeding (UGIB) is a common life-threatening clinical emergency with a poor prognosis. The aim of this study was to develop a risk prediction model for in-hospital mortality in patients with UGIB. We performed a post hoc analysis of a publicly available retrospective clinical data. A total of 360 patients with UGIB were included in this study. The least absolute shrinkage and selection operator regression was used to screen predictors and a restricted cubic spline function was used to investigate the assumption of linear relationships between continuous predictors and the risk of in-hospital mortality. Backward stepwise selection with the Akaike information criterion was used to identify variables for the best prediction model. A nomogram was developed based on the results of the best prediction model. The receiver operating characteristic curve, GiViTI calibration plot, and decision curve analysis were used to evaluate the performance of the nomogram. The optimal prediction model consisting of 4 predictors: red cell distribution width (odds ratio [OR] = 8.44; 95% confidence interval [CI]: 1.77-89.10), platelet count (OR = 0.99; 95% CI: 0.99-1.00), pulse rate (OR = 1.03; 95% CI: 1.01-1.05), and SpO2 (OR = 0.92; 95% CI: 0.86-0.96). The nomogram model had good discrimination (area under the curve = 0.86, 95% CI: 0.78-0.95), calibration, and clinical usefulness. In this study, we developed a nomogram model for predicting death during hospitalization in patients with UGIB based on blood biomarkers and baseline vital signs at the time of admission. The model has good performance, allowing rapid risk stratification of patients with UGIB.
Introduction
Acute upper gastrointestinal bleeding (UGIB) is a common medical emergency where rapid and massive blood loss often leads to hypovolemic shock and death. Although advances in medical technology such as newer drug and endoscopic therapies have improved the prognosis of patients with UGIB over the past few decades, the mortality rate of patients with UGIB during hospitalization remains at 6% to 10%.1–3
Reducing mortality and improving prognosis in patients with UGIB is a long-standing challenge for emergency physicians and internists. The pre-requisite for all therapeutic measures is early and accurate identification of disease risk and individualized treatment. Early identification of patients at high risk of UGIB and risk stratification of these patients may help to improve prognosis. Several scoring systems have been developed to predict the risk of UGIB and they have shown good predictive effects, 3 but these scoring systems have been developed in Western populations and are still not sufficiently concise, and predictive models regarding the specificity of death after UGIB have not been well studied. In recent years, nomogram models have been widely used in disease diagnosis and risk stratification due to their visualization and simplicity. Validated nomogram models have high clinical application value and can positively influence clinical decision making and patient prognosis to a certain extent. We used a publicly available clinical dataset to analyze the risk of death during hospitalization in patients with UGIB. The aim of this study is to develop a concise nomogram model for predicting the risk of in-hospital mortality in patients with UGIB in an Asian population based on indicators such as blood biometrics and admission vital signs, in order to help emergency physicians to rapidly identify high-risk patients and provide timely treatment, and to optimize emergency medical resources. Meanwhile, we conducted an internal validation of the performance of the established nomogram model including discrimination, calibration, and clinical applicability.
Methods
Study Population
Data for this retrospective study were obtained from the electronic medical record system of the Department of Emergency Medicine (copyright waived by the authors) at Konkuk University Medical Center in Korea, 4 and we used these publicly available data (copyright waived by the authors, data available at https://www.ncbi.nlm.nih.gov/pmc/articles/PMC5667835/) for post hoc analysis to develop a risk prediction model for in-hospital mortality in patients with UGIB. During the 2-year study period (January 2012 to December 2013), a total of 360 patients diagnosed with UGIB were included in this study, including 339 patients who survived to discharge and 21 who died during their hospitalization. The Institutional Review Board of Konkuk University Hospital approved the study protocol (KUH-1260014) and all patients’ data were anonymous.
Data Collection
We included a set of variables based on literature review and their availability in the original database. These variables include baseline demographics (age and gender), comorbidities (hypertension, diabetes, congestive heart failure, coronary artery disease, renal failure, liver failure, and metastatic cancer), the use of active medications such as nonsteroidal anti-inflammatory drugs, aspirin and warfarin, initial vital signs such as systolic blood pressure (SBP), oxyhemoglobin saturation (SpO2), respiratory rate and pulse rate, causes of UGIB, and the history of syncope and melena. Laboratory parameters include red cell distribution width (RDW), hemoglobin, blood urea nitrogen, hematocrit (Hct), mean corpuscular volume, platelet count (PLT) and mean platelet volume.
Statistical Analyses
The distributions of all quantitative variables were analyzed using the Shapiro-Wilk test. Normally distributed continuous data were presented as the mean ± standard deviation and were compared between the 2 groups using the independent samples t-test. Non-normally distributed continuous data were presented as median (interquartile range) and compared using the Mann-Whitney test. Categorical variables were presented as counts and percentages, and differences between 2 groups were compared by the chi-squared test or the Fisher exact test. All the 360 patients were analyzed for variable selection to develop the risk prediction model. Least absolute shrinkage and selection operator (LASSO) regression was applied to select the optimal prediction factors from 26 features. In addition, restricted cubic splines (RCS) were used to investigate the assumption of linear relationships between continuous predictors and the risk of in-hospital mortality, and when nonlinearly correlated, the continuous predictors were categorized into 2 groups based on the optimal cut-point value. Univariate logistic regression and multivariate backward stepwise logistic regression were performed to identify the risk factors for in-hospital mortality in patients with UGIB, and the Akaike Information Criterion (AIC) was used to construct the best prediction model. A nomogram was developed based on the results of the best prediction model, which was validated internally using the bootstrap method. The receiver operating characteristic curve (ROC), GiViTI plot, and decision curve analysis (DCA) were used to evaluate the performance of the nomogram. All of the statistical analyses were performed using R software (4.2.2). A P-value < .05 (2-tailed) or the 95% confidence interval (CI) of the odds ratio (OR) excluding the value 1 was considered statistically significant.
Results
Baseline Characteristics
A total of 360 eligible consecutive patients were enrolled in this study, 339 of them survived to discharge and 21 died during their hospitalization. The baseline characteristics of the included participants are presented in Table 1. Compared to patients who survived to discharge, participants with UGIB who died during hospitalization tended to have lower SBP, lower SpO2, faster pulses and were more likely to have comorbidities, malignancy and varicose veins on admission (all P < .05).
Baseline Characteristics of Patients With UGIB.

Note: Data are presented as n (%) or mean ± standard deviation, median (25th percentile, 75th percentile).
Abbreviations: CAD, coronary artery disease; SBP, systolic blood pressure; SpO2, oxyhemoglobin saturation; UGIB, acute upper gastrointestinal bleeding.
As shown in Table 2, in terms of laboratory parameters, the death group had higher RDW levels and lower hemoglobin, Hct and PLT levels (all P < .05).
Laboratory Parameters.
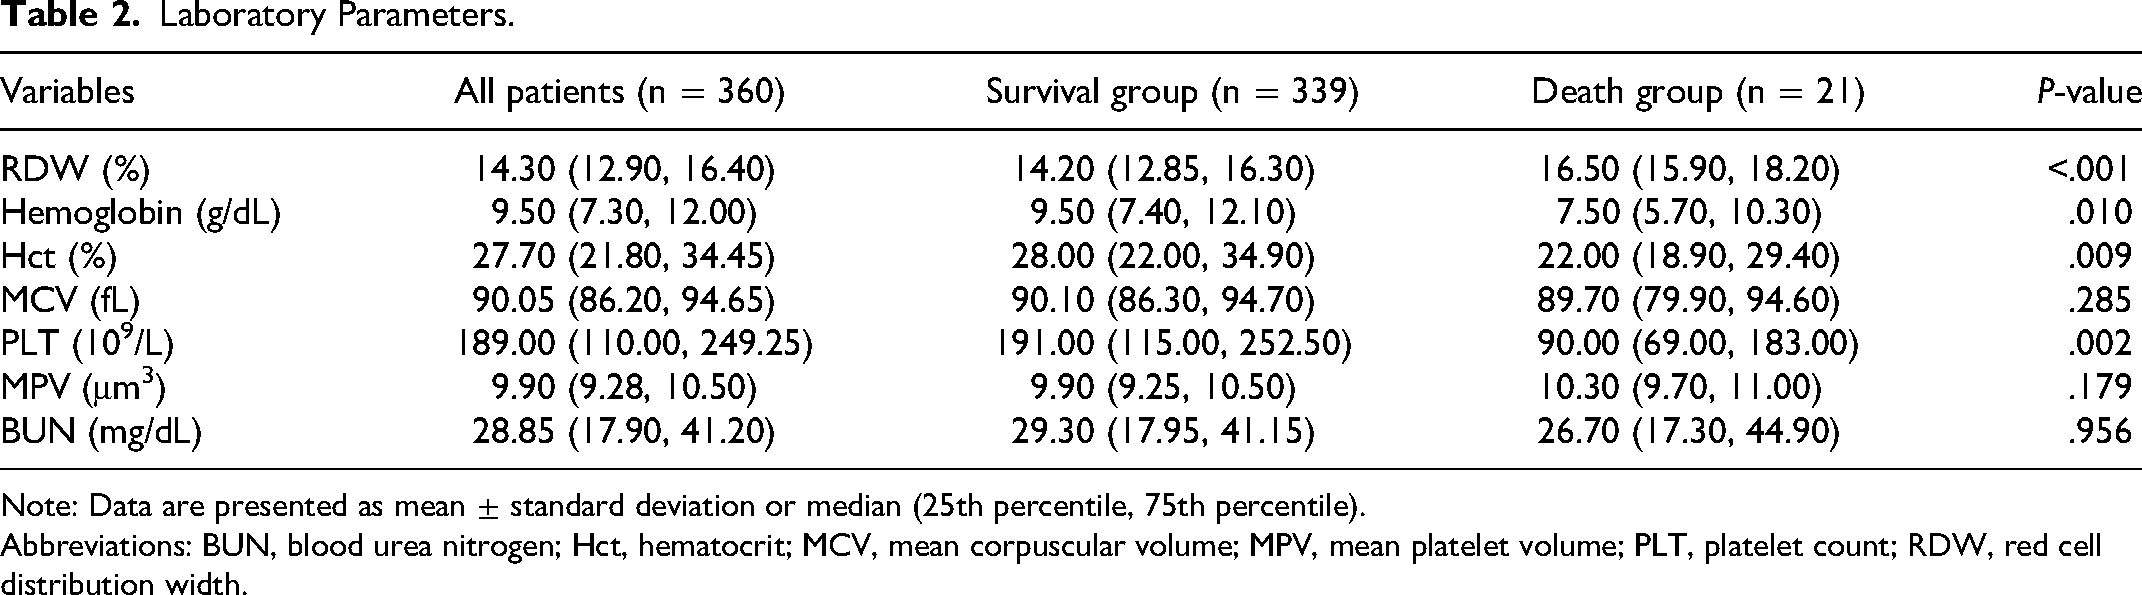
Note: Data are presented as mean ± standard deviation or median (25th percentile, 75th percentile).
Abbreviations: BUN, blood urea nitrogen; Hct, hematocrit; MCV, mean corpuscular volume; MPV, mean platelet volume; PLT, platelet count; RDW, red cell distribution width.
Variable Selection and RCS Analysis
To avoid colinearity between variables and over-fitting of the model, the LASSO regression was applied to select characteristic variables. The LASSO regression included 24 candidate variables (all variables in Tables 1 and 2), with a final selection of 6 potential predictors of death: RDW, PLT, SBP, pulse rate, SpO2, renal failure (Figure 1A and B).

Feature selection using the least absolute shrinkage and selection operator (LASSO) binary logistic regression model. (A) LASSO coefficient profiles of the 24 baseline features; (B) the tuning parameter (λ) selection in the LASSO model using 10-fold cross-validation via minimum criteria. Vertical lines were drawn at the value selected using 10-fold cross-validation, where optimal λ resulted in 6 non-zero coefficients.
Associations between continuous predictors (RDW, PLT, SBP, pulse rate, and SpO2) and the risk of in-hospital mortality were evaluated using the RCS method, and when nonlinearly correlated, the continuous predictors were categorized into 2 groups based on the optimal cut-point value.
RDW and SBP are nonlinearly related to the risk of death during hospitalization, as shown in Figure 2A and B.

RCS curves analysis. (A) Association between RDW and the risk of in-hospital mortality in patients with UGIB, P for nonlinear test <.05; (B) association between SBP and the risk of in-hospital mortality in patients with UGIB, P for nonlinear test <.05. Abbreviations: CI, confidence interval; OR, odds ratio; RCS, restricted cubic spine; RDW, red cell distribution width; SBP, systolic blood pressure; UGIB, acute upper gastrointestinal bleeding.
The RCS curve showed that when RDW (14.3%) was used as the reference, a higher RDW was associated with a higher in-hospital mortality risk. Similarly, when the SBP (118 mm Hg) was used as the reference, a higher SBP was associated with a lower in-hospital mortality risk. And, there is an approximate L-shaped relationship between SBP levels and in-hospital mortality risk.
Based on the results of the RCS curves, RDW and SBP were converted into binary variables for subsequent analysis according to the cut-off values (14.3% and 118 mm Hg, respectively).
Univariate and Multivariate Logistic Regression Analysis
Six variables screened by LASSO regression were included in the univariate logistic regression analysis and those variables that were statistically significant (P < .05) in the univariate analysis were included in the multivariate logistic regression model in a backward stepwise fashion.
Finally, an optimal predictive model consisting of 4 variables (RDW, PLT, pulse rate, and SpO2) was determined according to the AIC (Table 3).
Univariate and Multivariate Logistic Regression Analysis.

Note: Data are presented as mean ± standard deviation or median (25th percentile, 75th percentile).
Abbreviations: CI, confidence interval; OR, odds ratio; PLT, platelet count; RDW, red cell distribution width; SBP, systolic blood pressure; SpO2, oxyhemoglobin saturation.
Development and Validation of a Mortality-Predicting Nomogram
A simple nomogram was formulated on the results of the optimal prediction model to facilitate the calculation of risk scores and thus easily assess the probability of an individual's in-hospital mortality.
As shown in Figure 3, the nomogram model contained 4 predictors: RDW, PLT, pulse rate, and SpO2. Each of these independent predictors was projected upwards onto the “point” of that value at the top of the nomogram to obtain a score from 0 to 100, and the total score of these points were then recorded to predict the probability of patients with UGIB in-hospital mortality risk.

The nomogram for the prediction of in-hospital mortality in patients with UGIB. Abbreviations: RDW, red cell distribution width; PLT, platelet count; SpO2, oxyhemoglobin saturation; UGIB, acute upper gastrointestinal bleeding.
We evaluated the performance of the nomogram in the internal validation. The discriminative power of the nomogram was good, and the corresponding area under the curve was 0.86 (95% CI: 0.78-0.95) (Figure 4). In addition, we compared the differences between the created nomogram model and 2 popular scoring systems: the Glasgow-Blatchford Score (GBS) and the Pre-Endoscopic Rockall Score (PRS)5,6 in predicting patients’ risk of death. The nomogram showed a better discriminatory power for in-hospital mortality compared with PRS and GBS, according to the results of the ROC analysis.
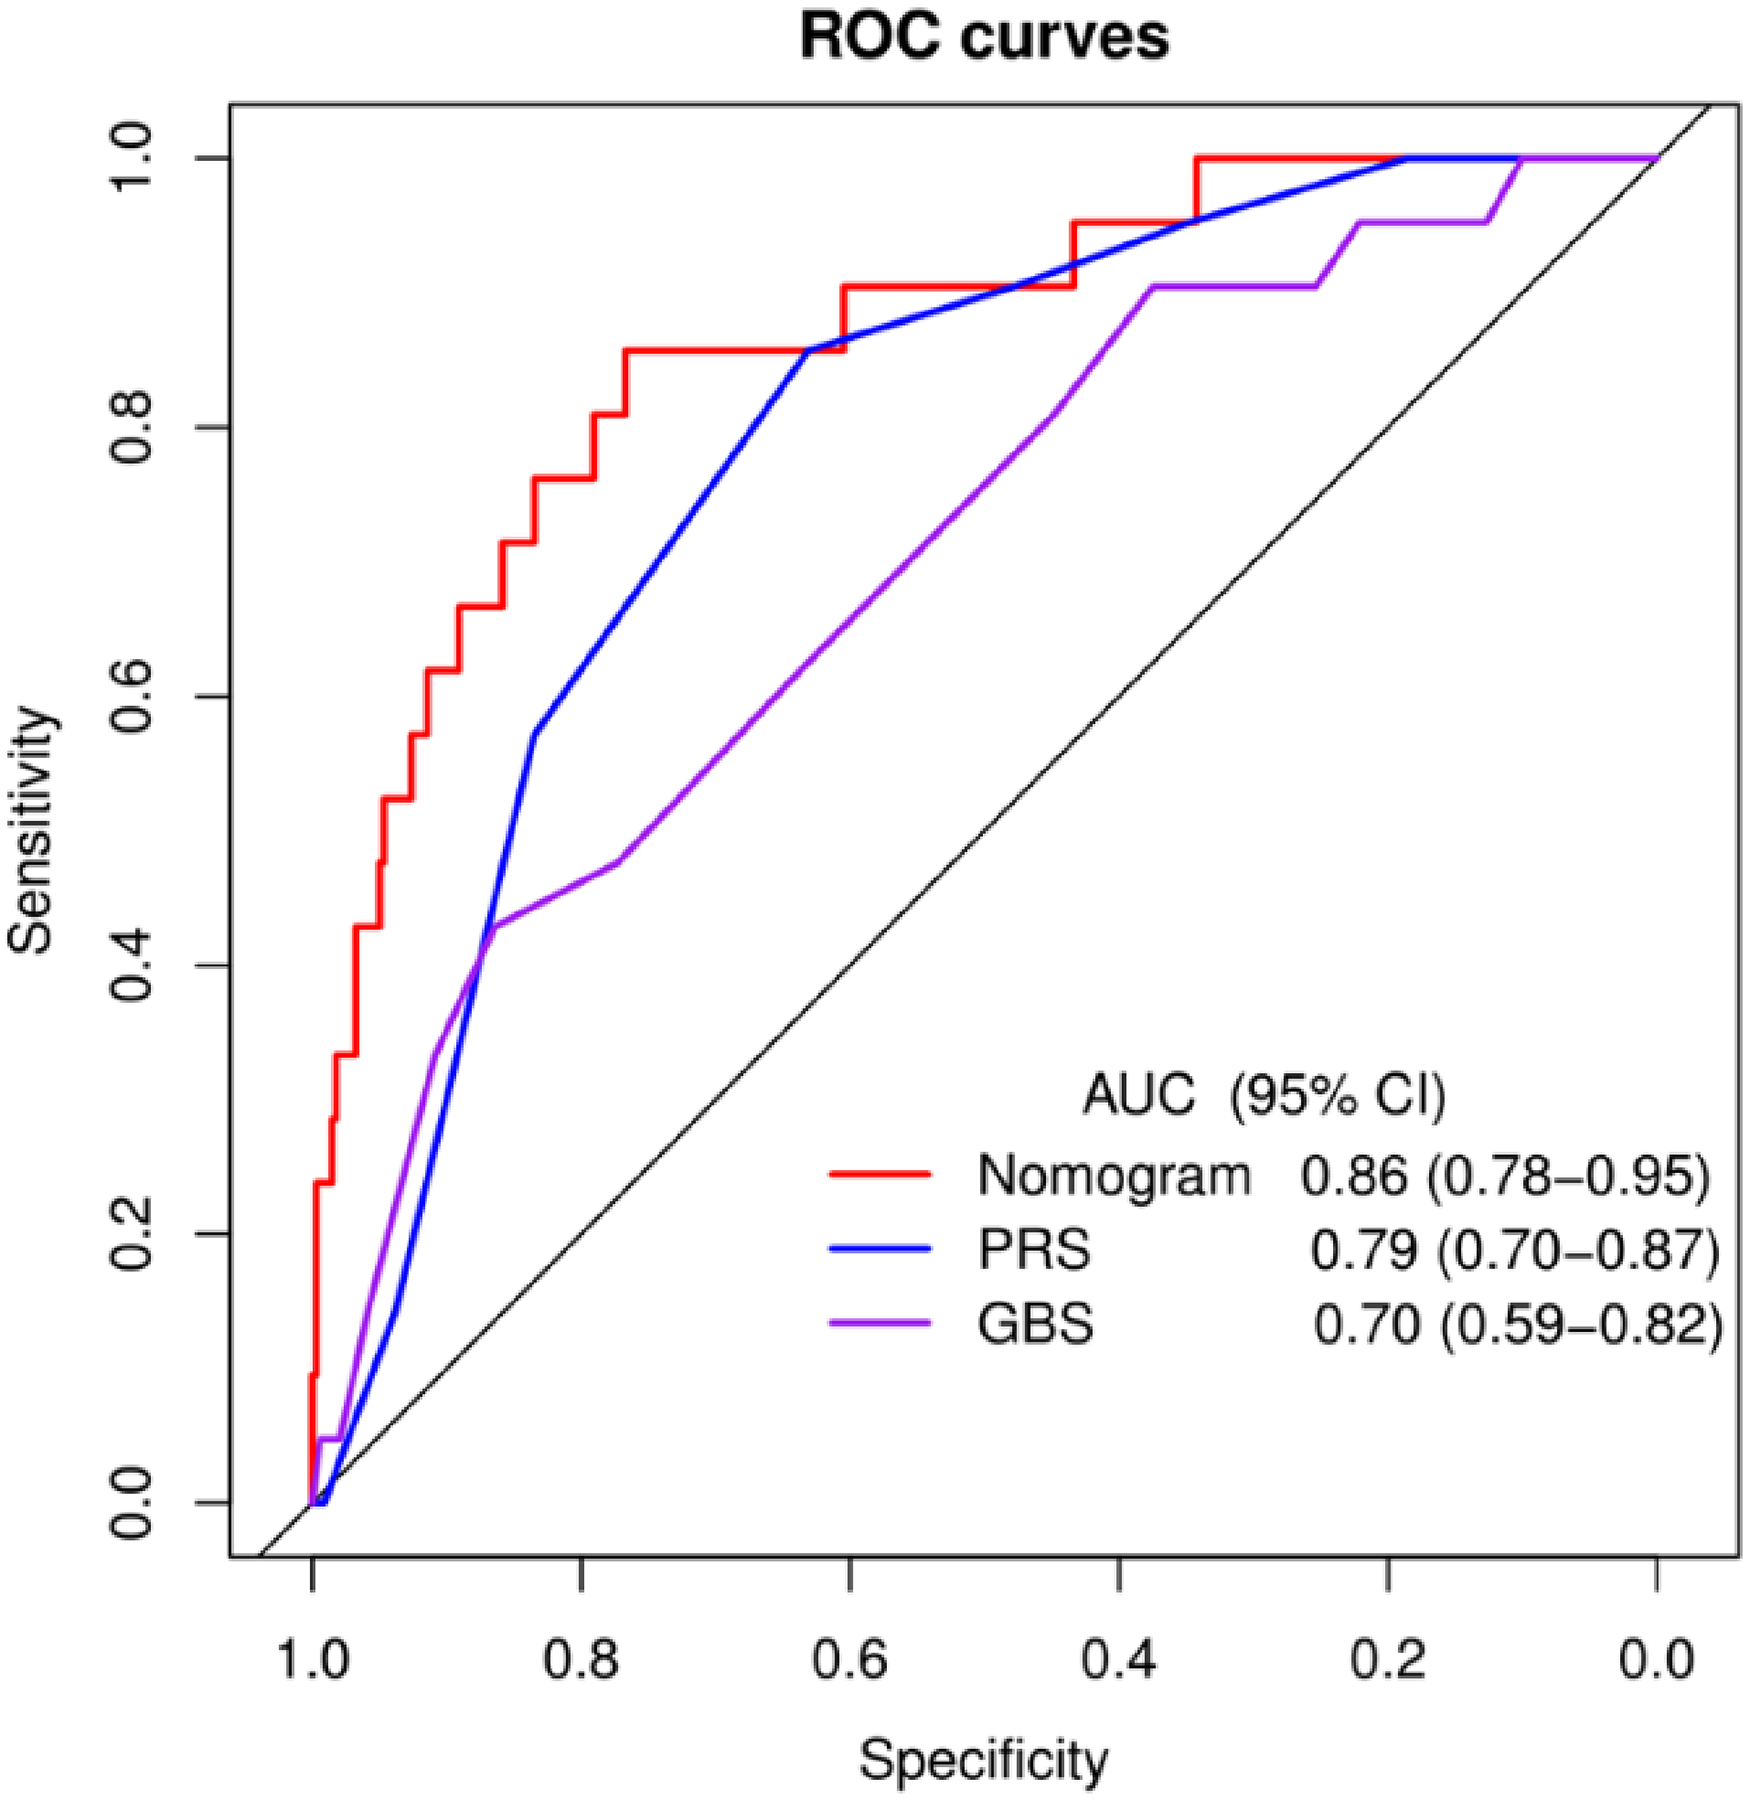
The ROC curves and the AUC of nomogram model, PRS and GBS. Abbreviations: AUC, area under the receiver operating characteristic curve; GBS, Glasgow-Blatchford Score; PRS, Pre-Endoscopic Rockall Score; ROC, receiver operating characteristic
The 80% and 95% CI regions of the GiViTI calibration bands did not cover the 45 degree diagonal divider (P = .858), indicating the consistency of the model’s predicted probabilities with the actual probabilities and the high reliability of the prediction model (Figure 5A).

(A) The GiViTI calibration plot of nomogram model (bootstrap 1000 repetitions); (B) the clinical decision curve analysis of nomogram model.
The DCA (Figure 5B) showed the clinical utility of the nomogram to predict in-hospital mortality of patients with UGIB. A horizontal line represents the intervention-none and the net benefit with 0, the oblique line shows intervention-all-patients. The DCA showed a high net benefit within threshold probability ranged from 10% to 60%, indicating that the model provides sound clinical guidance.
Discussion
In this study, RWD, PLT, pulse rate, and SpO2 at admission were found to be independent predictors of death during hospitalization in patients with UGIB, and a nomogram model was developed based on these blood biomarkers and vital signs on admission. The nomogram model was validated with ROC curves, calibration plots, and DCA curves and showed good performance.
UGIB is a common clinical emergency with an acute onset, poor prognosis, and high mortality rate. Several scoring systems for risk stratification of acute gastrointestinal bleeding such as PRS and GBS have been designed previously and they have shown good predictive value in clinical applications in the emergency department.5,6 In this study, we have created a more concise predictive model based on common blood biomarkers and baseline vital signs, which will enable emergency physicians to more quickly risk-stratify patients with UGIB and provide timely care to high-risk patients, with the aim of reducing mortality in patients with UGIB. In addition, we compared the predictive ability of this nomogram model with 2 common scoring systems (PRS and GBS) for UGIB. The ROC curve analysis showed that the nomogram model had stronger predictive power for the risk of death during hospitalization in patients with UGIB compared to PRS and GBS.
RDW reflects the degree of heterogeneity of erythrocyte volume, and is traditionally used for diagnosis of anemias. 7 In addition, RDW is considered to be a novel subclinical marker of inflammation.8–10 Many studies have shown that RDW varies during the course of some diseases and that it is considered to be an independent predictor of prognosis in some diseases. For example, higher levels of RWD are an independent predictor of disease-related deaths such as sepsis, intracerebral hemorrhage, heart failure, and cancer.11–14 Consistent with previous studies, our study showed that higher RDW was an independent risk factor for death during a patient's hospital stay, while we determined an optimal cut-off value for RDW (14.3%) based on RCS regression, with patients with higher levels of RDW having an 8.4 times (OR = 8.44; 95% CI: 1.77-89.10; P = .023) higher risk of death than those with lower levels of RDW. One possible explanation for this is that the elevated RDW may represent significant blood loss, which would undoubtedly increase the risk of death.
In the optimal model selected based on AIC, we included PLT in the prediction model. As we know, the loss of large amounts of blood causes a decrease in platelet levels, which may explain the use of platelets as a predictor of death in patients with UGIB.
Pulse rate and SpO2 are common and easily obtained vital signs. In the general population, pulse rate and heart rate are the same and can be substituted for heart rate. The pulse rate is an important indicator of the degree of blood loss, and an increased pulse rate is a compensatory expression of the increased cardiac output during massive blood loss. Consistent with previous studies that have identified pulse rate as an important prognostic factor for UGIB,5,15 this study found that pulse rate was an independent predictor of UGIB-related mortality.
SpO2 is a common indicator for evaluating oxygenation and has the characteristics of a noninvasive, continuous measurement. A fall in SpO2 usually means the onset of hypoxemia, which reflects inadequate levels of tissue and organ perfusion and a decline in cardiorespiratory function. Furthermore, reduced SpO2 has been shown to be a risk prognostic factor for progression in a variety of diseases,16–18 in addition, the optimal range of SpO2 reduces hospital mortality in patients. 19 This study found that decreased SpO2 was an independent risk factor for death during hospitalization in patients with UGIB. Being able to use noninvasive tests such as SpO2 and pulse rate to predict the prognosis of patients with UGIB is of positive significance.
In this study, we developed a model for predicting death in patients with UGIB during hospitalization based on blood biomarkers and baseline vital signs at admission, which showed good predictive performance and clinical utility. The predictors in this model are readily available and inexpensive, which greatly extends its applicability to primary hospitals and remote rural areas in Asian countries with uneven distribution of healthcare resources, where doctors or nurses can use the model to quickly and accurately determine the risk of death in patients with UGIB and provide timely treatment, which may reduce mortality.
This study also has some limitations. Firstly, although the prediction model developed in this study was internally validated and performed well, it lacked external validation. Secondly, the sample size for the positive outcome (death during hospitalization) included in this study was small and future validation in a large multicentre study is needed. Finally, this was a retrospective and observational study and although we performed a multifactorial stepwise regression to eliminate confounding factors, there may still be bias due to unknown confounders.
Conclusions
This study identified independent predictors of in-hospital mortality in patients with UGIB, developed a clinical prediction model, and used a nomogram to visualize the model. The prediction model was validated to have good discrimination, calibration, and clinical utility. The model allows for rapid risk stratification of patients with UGIB and provides a basis for individualized treatment. Large prospective cohort studies are still needed to validate and refine this model.
Footnotes
Acknowledgment
The authors thank Dr. Lee from Konkuk University Hospital for sharing the data.
Author Contributions
Wensen Yao designed the study. Longbin Yuan and Wensen Yao analyzed the data and were involved in writing the manuscript.
Declaration of Conflicting Interests
The authors declared no potential conflicts of interest with respect to the research, authorship, and/or publication of this article.
Ethics Approval
The Institutional Review Board of Konkuk University Hospital approved the study protocol (KUH-1260014).
Funding
The authors received no financial support for the research, authorship, and/or publication of this article.