
Abstract
As a major global health concern, coronary artery disease (CAD) demands precise, noninvasive diagnostic methods like cardiopulmonary exercise testing (CPET) for effective assessment and management, balancing the need for accurate disease severity evaluation with improved treatment decision-making. Our objective was to develop and validate a nomogram based on CPET parameters for noninvasively predicting the severity of CAD, thereby assisting clinicians in more effectively assessing patient conditions. This study analyzed 525 patients divided into training (367) and validation (183) cohorts, identifying key CAD severity indicators using least absolute shrinkage and selection operator (LASSO) regression. A predictive nomogram was developed, evaluated by average consistency index (C-index), the area under the receiver operating characteristic curve (AUC), calibration curve, and decision curve analysis (DCA), confirming its reliability and clinical applicability. In our study, out of 25 variables, 6 were identified as significant predictors for CAD severity. These included age (OR = 1.053, P < .001), high-density lipoprotein (HDL, OR = 0.440, P = .002), hypertension (OR = 2.050, P = .007), diabetes mellitus (OR = 3.435, P < .001), anaerobic threshold (AT, OR = 0.837, P < .001), and peak kilogram body weight oxygen uptake (VO2/kg, OR = 0.872, P < .001). The nomogram, based on these predictors, demonstrated strong diagnostic accuracy for assessing CAD severity, with AUC values of 0.939 in the training cohort and 0.840 in the validation cohort, and also exhibited significant clinical utility. The nomogram, which is based on CPET parameters, was useful for predicting the severity of CAD and assisted in risk stratification by offering a personalized, noninvasive diagnostic approach for clinicians.
Introduction
As a leading cause of mortality globally, coronary artery disease (CAD)—characterized by the narrowing or blockage of blood vessel lumens—imposes significant economic and health burdens. 1 Effective management of CAD hinges on accurately assessing the severity of coronary artery constriction and selecting appropriate treatment strategies. 2 Invasive coronary angiography (ICA) is the gold standard for diagnosing CAD and identifying the presence and severity of arterial stenosis. 3 This invasive procedure, while effective, carries significant drawbacks including high radiation exposure, substantial costs, and the risk of pseudoaneurysm formation. Additionally, ICA may not be suitable for specific cases like patients with acute coronary syndromes and chronic kidney disease. 4 While coronary computed tomographic angiography is a noninvasive method for assessing CAD, it struggles to reveal key high-risk plaque elements like macrophage activity, neovascularization, plaque rupture, or erosion. This drawback limits its capacity for accurately identifying patients at high risk of future cardiovascular events. 5 Therefore, the development of a new noninvasive technique to accurately assess the severity of CAD is of pressing importance.
Cardiopulmonary exercise testing (CPET), a noninvasive tool, effectively assesses the body's exercise response, combining exercise data with cardiac function recordings to measure diverse cardiorespiratory variables. 6 It offers high diagnostic accuracy, valuable prognostic insights, precise aerobic capacity assessment, and deep understanding of cardiorespiratory fitness.7,8 CPET is instrumental in evaluating heart failure patients’ cardiac function and prognosis, and in determining the need for cardiac transplantation.9,10 Its use has significantly expanded in the past decade, particularly in assessing CAD, providing diagnostic and prognostic information crucial for patient management.11,12 Traditional exercise stress tests, aimed at identifying obstructive CAD for revascularization purposes, lack objective quantitative analysis crucial for interventional decisions. 13 However, CPET's capacity for comprehensive evaluation of metabolic and cardiopulmonary changes, objectively quantified, adds value to CAD assessment and prognosis.14–17 Nomograms have gained recognition as valuable clinical tools for forecasting clinical events and outcomes. These graphical predictive models integrate various clinical variables, enabling precise quantitative risk assessments for specific events. 18 Currently, to our knowledge, there exists no established model predicting the severity of CAD based on CPET, helping clinicians assess the patient's condition.
Hence, our objective was to develop and validate a nomogram based on CPET parameters for noninvasively predicting the severity of CAD, thereby assisting clinicians in more effectively assessing patient conditions.
Methods
This retrospective study was approved by the Ethics Committee of The First Hospital of Xingtai (Approval No: 2022-17) and carried out in accordance with the Declaration of Helsinki. Informed consent was obtained from all participants involved in the study.
Study Population
Eligibility for this study was determined based on the following inclusion criteria: individuals aged 18 years or older; diagnosis of CAD confirmed by ICA; and completion of CPET. Exclusion criteria included chronic heart failure, unstable angina, recent acute coronary syndrome, uncontrolled hypertension and diabetes, anemia, respiratory disease, and insufficient data. The study ultimately encompassed 525 patients. The training cohort, comprising 367 patients, was recruited from January 2021 to June 2022, while the validation cohort, consisting of 183 patients, was gathered from July 2022 to January 2023, as depicted in Figure 1. All participants were clinically stable and did not engage in regular exercise.
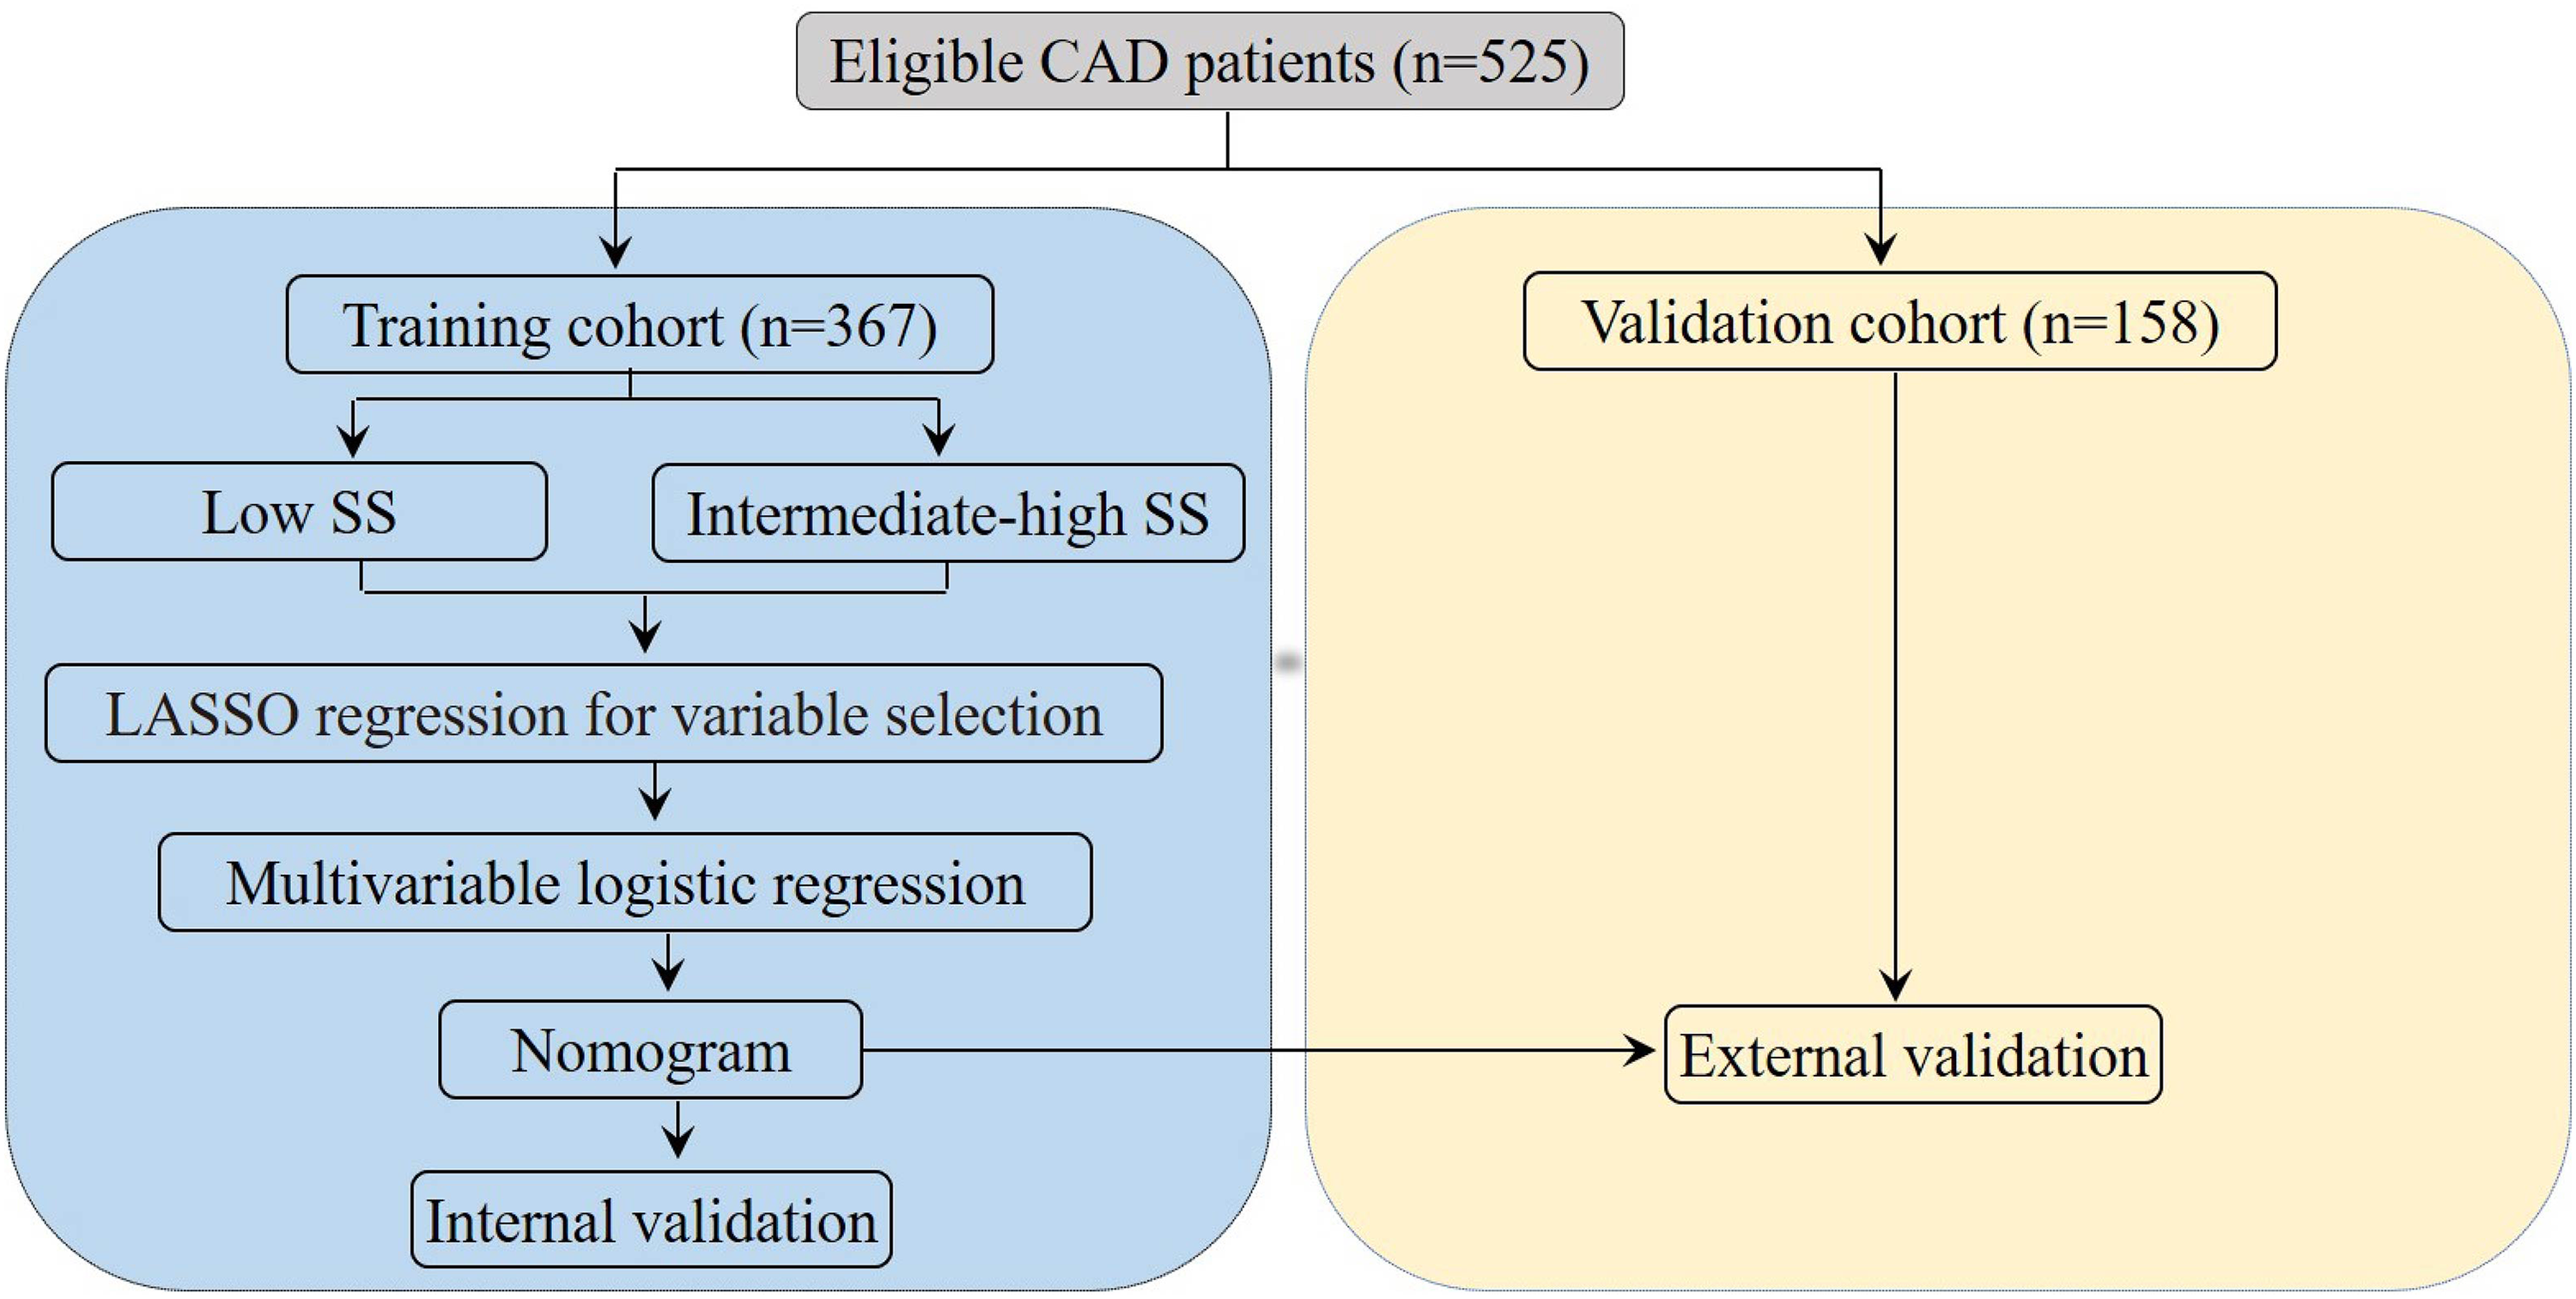
Flow diagram of study design. Abbreviations: CAD, coronary artery disease; SS, SYNTAX score; LASSO, least absolute shrinkage and selection operator.
Data Collection
Baseline clinical data, extracted from patient hospital records, included age, gender, body mass index (BMI), lipid profiles (low-density lipoprotein [LDL], high-density lipoprotein [HDL], triglycerides, total cholesterol), hemoglobin A1c (HbA1c), left ventricle ejection fraction (LVEF), and lifestyle factors (smoking, drinking). This data also encompassed medical history (hypertension, diabetic mellitus), medication use, and CPET results.
Assessment of the CAD Severity
The SYNTAX score (SS) for each patient was determined using the SYNTAX calculator software available at www.syntaxscore.com. Only coronary artery lesions with over 50% stenosis, visually assessed, and a diameter of 1.5 mm or more were included in the SS calculation. This score was computed by summing the scores of all relevant lesions. Based on their SSs, participants were categorized into two groups: those with a low SS (<23) and those with an intermediate-high SS (≥23). A higher SS indicates a more severe disease. 19
CPET
Prior to ICA, each patient underwent CPET to assess cardiorespiratory status and preliminarily evaluate coronary artery lesion severity, based on electrocardiogram readings, symptoms like chest tightness and pain, and other CPET parameters. CPET involved a personalized ramp exercise protocol on a cycle ergometer, designed to reach peak exercise in about 10 min until exhaustion. This included a 3-min rest for stabilizing gas exchange variables, followed by 3 min of freewheel pedaling, and then a gradual workload increase tailored to each patient's exercise capacity. Post-exercise, a 5-min recovery period was observed. Ventilation and gas exchange measurements were performed using a metabolic cart, while heart rate, a 12-lead electrocardiogram, blood pressure, and pulse oximetry were continuously monitored. The test was symptom-limited or stopped based on specific criteria like respiratory exchange ratio (RER) ≥ 1.15, hypertensive response (≥220/110 mmHg), or ≥3 mm ST depression in two adjacent leads.
Statistical Analysis
Statistical analysis was conducted using R software (version 4.1.2). For normal continuous variables, we presented data as means ± standard deviations, employing t-tests for two-group comparisons. In contrast, non-normal continuous variables were depicted as medians and interquartile ranges (IQR), analyzed using the Mann–Whitney U-test for similar comparisons. Additionally, Pearson's Chi-square test was utilized for the analysis of categorical data.
In this research, we developed our model using the training dataset, with internal validation performed on the training cohort and external validation on the validation cohort. The “glmnet” package facilitated the least absolute shrinkage and selection operator (LASSO) regression, incorporating a 10-fold cross-validation to determine the optimal lambda value. The chosen lambda.lse, yielding the best performance with the fewest variables, was based on cross-validation outcomes. Subsequently, logistic regression analysis was conducted using the “rms” package. This analysis included variables identified by LASSO regression to construct a multivariable logistic regression model. For each variable, odds ratios (OR) and 95% confidence intervals (CI) were calculated. All statistical significance assessments were two-sided. Finally, using the “rms” package, a predictive nomogram was created, incorporating statistically significant variables identified earlier.
To evaluate our model, we used the bootstrap method with 1000 resamples. The discrimination of the nomogram was assessed by the average consistency index (C-index). Calibration was evaluated using a calibration curve. The predictive ability was gauged through the area under the curve (AUC) in receiver operating characteristic (ROC) curve analyses. Additionally, decision curve analysis (DCA) was conducted to ascertain the clinical applicability of our nomogram by estimating net benefits across various threshold probabilities. Statistical significance was established at a P-value of <.05.
Results
Participant Characteristics
Table 1 presented the characteristics of participants in both the training and validation cohorts. The study included a total of 525 participants, with 367 allocated to the training group and 158 to the validation group. Notably, there were no statistically significant differences between the two groups across all variables. Table 2 summarized the clinical characteristics of the training cohort, comprising 231 patients (62.9%) with low SSs and 136 patients (37.1%) with intermediate-high SSs.
Baseline Characteristics of Patients in the Training and Validation Cohorts.
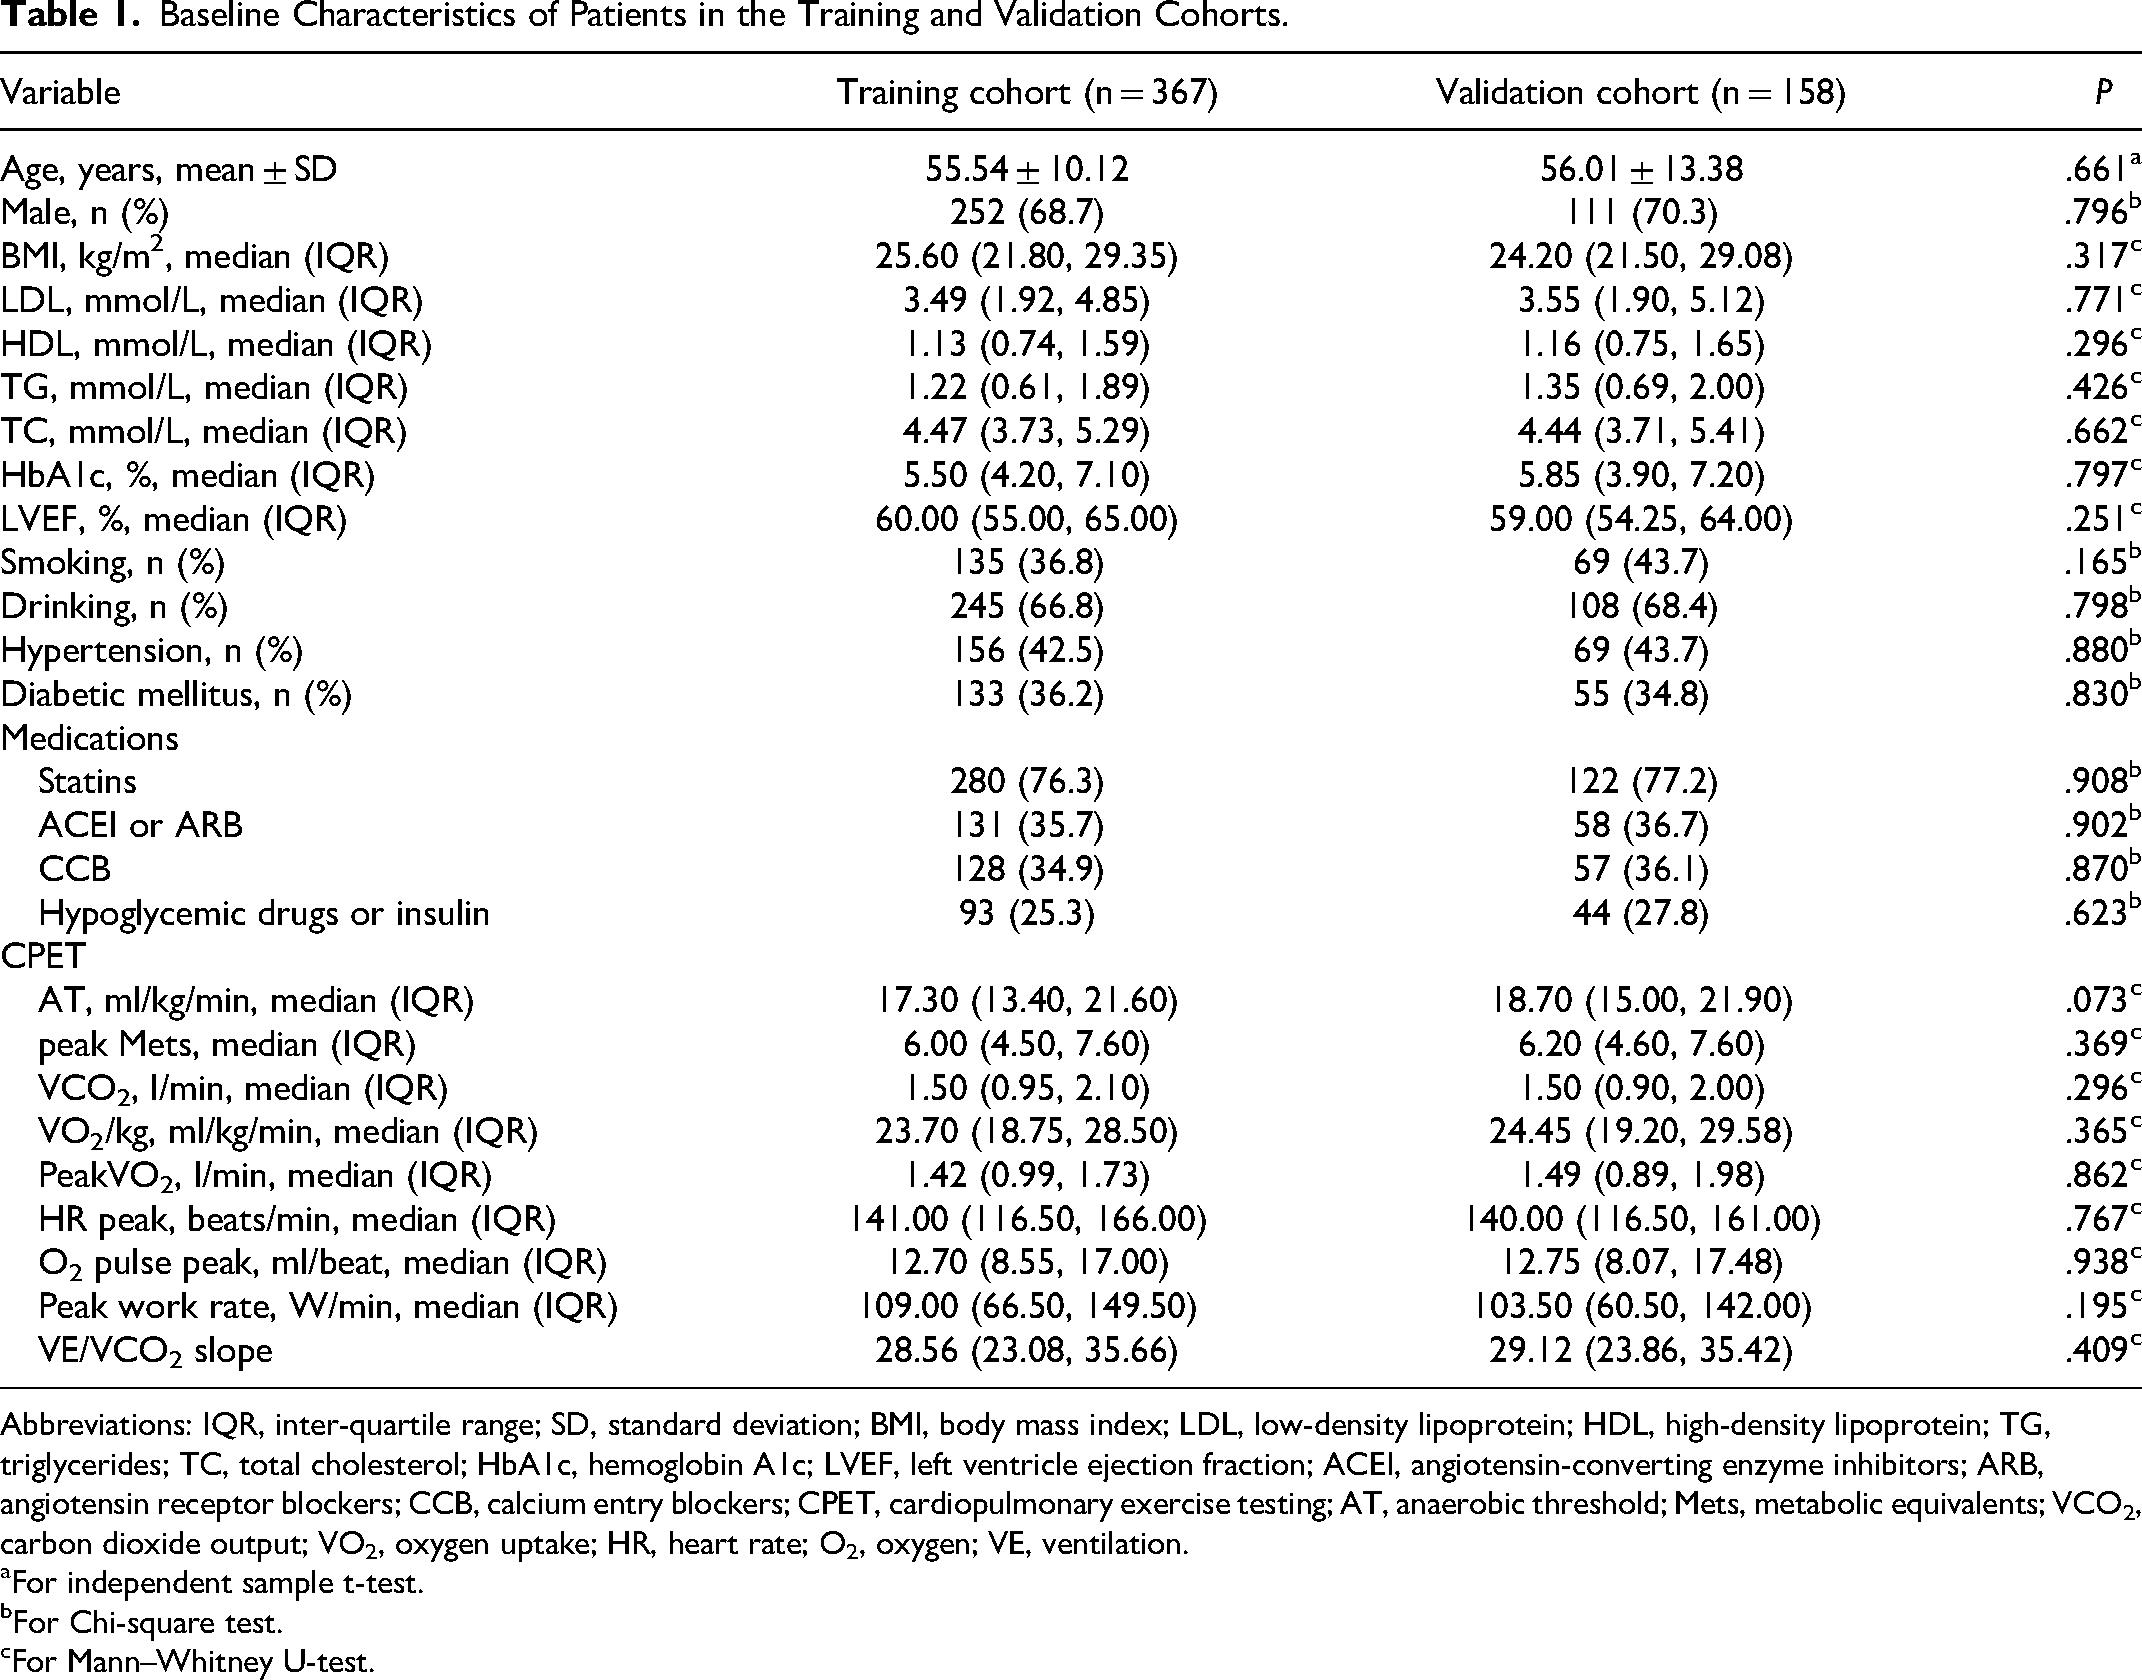
Abbreviations: IQR, inter-quartile range; SD, standard deviation; BMI, body mass index; LDL, low-density lipoprotein; HDL, high-density lipoprotein; TG, triglycerides; TC, total cholesterol; HbA1c, hemoglobin A1c; LVEF, left ventricle ejection fraction; ACEI, angiotensin-converting enzyme inhibitors; ARB, angiotensin receptor blockers; CCB, calcium entry blockers; CPET, cardiopulmonary exercise testing; AT, anaerobic threshold; Mets, metabolic equivalents; VCO2, carbon dioxide output; VO2, oxygen uptake; HR, heart rate; O2, oxygen; VE, ventilation.
For independent sample t-test.
For Chi-square test.
For Mann–Whitney U-test.
Baseline Characteristics of Patients Between the Low SSs Group and Intermediate-High SSs Group in the Training Cohort.
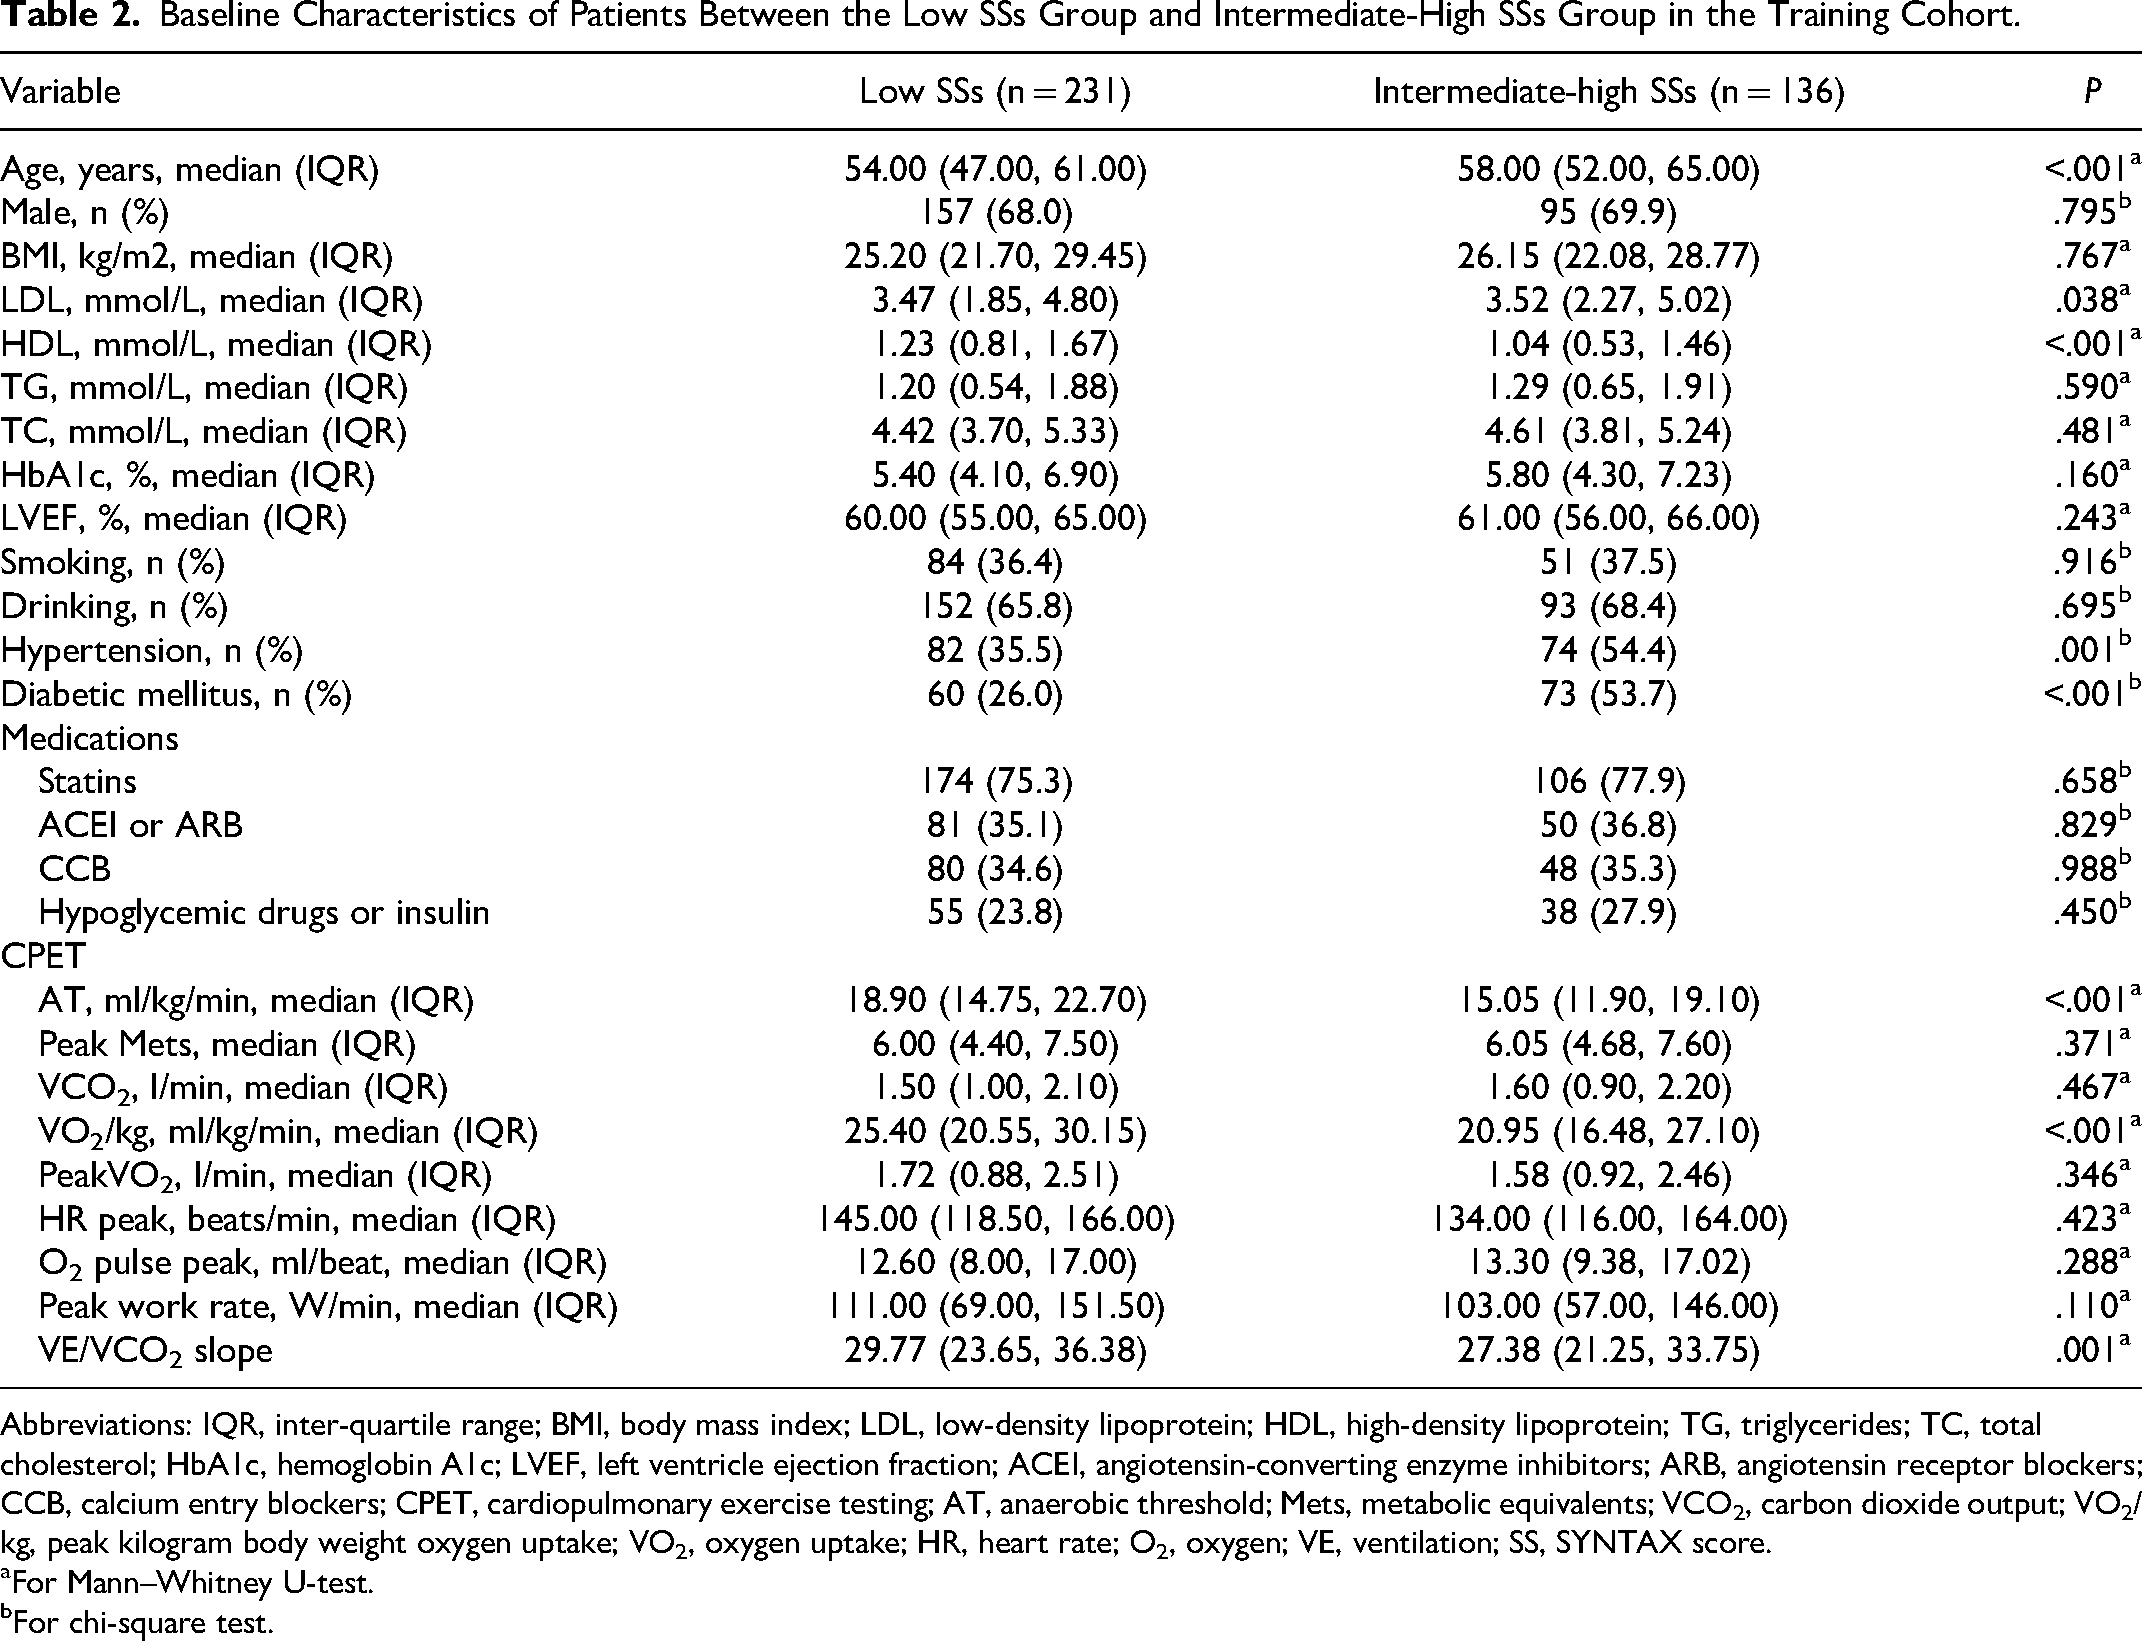
Abbreviations: IQR, inter-quartile range; BMI, body mass index; LDL, low-density lipoprotein; HDL, high-density lipoprotein; TG, triglycerides; TC, total cholesterol; HbA1c, hemoglobin A1c; LVEF, left ventricle ejection fraction; ACEI, angiotensin-converting enzyme inhibitors; ARB, angiotensin receptor blockers; CCB, calcium entry blockers; CPET, cardiopulmonary exercise testing; AT, anaerobic threshold; Mets, metabolic equivalents; VCO2, carbon dioxide output; VO2/kg, peak kilogram body weight oxygen uptake; VO2, oxygen uptake; HR, heart rate; O2, oxygen; VE, ventilation; SS, SYNTAX score.
For Mann–Whitney U-test.
For chi-square test.
Selection of Independent Predictors of Intermediate-High SS
In the training cohort, out of 25 evaluated factors encompassing demographics, laboratory results, anthropometrics, lifestyles, comorbidities, and medication use, six were identified as significant predictors of intermediate-high SS. As illustrated in Figure 2A and B, these predictors include age, HDL, hypertension, diabetes mellitus, anaerobic threshold (AT), and peak kilogram body weight oxygen uptake (VO2/kg).
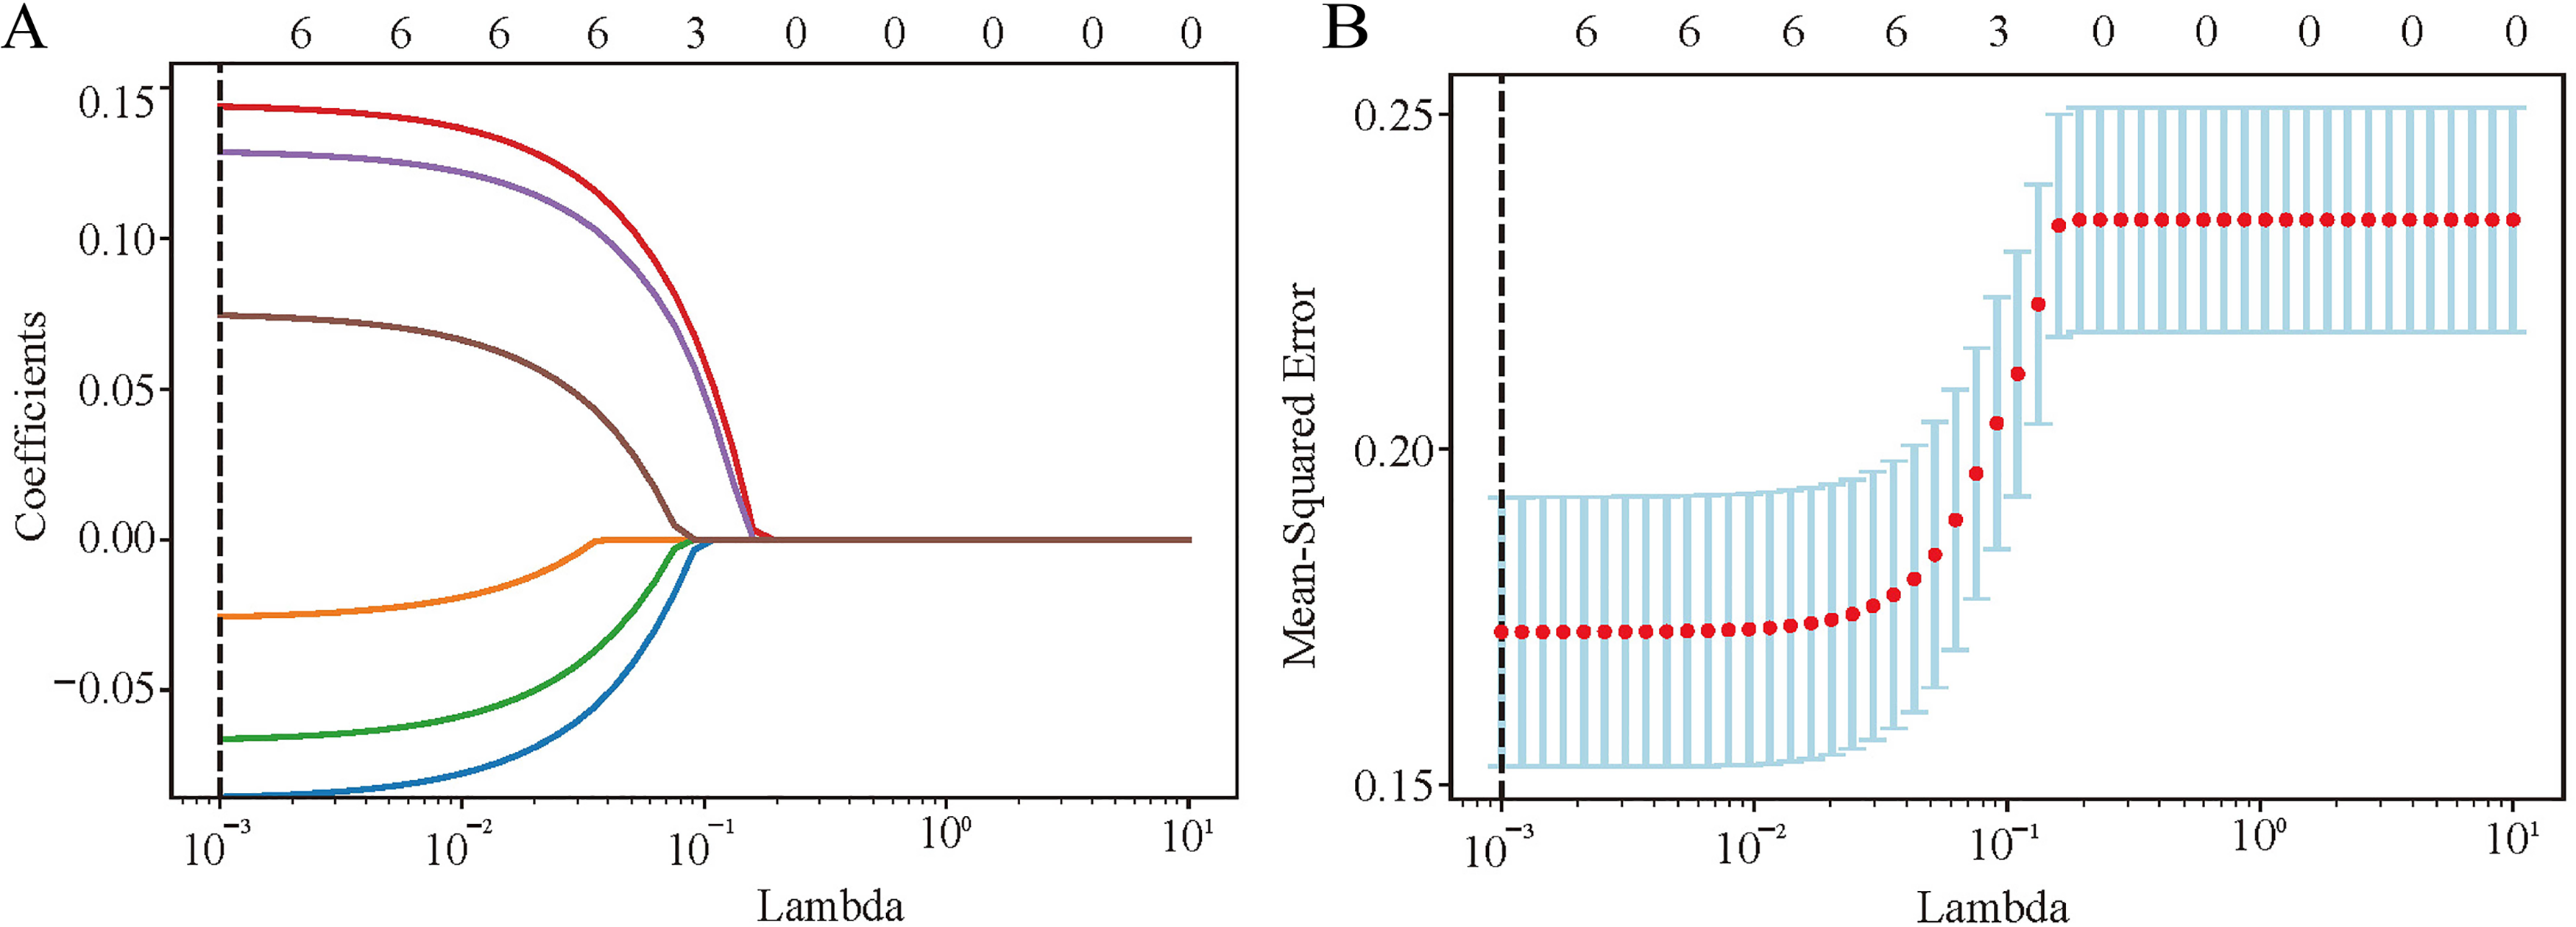
Factor selection using the LASSO logistic regression. (A) LASSO coefficient profiles were plotted against the lambda values. (B) Repeat 50 times of 10-fold cross-validation process to identification the optimal penalization coefficient lambda in the LASSO model and 6 nonzero coefficients were obtained according to the lambda. The red dots represent the mean value of the target parameters. Abbreviations: LASSO, least absolute shrinkage and selection operator.
Construction of a New Predictive Model of Intermediate-High SS
Following LASSO regression analysis, we identified 6 optimal variables out of the initial 25. Subsequently, these variables were employed in a multivariate logistic regression to formulate a new predictive model. The logistic regression results in Table 3 revealed that all six predictors—age (OR = 1.053, P < .001), HDL (OR = 0.440, P = .002), hypertension (OR = 2.050, P = .007), diabetic mellitus (OR = 3.435, P < .001), AT (OR = 0.837, P < .001), and VO2/kg (OR = 0.872, P < .001)—were statistically significant. These independent predictors were then integrated to construct a nomogram, depicted in Figure 3, which quantified the intermediate-high risk of SS.
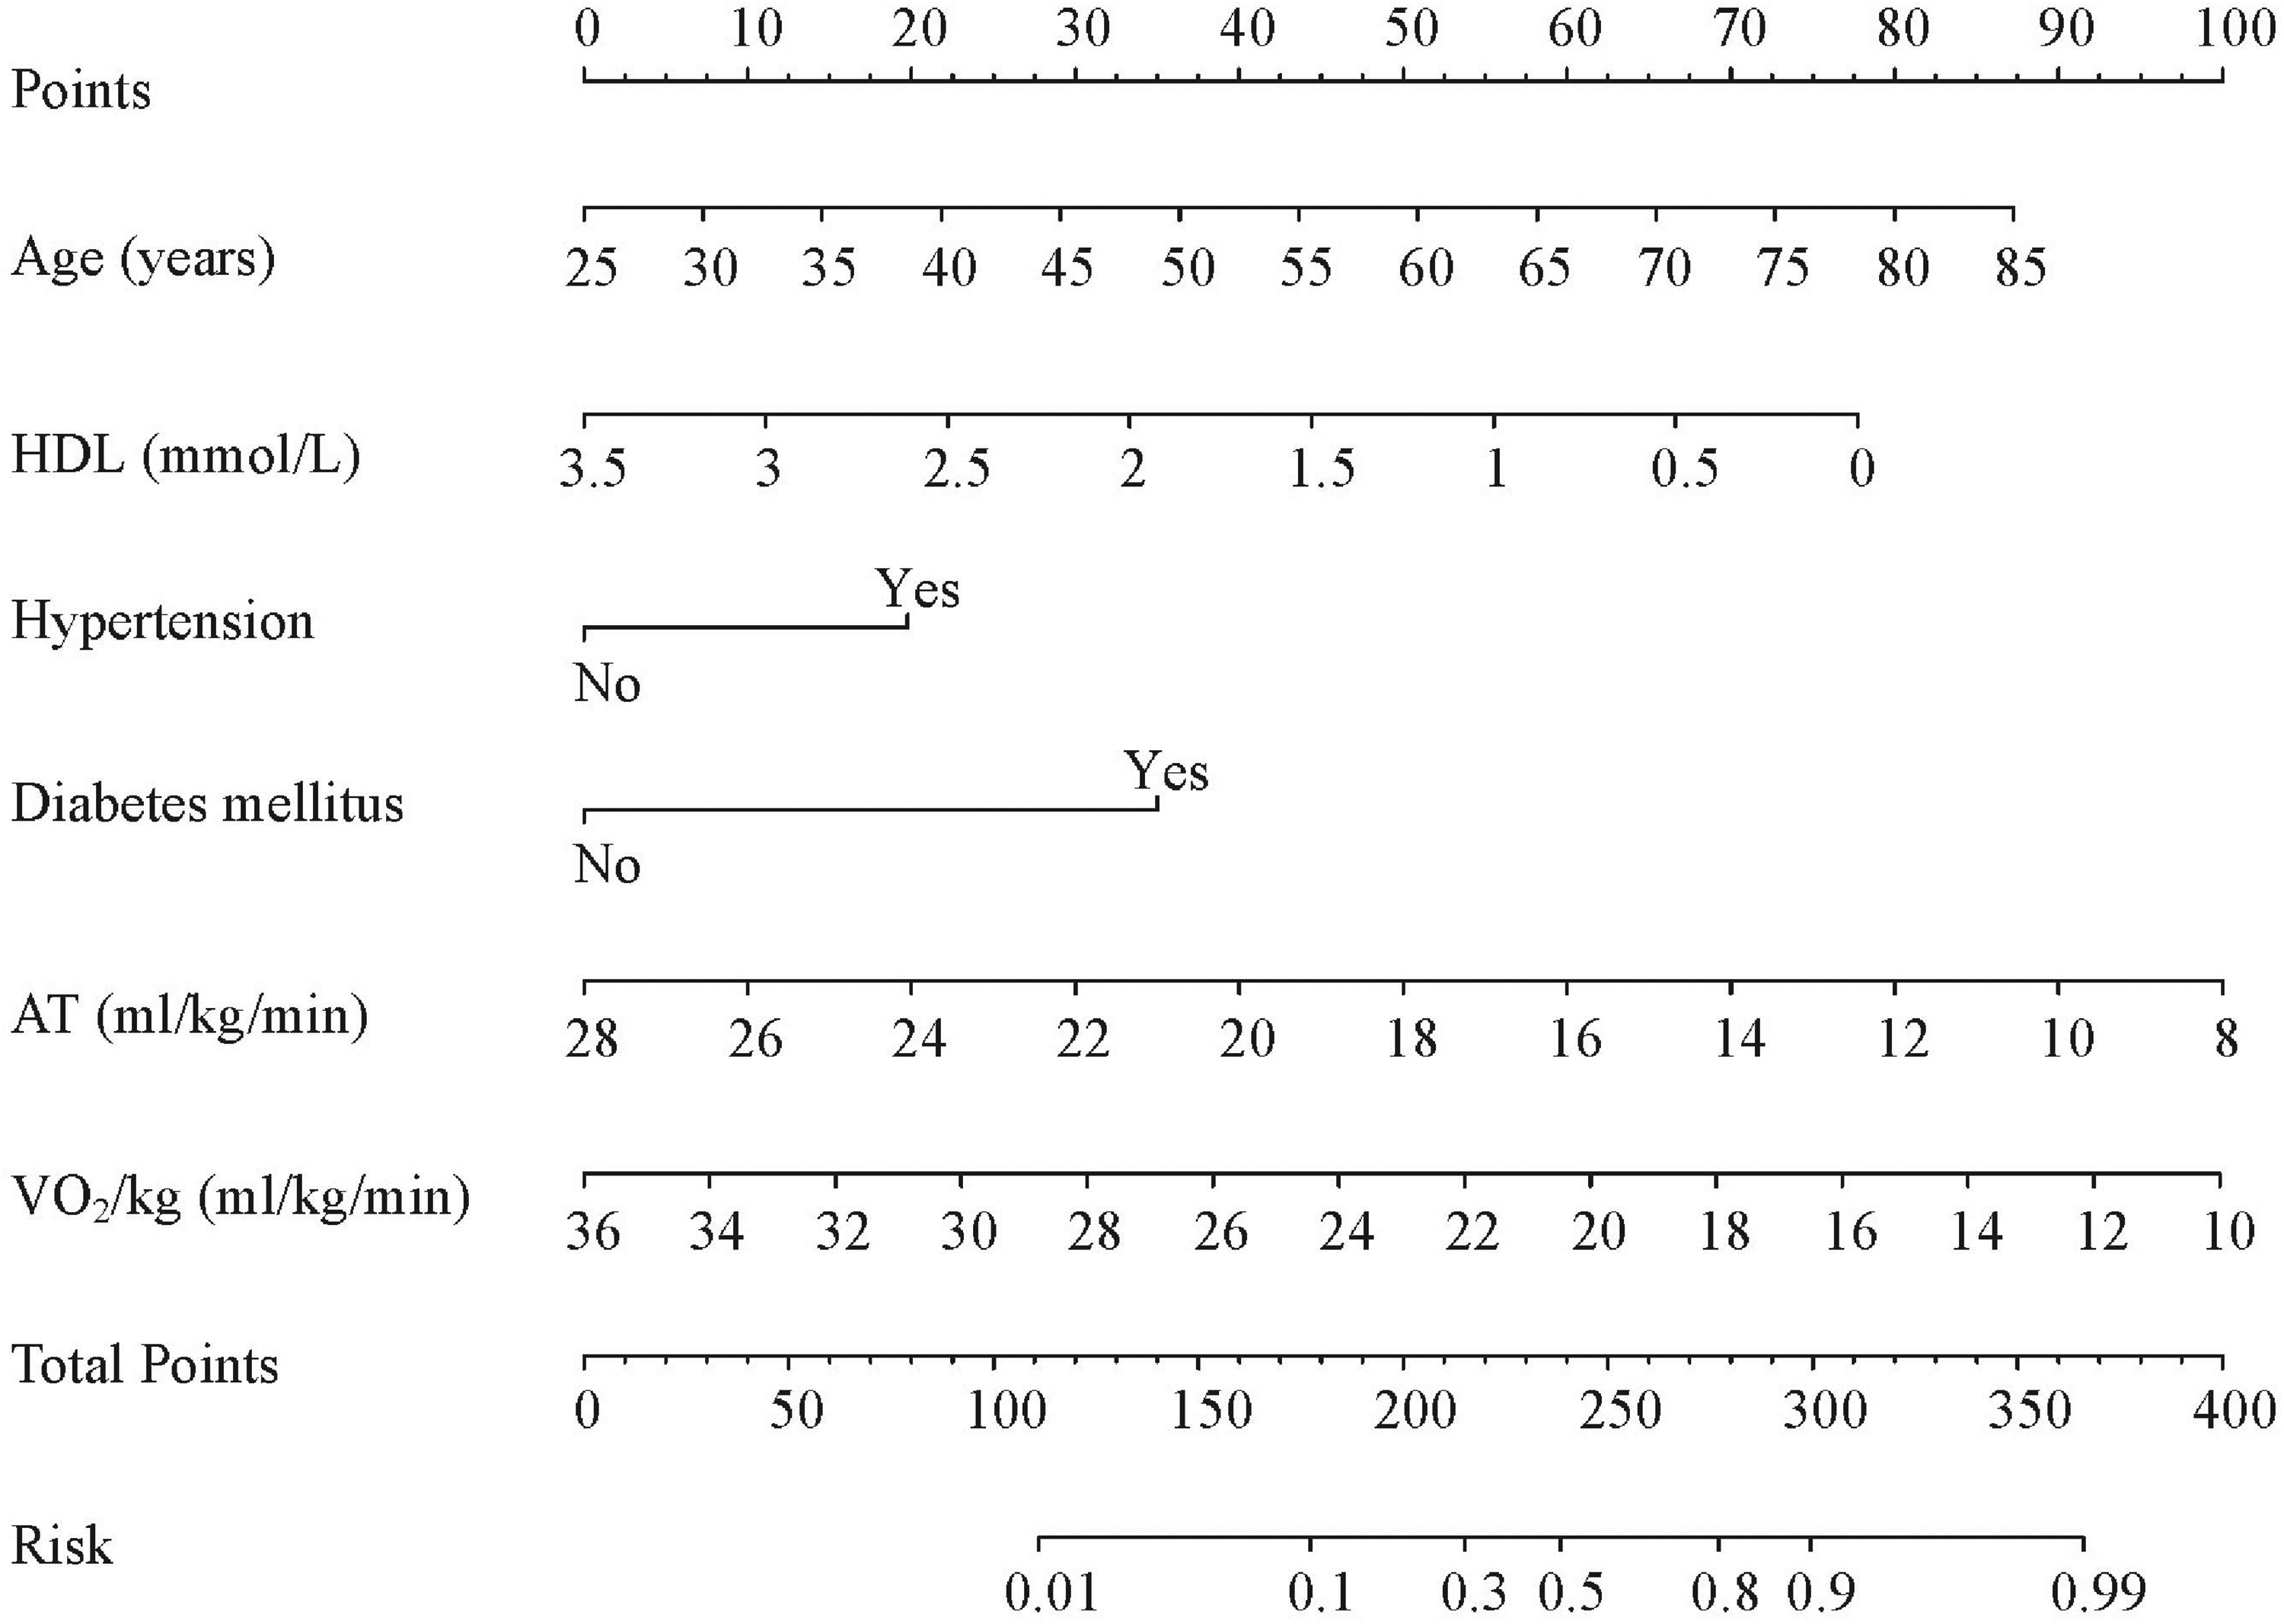
A nomogram to predict the probability of intermediate-high SS risk in CAD patients. Abbreviations: HDL, high-density lipoprotein; AT, anaerobic threshold; VO2/kg, peak kilogram body weight oxygen uptake; CAD, coronary artery disease; SS, SYNTAX score.
Multivariate Analysis of Independent Predictors for Intermediate-High SYNTAX Score in CAD Patients.
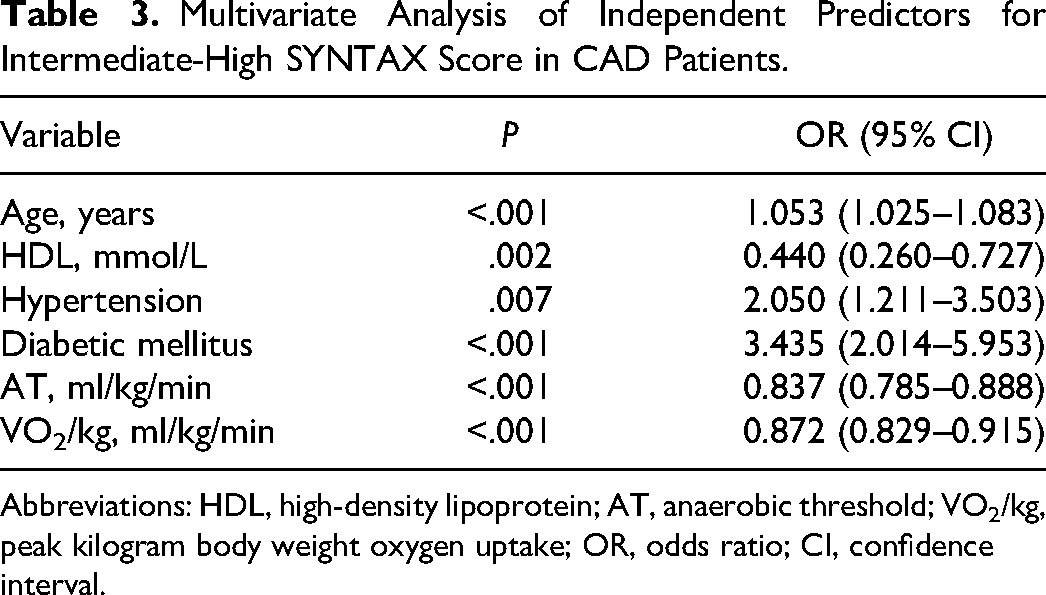
Abbreviations: HDL, high-density lipoprotein; AT, anaerobic threshold; VO2/kg, peak kilogram body weight oxygen uptake; OR, odds ratio; CI, confidence interval.
Performance of the Nomogram Model
The nomogram's bias-corrected C-index was 0.901 (95% CI: 0.851-0.916) in the training cohort and 0.828 (95% CI: 0.804-0.851) in the validation cohort, demonstrating its high accuracy. Calibration plots in both cohorts revealed an excellent match between the observed and predicted intermediate-high risk of SS (Figure 4). ROC curve analyses (Figure 5) yielded AUCs of 0.939 for the training cohort and 0.840 for the validation cohort, confirming the nomogram's acceptable predictive precision. Additionally, DCA indicated that using the nomogram to predict intermediate-high risk of SS was more beneficial when the threshold probability was over 0.10 in the training cohort and over 0.20 in the validation cohort. This suggested significant clinical utility, as depicted in Figure 6.
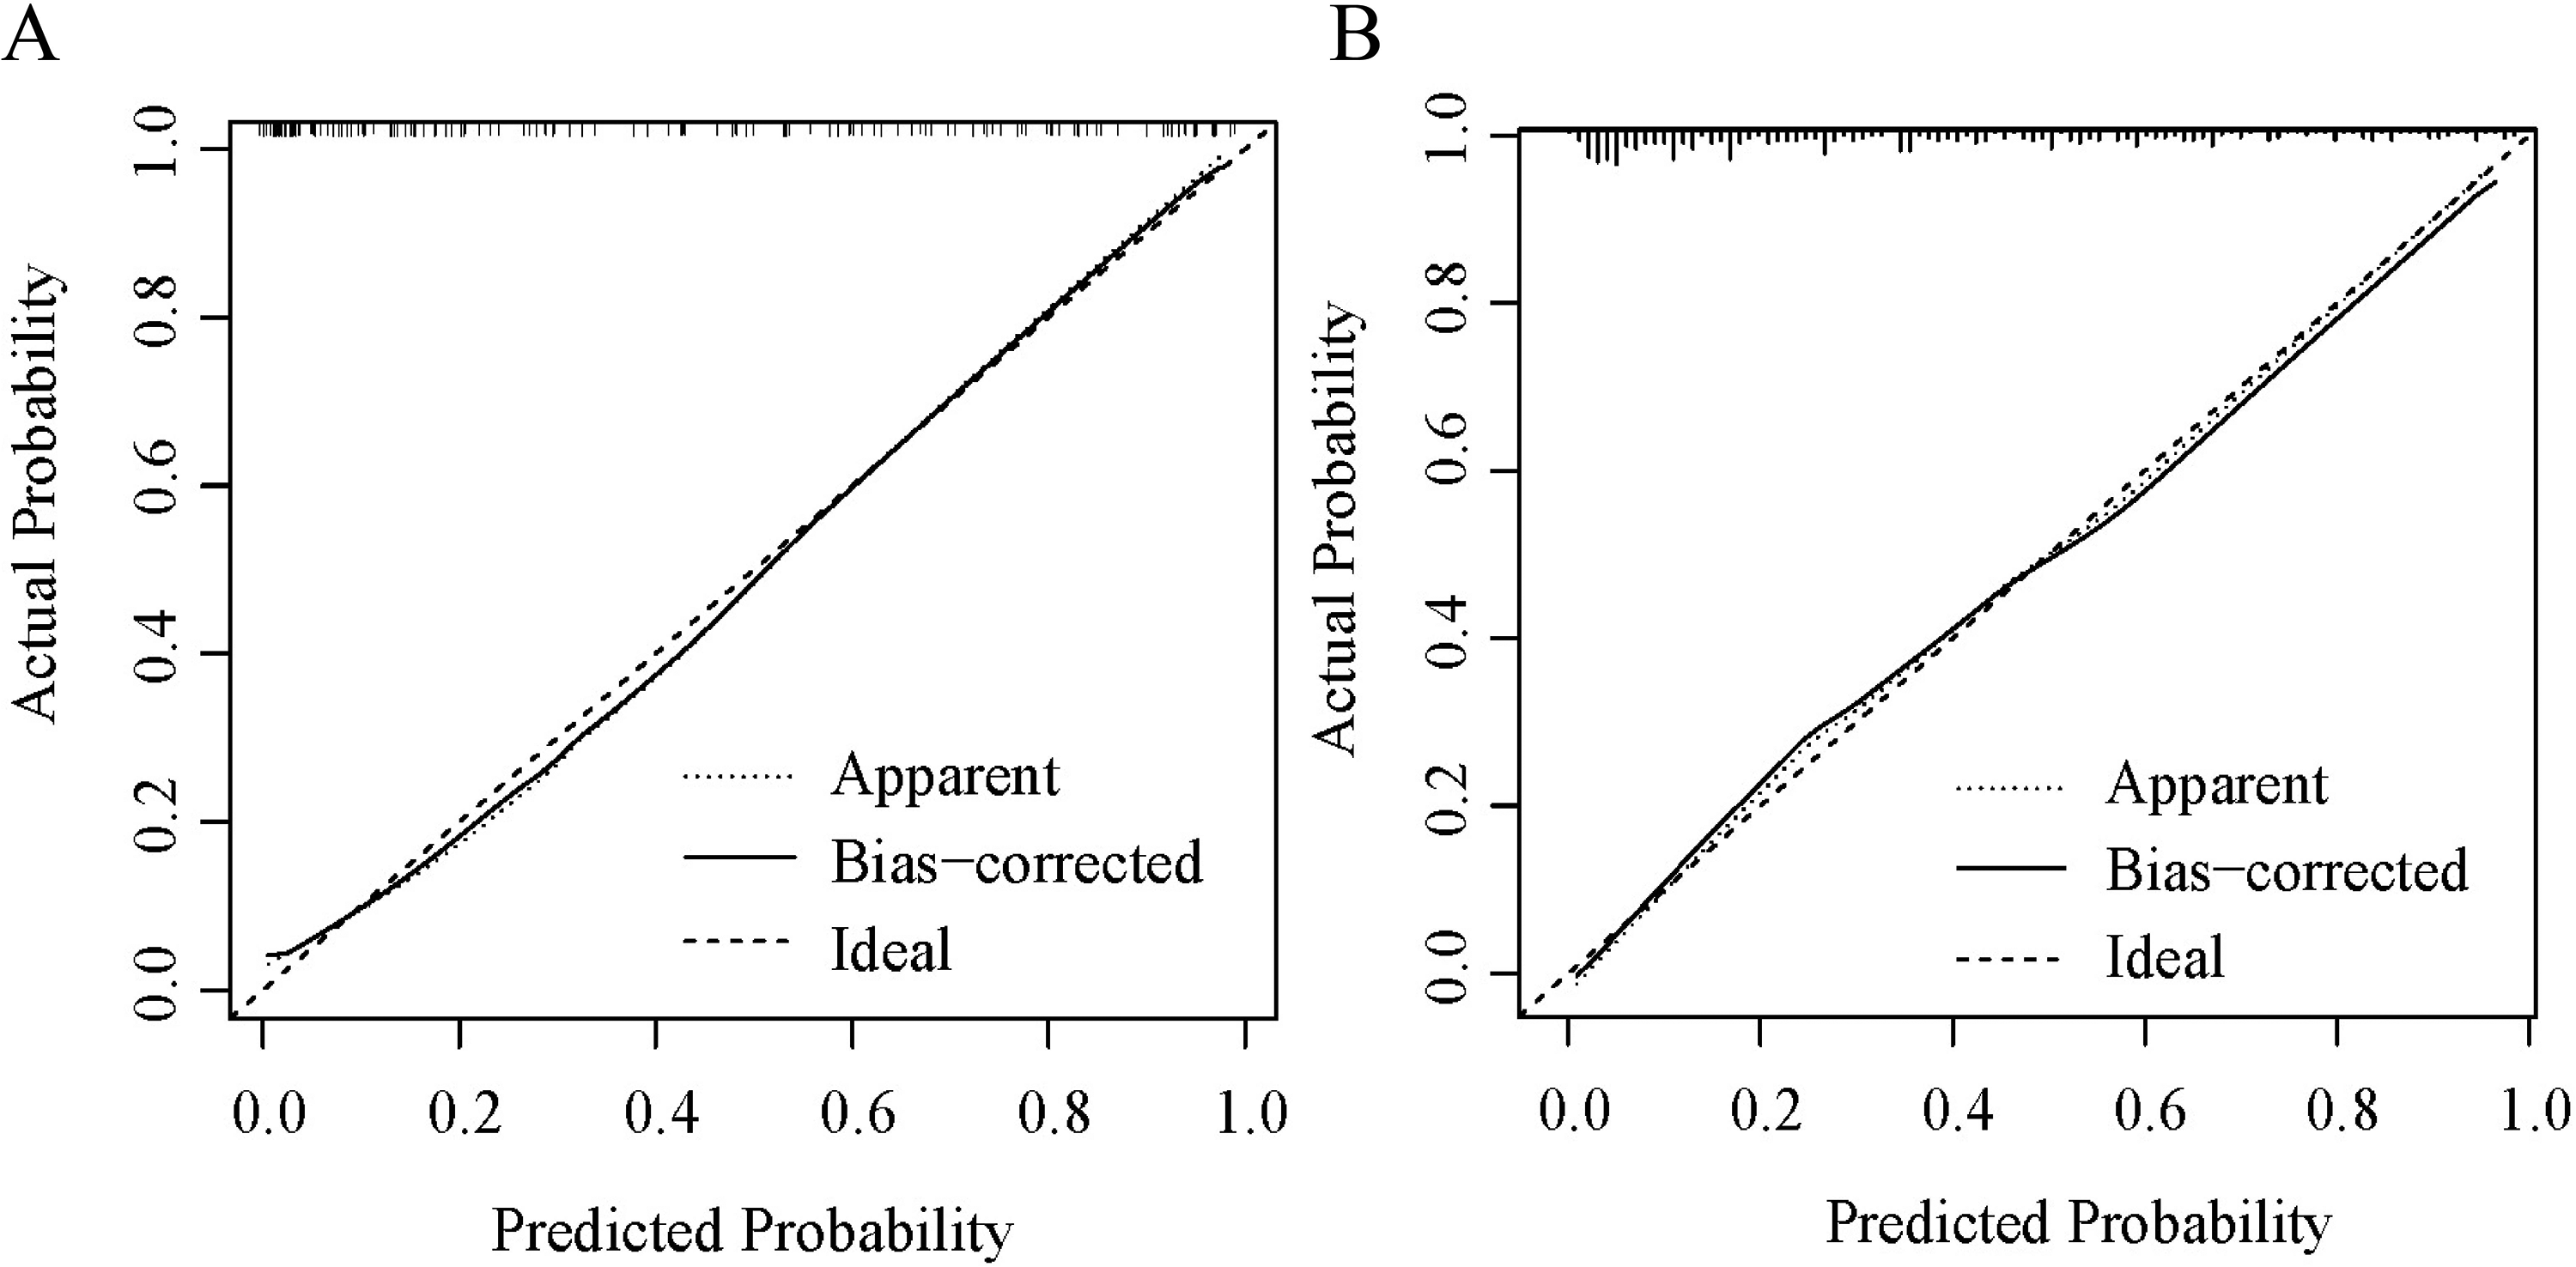
The performance of the nomogram was assessed by calibration curves in (A) the training cohort and (B) the validation cohort.
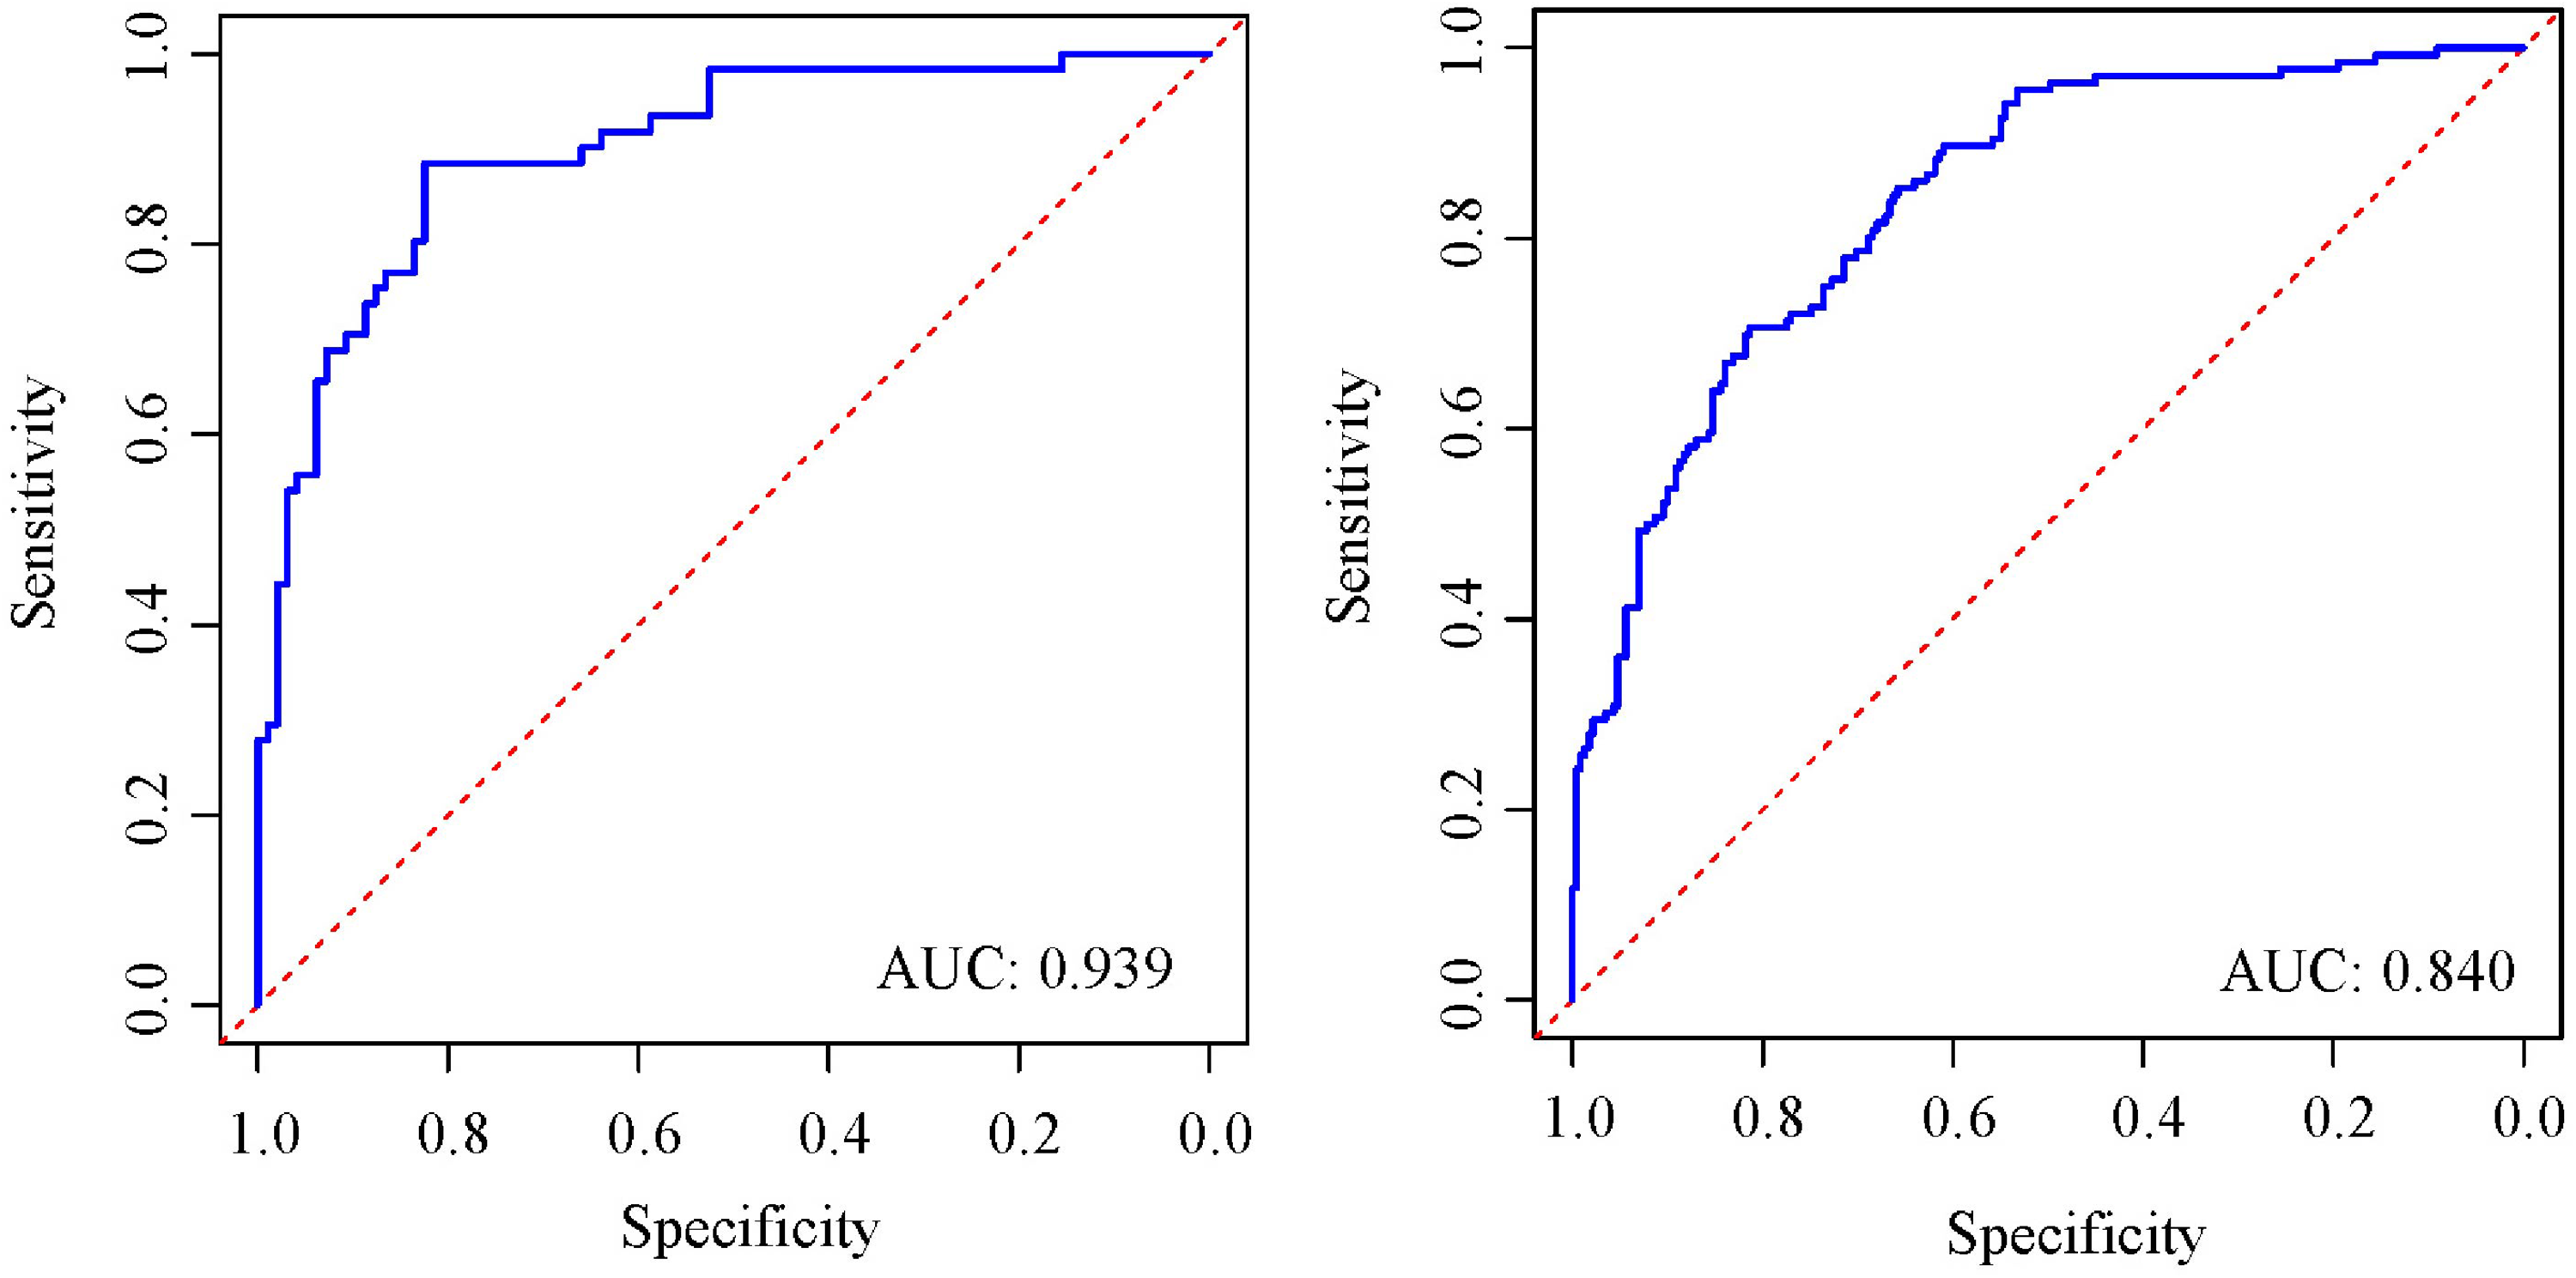
ROC curves for predicting the probability of intermediate-high SS risk in (A) the training cohort and (B) the validation cohort. Abbreviations: ROC, receiver operating characteristic; AUC, area under the curve; SS, SYNTAX score.
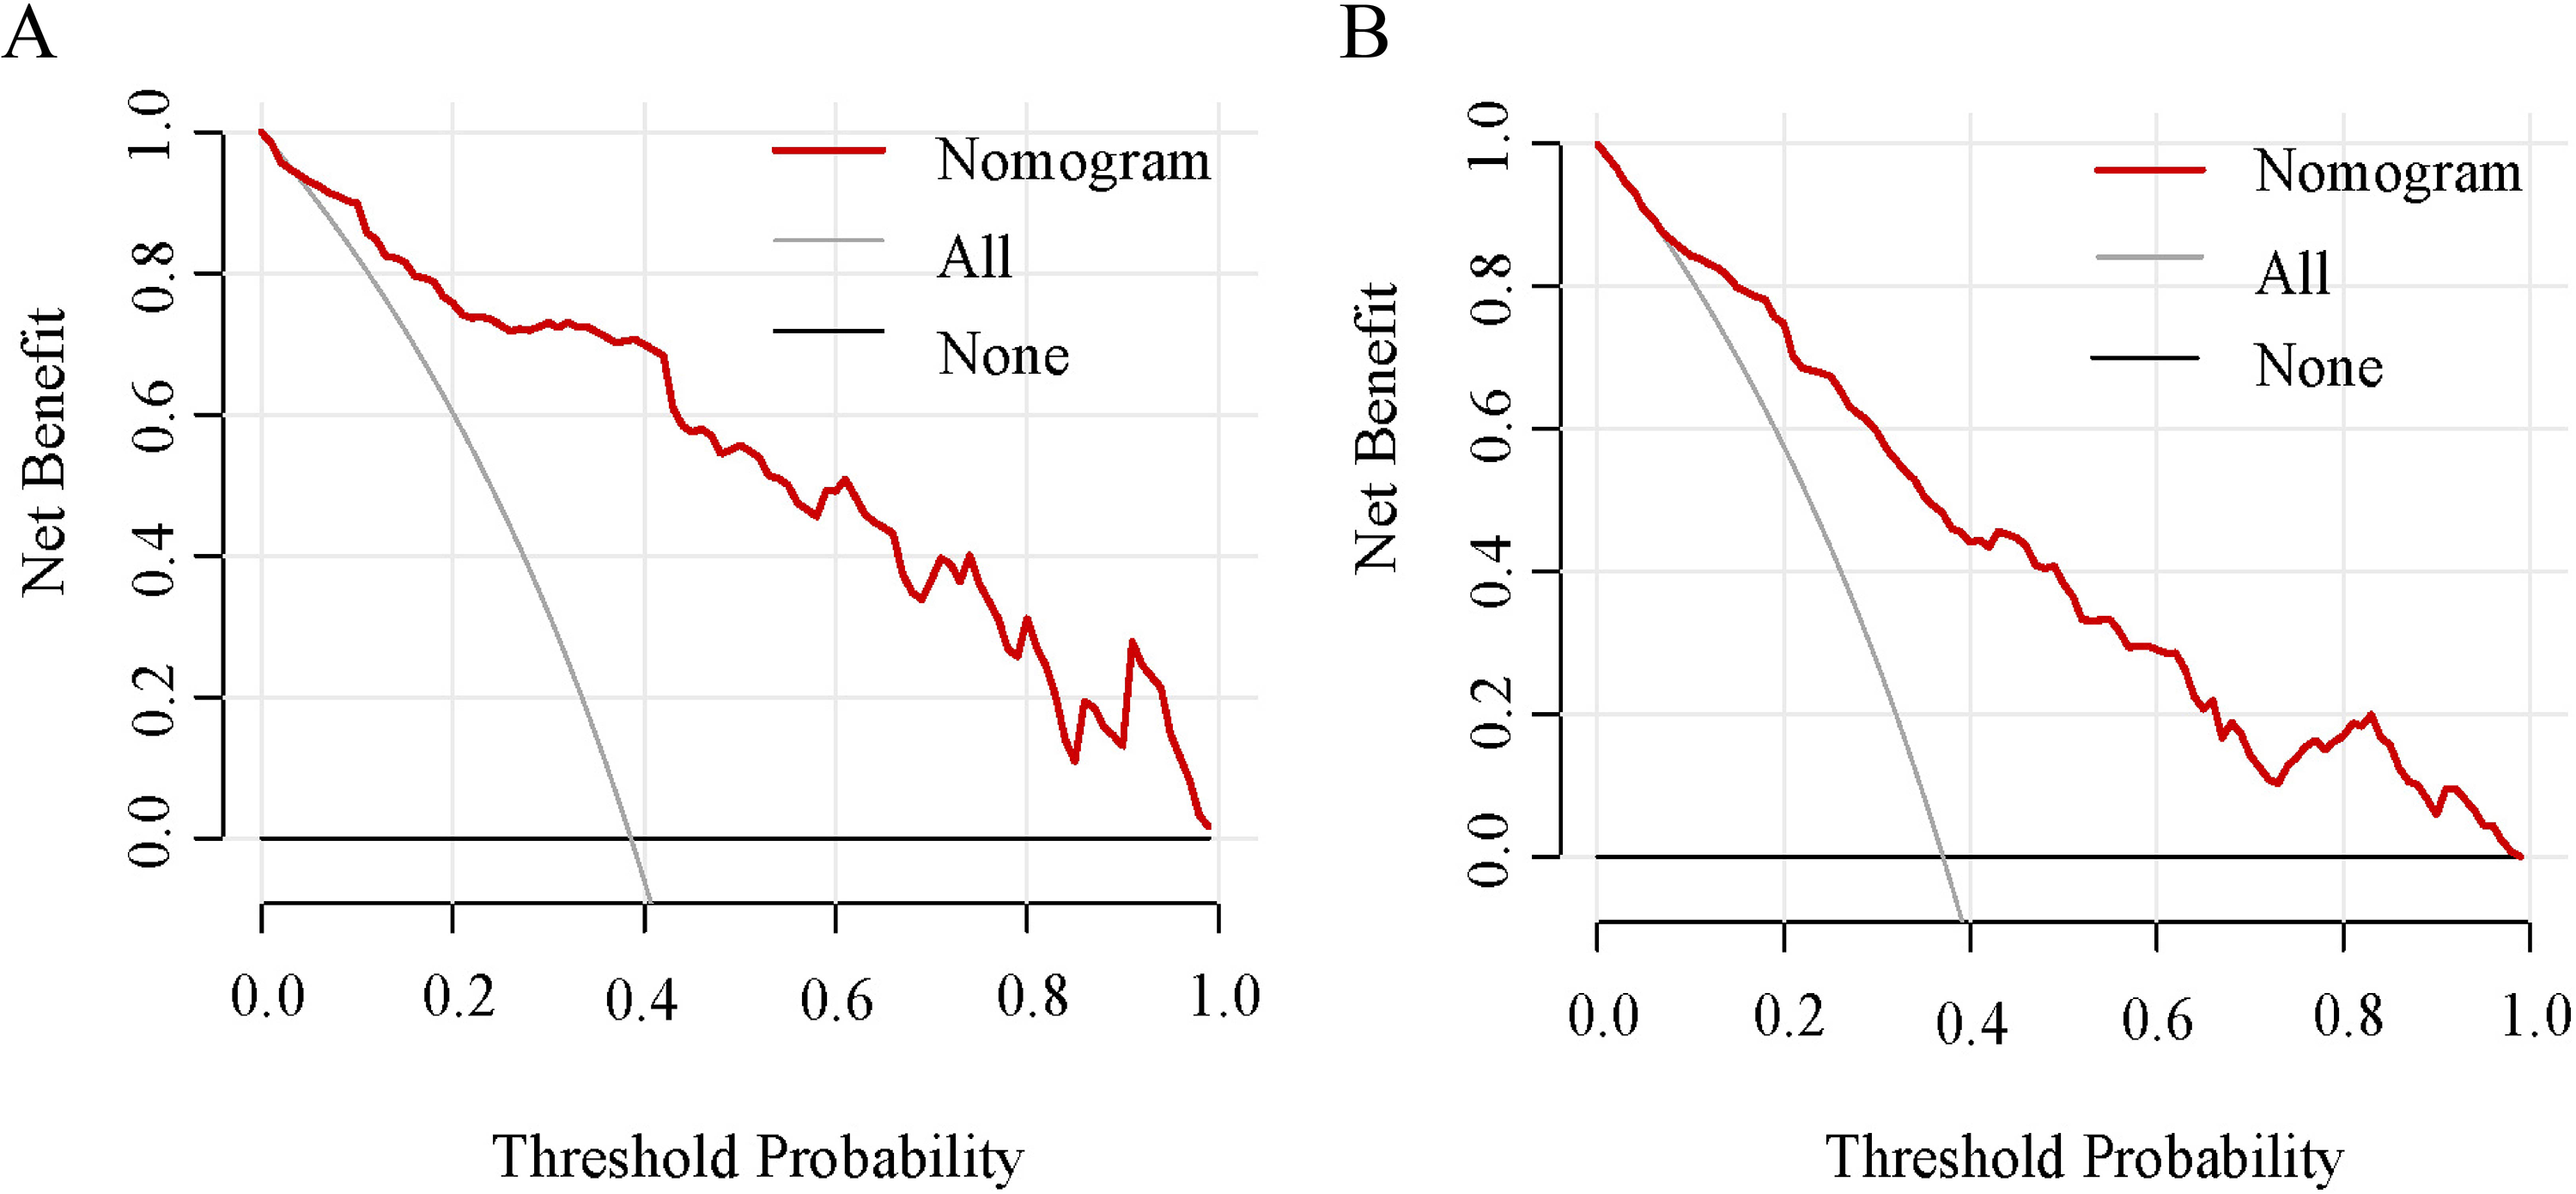
The clinical utility of the nomogram was evaluated by decision curves in (A) the training cohort and (B) the validation cohort.
Utility of the Nomogram
The nomogram was designed to calculate individual scores for each predictor of CAD severity, with the total score indicating the risk of intermediate-high SS. This tool is crucial for identifying patients with intermediate-high SS and guiding appropriate treatment strategies. For instance, a 70-year-old CAD patient with an HDL level of 1 mmol/L, hypertension, an anaerobic threshold (AT) of 14 ml/kg/min, a VO2/kg of 20 ml/kg/min, and no diabetes, would have a total score of approximately 272. This score correlates to a 79% probability of the patient being at intermediate-high SS risk.
Discussion
This study explored the link between cardiorespiratory fitness, assessed via CPET, and the severity of coronary lesions. We developed a nomogram that integrated factors like AT, VO2/kg, age, HDL levels, hypertension, and diabetes mellitus, to predict CAD severity. This model demonstrated notable discriminatory capacity, providing a noninvasive method to assess coronary severity before ICA and aiding in the formulation of targeted treatment strategies.
Low or intermediate-high SS indicates the number, location, and severity of coronary atherosclerotic lesions. 20 A higher SS suggests more severe atherosclerosis in the coronary arteries, which can adversely affect the patient's life and quality, indicating a poor prognosis and an increased risk of future cardiovascular events, potentially leading to life-threatening conditions. 21 Percutaneous coronary intervention (PCI) is tailored based on the SS level, highlighting the importance of accurate assessment. The ability to noninvasively identify such patients is especially valuable, considering the limitations of ICA, and plays a significant role in both clinical evaluation and enhancing patient outcomes.
During physical activities, the heart and lungs work together to satisfy the increased oxygen demands of muscles. This demand primarily challenges the cardiovascular system, given the lung's substantial compensatory capacity. In CAD, coronary artery stenosis restricts blood and oxygen flow to the myocardium. This leads to abnormal myocardial energy metabolism and impaired cardiac systolic function, reducing cardiac output and muscular efficiency. 22 These issues are reflected in altered physiological parameters like oxygen consumption and utilization. CPET effectively measures cardiac blood and oxygen supply by monitoring gas exchange in the airways, offering a vital physiological insight.11,13 Peak VO2, measuring per-minute oxygen uptake during incremental exercise tests, reflects the circulatory system's oxygen transport capacity, a key cardiopulmonary function indicator influenced by body weight. VO2/kg, adjusting for body weight, more accurately indicates cardiac function. 23 Anaerobic threshold (AT) occurs when aerobic metabolism's energy output no longer meets the body's demands at a certain exercise intensity, signaling anaerobic metabolism's role in energy provision. AT assesses muscle mitochondria's oxygen utilization capability, distinct from VO2/kg. 16 Both VO2/kg and AT evaluate cardiac function severity and status. Studies, such as those by Popovic et al, correlate severe coronary artery lesions with lower oxygen intake, aligning with these assessments. 24 The findings of this study indicated that AT and VO2/kg served as independent predictors for intermediate-high SS in patients with CAD.
This study identified that, alongside CPET parameters, factors like age, HDL levels, hypertension, and diabetes mellitus independently predict intermediate-high SS in CAD patients. The OR for age was 1.053, consistent with findings reported by Zhang et al 25 Notably, HDL emerges as a protective factor against CAD, indicating that lower HDL levels in CAD patients may correlate with more severe disease,26,27 echoing prior research on the significant impact of abnormal lipid metabolism on CAD progression. 28 Additionally, hypertension and hyperglycemia are well-established risk factors for adverse cardiovascular events.29–31
The primary strength of our study lay in developing a nomogram utilizing a noninvasive tool, CPET, which demonstrated high predictive accuracy for identifying intermediate-high SS in CAD patients. This nomogram, derived from regression analysis, is intuitive, enhancing the prediction and interpretation of CAD severity. It allowed for the dynamic assessment of the risk of intermediate-high SS, taking into account the varying clinical statuses of patients. Its ability to continually evaluate the increasing risk of intermediate-high SS was invaluable for clinicians in formulating personalized treatment approaches. The efficacy of the nomogram was confirmed through robust discrimination and calibration, showing net benefits in both training and validation cohorts. This model shifted the focus from mere accuracy of severity-related parameters to a more comprehensive, intuitive, clinically practical approach in CAD management.
This study faced some limitations. Primarily, being a preliminary investigation into the relationship between CPET parameters and the severity of CAD, it included a small patient cohort, necessitating further validation of its findings in a broader real-world patient population. Additionally, the influence of beta blockers and other cardioprotective drugs on CPET results is significant, 32 suggesting their discontinuation before CPET could enhance protocol standardization in future studies.
In conclusion, our development of a nomogram utilizing CPET parameters facilitated noninvasive prediction of intermediate-high SS. This tool held significant potential for pre-ICA risk stratification in CAD patients, offering clinicians a personalized, noninvasive diagnostic approach.
Footnotes
Authors’ Contribution
Conception and design by Hongmin Wang and Yi Wang. Development of methodology by Hongmin Wang and Yi Wang. Acquisition of data by Hongmin Wang, Qingmin Wei, Liyan Zhao, and Qingjuan Zhang. Analysis and interpretation of data by Hongmin Wang, Liyan Zhao, and Qingjuan Zhang. Writing, review and/or revision of the manuscript by Hongmin Wang and Yi Wang. Study supervision by Yi Wang.
Data Availability Statement
All data generated or analyzed during this study are included in this article. Further enquiries can be directed to the corresponding author.
Declaration of Conflicting Interests
The authors declared no potential conflicts of interest with respect to the research, authorship, and/or publication of this article.
Ethical Approval
This study was approved by the Ethics Committee of The First Hospital of Xingtai (Approval No: 2022-17).
Funding
The author(s) disclosed receipt of the following financial support for the research, authorship, and/or publication of this article: Key Research and Development Project of Xingtai City (2022zz080).
Informed Consent
All participating patients provided informed consent.