
Abstract
Introduction
We aim to explore the risk factors for in-hospital mortality and to derive a prognostic model for patients with APE in China.
Materials and methods
Inpatients with APE were enrolled from West China Hospital between January 2016 and December 2019. Logistic regression analyses were used to explore risk factors for in-hospital mortality and develop a prognostic model.
Results
A total of 813 subjects with APE were included in this study, of whom 542 were in the training set and 271 were in the test set. Multivariable regression analyses indicated that age, male, heart rate, systolic blood pressure, elevated NT-proBNP or troponin T, malignancy, chronic renal insufficiency, and respiratory failure were independent risk factors for in-hospital mortality. For the training set, the area under the curve (AUC) of the ROC curve was 0.899, with a sensitivity and specificity of 89.7% and 77.7%, respectively. The model had higher prediction accuracy than the PESI and sPESI.
Conclusions
The prediction model has proven excellent discrimination and calibration, which may be a useful tool to help physicians make decisions regarding the best treatment strategy.
Introduction
Acute pulmonary embolism (APE) is characterized by occult onset, rapid progression and high morbidity(1–3). Despite early diagnosis and treatments that improve survival, APE remains the third most common cause of cardiovascular death, behind myocardial infarction and stroke(4–7). Effective risk stratification of patients with APE is imperative to guide therapeutic strategies and determine the appropriateness of ambulatory treatment(8). Moreover, early identification of subgroups at higher risk of death enables targeted critical care support and delivery of precise treatments according to disease severity (including anticoagulation and thrombolysis)(2).
Several multivariable clinical prognostic models for APE have been proposed and validated to assess risk stratification among inpatients(8–12). However, these models lack important laboratory and imaging parameters related to APE prognosis, such as cardiac biomarker levels and right ventricular (RV) dilation(13–15). Furthermore, these models were mainly derived and validated in the Western population, and it is less clear whether they are suitable for Chinese patients. Therefore, a prediction model integrating clinical characteristics, laboratory indicators and imaging parameters is needed in China.
The aim of our study was to develop a specific risk prediction model for patients with APE in China and compare it with the previously validated pulmonary embolism severity index (PESI) and simplified PESI (sPESI) scores.
Materials and Methods
Study Design and Patients
A total of 813 subjects with APE admitted to the West China Hospital of Sichuan University from January 2016 to December 2019 were selected as the study participants, including 542 subjects in the training set and 271 subjects in the test set (Table 1). We used the training set to establish a prediction model for the severity of APE and applied the test set to validate the model. The noninterventional study was approved and granted a waiver of written informed consent by the ethics committee of the West China Hospital of Sichuan University.
Characteristics of Patients Included in Training and Test Sets.

Abbreviations: WBC, white blood count; PLT, platelet; NT-pro-BNP, N-terminal pro-B–type natriuretic peptide; CT, computed tomography ;ICU = intensive care unit.
Note: Chronic lung disease included chronic obstructive pulmonary disease ,bronchiectasis, bronchial asthma, pulmonary tuberculosis and idiopathic pulmonary fibrosis. Chronic renal insufficiency was defined as glomerular filtration rate< 60ml/min because of chronic kidney disease(nephrotic syndrome, chronic glomerulonephritis, lupus nephritis and diabetic nephropathy)
The participants included in the study met the following inclusion criteria: (1) age ≥18 years; (2) APE confirmed by CTPA or pulmonary ventilation-perfusion scans for the first time; and exclusion criteria: (1) patients diagnosed with chronic pulmonary embolism; and (2) incomplete basic patient information.
Data Collection
The clinical data of demographic information, vital signs, laboratory and imaging findings, comorbid diseases, and clinical outcomes were extracted from the electronic medical records by two researchers. Chronic renal insufficiency was defined as an estimated glomerular filtration rate <60 mL/min/1.73 m2. The diameters of the right ventricle (RV) and left ventricle (LV) were measured by experienced radiologists, and an RV/LV diameter ratio ≥ 1 indicated RV dilation(16). The clinical outcomes included all-cause in-hospital mortality, systemic thrombolysis, length of stay (LOS), and intensive care unit (ICU) admission. In addition, we also evaluated the PESI and sPESI scores of each patient for comparison with our model.
The PESI, published in 2005, consists of eleven clinical parameters(9). According to the evaluation score, patients with APE are divided into five severity levels, in which classes I and II are considered low risk of mortality, and the rest are considered medium and high risk of mortality. However, due to the complex calculation in PESI, Jimenez et al developed a simplified PESI on the basis of PESI(10). The sPESI was composed of age > 80 years, malignancy, history of cardiopulmonary disease, systolic blood pressure < 100 mm Hg, heart rate ≥ 110 beats/min and oxygen saturation < 90%. By assigning 1 point to each prognostic variable, patients with a point of 0 were classified as low-risk, and patients with a point of 1 or more were classified as high-risk(10).
Statistical Analyses
Analysis of General Characteristics
Continuous variables were described as the mean ± standard deviation or median and interquartile range (IQR). Student's t test was used to compare group differences for normally distributed data, and nonparametric tests were used for variables without a normal distribution. Categorical variables are presented as numbers and percentages, and the chi-square test was used to perform group comparisons. All statistical data in our study were analyzed using SPSS v23.0 (IBM, Chicago, IL, USA), and P < 0.05 was considered significant.
Development of the Prediction Model
Univariable and multivariable logistic regression analyses were performed to confirm the risk factors for in-hospital mortality of APE, and the adjusted odds ratios (ORs) with 95% confidence intervals (CIs) were reported. According to the results of the multivariable analysis, a logistic predictive model was constructed to evaluate the severity of APE. The discrimination of the model was quantified with the receiver operating characteristic curve (ROC) and calibration with the Hosmer–Lemeshow goodness-of-fit test.
Validation of the Prediction Model
To validate the model derived from the training set, we used the data of 271 patients in the test set and estimated the model on each patient. Model performance was quantified as the area under the ROC (AUC) and compared with the PESI and sPESI in the test set.
Results
This study included 813 consecutive patients with a main diagnosis of APE. The median age was 59.15 ± 16.70 years, and the proportion of males in the cohort was 59.3%. The in-hospital mortality rate was 7.5% (61/813).
Characteristics of Patients with APE in the Training set
The demographics and clinical characteristics of the 542 patients in the training set (39 dead, 503 survivors) are presented in Table 2. The death group and the survival group had a median age of 70.70 ± 13.82 versus 58.54 ± 16.41 years (p < 0.001). The proportions of males in the death group (n = 35) and the control group (n = 288) were 89.7% and 57.3% (p < 0.001), respectively. The systolic blood pressure of the patients in the death group was lower than that in the survival group (114.41 ± 25.20 vs 124.53 ± 20.24 mm Hg), and the heart rate was higher (103.80 ± 23.00 vs 88.03 ± 15.55 beats/min). There were significant differences in the levels of N-terminal pro-B–type natriuretic peptide (NT-proBNP) (368.5–7801.0 vs 107.5–1877.0 pg/ml) and in the incidence of respiratory failure (53.8% vs 16.1%). No significant differences were observed in white blood cell count, platelet count, troponin T, D-dimer, fibrinogen and serum sodium. Comorbidities were more common in the death group, including diabetes, malignancy and chronic renal insufficiency in the training set. Pleural effusions were more common in dead patients (79.5% vs 62.7%), and there were no significant differences with respect to RV dilation on computed tomography between the two groups. A total of 6 patients with systemic thrombolysis treatment were included in the training set, of whom 2 died and 4 survived. The median LOS for the death group was 11 days (IQR: 6–19), while it was 15 days (IQR: 9-22) for the control group (p = 0.330). The incidence of ICU admission (15.4% vs 4.0%, p = 0.001) was higher in the death group.
Characteristics of Patients with Acute Pulmonary Embolism Group by Mortality in the Training set.

Abbreviations: WBC, white blood count; PLT, platelet; NT-pro-BNP, N-terminal pro-B–type natriuretic peptide; CT, computed tomography ;ICU = intensive care unit.
Note: Chronic lung disease included chronic obstructive pulmonary disease ,bronchiectasis, bronchial asthma, pulmonary tuberculosis and idiopathic pulmonary fibrosis. Chronic renal insufficiency was defined as glomerular filtration rate< 60ml/min because of chronic kidney disease(nephrotic syndrome, chronic glomerulonephritis, lupus nephritis and diabetic nephropathy)
Development of the Prediction Model in the Training set
The variables with p < 0.05 in the training set were put into logistic regression for multivariable analysis to construct a prediction model that distinguished APE patients at higher risk of mortality. In the multivariable analysis, age ≥80 years (OR: 5.132; 95% CI: 1.418-18.581), male sex (OR: 4.998; 95% CI: 1.513-16.510), heart rate ≥ 110 beats/min (OR: 7.194; 95% CI: 2.444-21.177), systolic blood pressure < 100 mm Hg (OR: 6.402; 95% CI: 1.93-21.242), elevated NT-proBNP or troponin T (OR: 9.332; 95% CI: 1.085-80.248), malignancy (OR: 8.327; 95% CI: 2.862-24.230), chronic renal insufficiency (OR: 4.929; 95% CI: 1.283-18.938), and respiratory failure (OR: 3.295; 95% CI: 1.287-8.440) were statistically independent predictors and were associated with hospital mortality after adjusting for pleural effusion and diabetes. The results of multivariable logistic regression analysis are shown in Table 3.
Logistic Regression Analysis of Training set.

Abbreviations: WBC, white blood count; PLT, platelet; NT-pro-BNP, N-terminal pro-B–type natriuretic peptide; ICU, intensive care unit; OR, odds ratio; CI, confidence interval.
Note: Chronic renal insufficiency was defined as glomerular filtration rate< 60ml/min because of chronic kidney disease(nephrotic syndrome, chronic glomerulonephritis, lupus nephritis and diabetic nephropathy)
The regression coefficients (β) from the logistic model were used to construct the prediction model for in-hospital mortality of patients with APE. The clinical prediction model was as follows: probability of hospital mortality = ex/(1 + ex), x = −8.138 + (1.636 × age ≥80 years) + (1.609 × male) + 1.973 × (heart rate≥110 beats/min) + (1.857 × systolic blood pressure<100 mm Hg) + (2.233 × elevated NT-pro-BNP or troponin T) + (2.120 × malignancy) + (1.595 × chronic renal insufficiency) + (1.192 × respiratory failure).
For the training set, the area under the curve (AUC) of the ROC curve was 0.899 (95% CI: 0.854–0.944), which suggested that the risk prediction model had good discrimination (Figure 1). The Hosmer–Lemeshow test demonstrated high predictive capabilities of the prediction model (χ 2 = 5.364,p = 0.718). The cutoff point was 0.035, with a sensitivity and specificity of 89.7% and 77.7%, respectively. Patients with a probability value ≥0.035 were considered at high risk of hospital mortality, and patients with a probability value <0.035 were considered at low risk.

Receiver operator ycharacteristic (ROC) curve for the training set.
Validation of the Prediction Model in the Test set
The prediction model developed using the training set was tested for validity in the test set. No significant differences were found in the demographics and clinical data of patients between the training set and test set. The area under the ROC curve for the test set was 0.838 (95% CI: 0.770-0.906). In addition, we also compared the PESI and sPESI models by developing ROC curves.
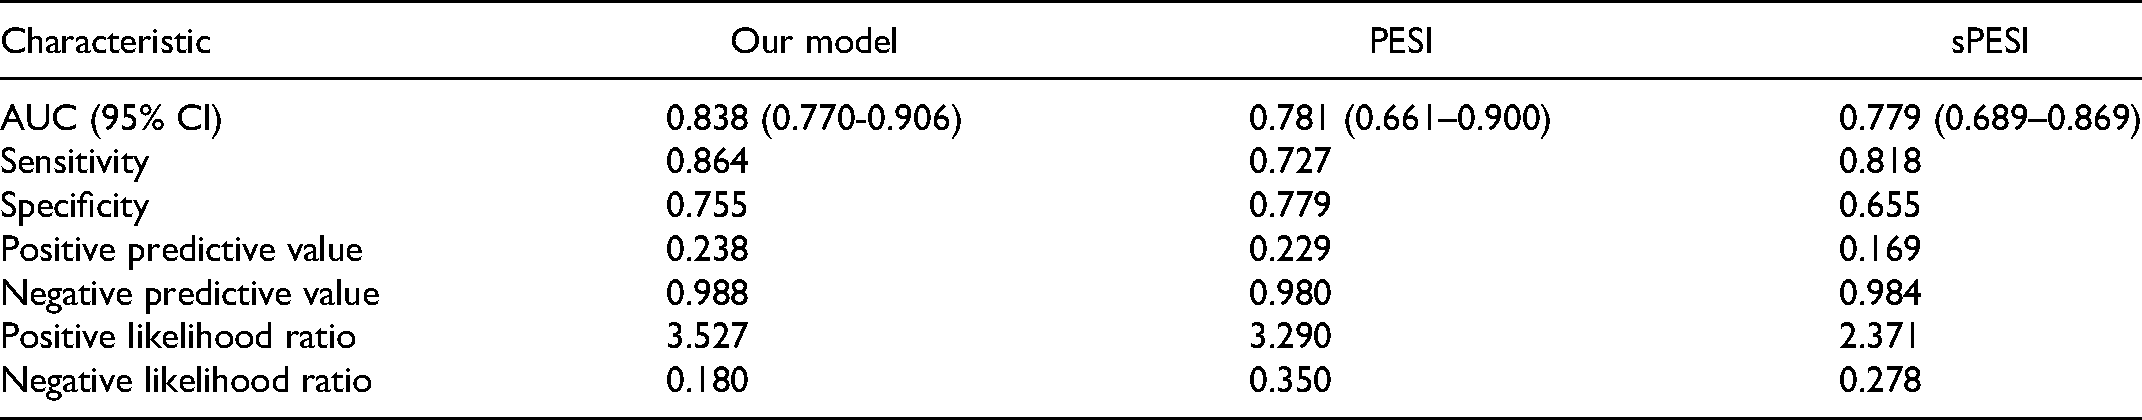
In the test set, the area under the ROC curve of the PESI was 0.781 (95% CI: 0.661–0.900) and that of the sPESI was 0.779 (95% CI: 0.689–0.869) (Figure 2). The AUC of the prediction model constructed in our study was superior to that of the PESI and sPESI (p < 0.05). The sensitivity (Sen) of the prediction model (Sen: 0.864) was better than both the PESI (Sen: 0.727) and sPESI (Sen: 0.818), although the specificity was slightly lower than that of the PESI. The prediction model also had advantages of positive predictive value (PPV), negative predictive value (NPV), positive likelihood ratio (PLHR), and negative likelihood ratio (NLHR) over PESI and sPESI (Table 4).

Comparison of three models validated using the test set. test set, PESI
PESI  sPESI.
Comparison of Predictive Validity of our Model to the PESI and sPESI in the Test set.
Discussion
Despite the death rate dropping, APE remains a potentially fatal disease that has become a major contributor to the global disease burden(3, 17). Therefore, it is vitally important to make an accurate and rapid judgment on the severity of APE, which contributes to choosing an appropriate treatment strategy and reduces the mortality of patients with APE to the greatest extent.
Several prediction models to evaluate the severity of APE have been designed by overseas scholars, such as PESI(9) and sPESI(10). However, with the change in the epidemiological trend of APE, many countries have updated the guidelines for the diagnosis and treatment of APE, and the practicability of traditional models has been affected to some extent. The PESI originated seventeen years ago and was poor in time effectiveness. The sPESI originated ten years ago, and blood and imaging features were not included for analysis, resulting in certain errors in risk assessment. In addition, foreign models are not necessarily applicable to domestic patients, given the geographic and racial differences at home and abroad. Therefore, a prediction model for the severity of APE suitable for the Chinese population can be established on the basis of traditional models to improve the precise treatment of APE.
In this study, a prognostic model for APE was developed by combining demographic data and clinical data based on 542 hospitalized patients in the training set. Internal validation was performed based on 271 patients in the test set. Based on the analysis of risk factors, age ≥80 years, male sex, heart rate ≥ 110 beats/min, systolic blood pressure < 100 mm Hg, elevated NT-proBNP or troponin T, malignancy, chronic renal insufficiency, and respiratory failure were confirmed to be independent risk factors for in-hospital mortality in patients with APE. The prediction model has proven excellent discrimination and calibration that may be used by clinicians as a risk assessment tool.
In this study, the overall all-cause mortality for APE was 7.50%, which was higher than previous findings showing a mortality of 1.3%-6.6%(5, 7, 18). The higher mortality in our cohort was of unrepresentativeness and could be explained by the fact that older patients with underlying diseases constitute a substantial minority of patients in the present study, leading to increased mortality of APE. Our results suggest that APE seriously harms human health and should be given more attention in clinical diagnosis and treatment.
Our model slightly outperforms the PESI developed by Aujesky and his colleagues. Several variables, including age, male sex, heart rate, systolic blood pressure and malignancy, were similar in both models. However, in our model, we found that elevated myocardial biomarkers and chronic renal insufficiency were strong risk factors for in-hospital mortality. Previous studies indicated that increased cardiac biomarker levels were significant predictors of short-term mortality and adverse outcome events of APE(19, 20). According to European Society of Cardiology (ESC) guidelines, APE with increased concentrations of cardiac troponin are considered intermediate-high risk and require close monitoring and treatment(2). Impaired renal function leads to decreased cardiac output, anemia and cardiopulmonary organ injury, which is a risk factor for mortality in cardiovascular diseases(21). Studies indicated that renal insufficiency was strongly associated with overall APE mortality and contributed to risk stratification; it was recommended to be a clinical parameter in the prognostic model of APE (22–25).
The sPESI is a simplified version of the PESI, with six of the eleven original PESI variables(10). Our model showed higher validity than the sPESI in the test set. Unlike the sPESI, chronic lung disease was not an independent risk factor for in-hospital mortality in patients with APE in our study. This was in accordance with the findings of a multicenter study conducted in Spain, which reported that chronic lung disease was not associated with mortality(11). We found that male sex was an independent predictor of in-hospital mortality in patients with APE. Inconsistently, a large study conducted in Australia reported that females had higher rates of mortality from APE than males(26). The association between sex and poor prognosis of APE needs to be confirmed by more studies. APE affects the effective transmission of oxygen and carbon dioxide, leading to hypoxia and respiratory failure. Serhat et al found that oxygen saturation < 90% was not an accurate factor to evaluate the hypoxic condition of patients (27). Respiratory failure was superior to oxygen saturation and easy to measure in clinical activities. We confirmed that respiratory failure was associated with in-hospital mortality in patients with APE in our study.
There have been some validation studies about PESI and sPESI, with different conclusions. Several researchers held that the PESI and sPESI had good discriminatory power for predicting short-term mortality (28–30). However, in a study from Massachusetts General Hospital, Hariharan et al found that nine (8%) had adverse outcome events in one hundred nine patients who were in category I or II of the PESI. Certain subgroups of patients who required hospitalization may be improperly categorized as safe for discharge, suggesting that the sensitivity of the PESI was moderate and further improvement was needed(31). In addition, a multicenter prospective cohort study showed very low mortality (10%) among patients with a PESI higher-risk classification during hospitalization(32). The results suggest that the PESI or sPESI has poor specificity and may inappropriately categorize a substantial percentage of patients who can be treated safely in an outpatient environment as high risk(33). In our study, we performed external validation of the PESI and sPESI in the test set. The areas under the ROC curves of the PESI and sPESI were 0.781 (95% CI: 0.661–0.900) and 0.779 (95% CI: 0.689–0.869), respectively. Our prediction model performed better in predicting the prognosis of APE, as also suggested by the higher AUC compared with the PESI and sPESI.
Considering the differences between domestic and foreign populations, the data in this study were all from patients with APE in China over the past 4 years. Two important variables, myocardial biomarkers and RV dilation, were included for analysis in the study. There were as many as 21 multidimensional parameters used to develop the prediction model, which was more comprehensive and detailed. In the comparison and validation of the model, the AUC value, sensitivity, PPV, NPV, PLHR and NLHR of the model in this study were much higher than those of the PESI and sPESI, indicating that the model in this study may be helpful to assess the prognosis of patients with APE.
To the best of our knowledge, this is the first attempt to derive a model to predict the risk of mortality in Chinese patients with APE. Nevertheless, our study had several limitations. First, retrospective design and post hoc identification of cutoff points are major limitations of the study, which probably has a potential bias. Second, we only performed internal validation on the model built in the study, and the lack of an external validation cohort from another center is one of the drawbacks of this model. Therefore, well-designed multicenter studies with prospective populations are needed to validate the accuracy of our prediction model. Third, the endpoint of this study was in-hospital death, which assessed the short-term prognosis of acute pulmonary embolism. Consequently, the model developed in our study cannot be applied to predict the risk of long-term mortality.
Conclusions
In summary, we derived and validated a prognostic model for risk stratification among Chinese hospitalized adults with APE. The model has proven excellent discrimination and calibration, which may be a useful tool to help physicians make decisions regarding the best treatment and appropriate treatment circumstances in patients with APE.
Footnotes
Abbreviation list
Declaration of Conflicting Interests
The author(s) declared no potential conflicts of interest with respect to the research, authorship, and/or publication of this article.
Funding
The author(s) disclosed receipt of the following financial support for the research, authorship, and/or publication of this article: This study was supported by the National Natural Science Foundation of China (82170013), the Sichuan Science and Technology Program (2022YFS0262) and the National Key Research Program of China (2016YFC1304202).