
Abstract
Coronary calcium score (CCS) is a highly sensitive marker for estimating coronary artery calcification (CAC) and detecting coronary artery disease (CAD). Mean platelet volume (MPV (is a platelet indicator that represent platelet stimulation and production. The aim of the current study was to examine the association between MPV values and CAC. We examined 290 patients who underwent coronary computerized tomography (CT) exam between the years 2017 and 2020 in a tertiary care medical center. Only patients evaluated for chest pain were included. The Multi-Ethnic Study of Atherosclerosis (MESA) CAC calculator was used to categorize patients CCS by age, gender, and ethnicity to CAC severity percentiles (<50, 50-74, 75-89, ≥90). Thereafter, the association between CAC percentile and MPV on admission was evaluated. Out of 290 patients, 251 (87%) met the inclusion and exclusion criteria. There was a strong association between higher MPV and higher CAC percentile (P = .009). The 90th CAC percentile was associated with the highest prevalence of diabetes mellitus (DM), hypertension, dyslipidemia, and statin therapy (P = .002, .003, .001, and .001, respectively). In a multivariate analysis (including age, gender, DM, hypertension, statin therapy, and low-density lipoprotein level) MPV was found to be an independent predictor of CAC percentile (OR 1.55-2.65, P < .001). Higher MPV was found to be an independent predictor for CAC severity. These findings could further help clinicians detect patients at risk for CAD using a simple and routine blood test.
Introduction
Coronary artery calcification (CAC) is a highly sensitive marker for detecting coronary artery atherosclerosis and coronary artery disease (CAD) and has proven to be a strong independent predictor of all-cause mortality.1,2 There are several ways to quantify and assess the severity of the coronary arteries calcification.3,4 One of the most common and efficient methods is by using the coronary calcium score (CCS) found by multi-detector computed tomography. CCS was also tested in a cardiovascular event prediction model created by machine learning techniques in the MESA (Multi Ethnic Study of Atherosclerosis) dataset. This study found CCS to be the most important predictor of CAD and all atherosclerotic cardiovascular disease combined outcomes. 5
Atherosclerosis is a low-grade inflammatory disease, and several studies were conducted to determine if and which inflammation related blood markers (such as neutrophil-lymphocyte and platelet-lymphocyte ratios) can predict atherosclerosis.6,7
Mean platelet volume (MPV) is one of the platelet indices that represent platelet stimulation and production. 8 MPV does not change as platelets age in the circulation. 9 It has been reported that a larger MPV is an indicator of increased platelet activation and associated with non-responsiveness to clopidogrel. 10,11 Several studies have also suggested that MPV is elevated in vascular diseases such as cerebral and myocardial infarction. 8 An elevated MPV can also be an outcome predictor for thrombotic events including cardiovascular disease.6,8
Arterial thrombosis represents an exaggerated physiological hemostatic and inflammatory response at sites of atherosclerotic plaque disruption. Platelets that adhere to the vessel wall at sites of endothelial-cell activation contribute to the development of chronic atherosclerotic lesions, and when these lesions rupture, they trigger the acute onset of arterial thrombosis. 12 Platelets also play a major role in inflammation via leukocyte recruitment and activation. 13 An exaggeration of these physiological responses at atherosclerosis-prone sites appears to play an important role in the pathogenesis of this disease. 14
As CAC and MPV are strong independent predictors of CAD, the aim of the current study was to evaluate the association between MPV and CAC in patients with chest pain undergoing CCTA (coronary computed tomography angiography) and whether MPV can be used to predict the CAC severity.
Methods
Study Population
The study was an observational retrospective cohort study. All patients underwent CCTA at the Shaare Zedek Medical Center and had available blood work between the years 2017 and 2020. All CCS analyses were conducted by a cardiac imaging specialist. CCTA was performed either during hospitalization or in an outpatient setting.
Inclusion criteria: Patients who were referred to CCTA due to chest pain or chest pain equivalent symptoms (ie, dyspnea on excretion).
Exclusion criteria: Patients with previous coronary artery stenting, mechanical valves, post coronary artery bypass graft surgery patients and low-quality imaging.
Demographic Characteristics and Data Collection
Demographic data (age, sex), medical history (comorbidities, smoking status, and current drug therapy) and laboratory results including complete blood count (CBC), creatinine and lipid profile were collected from individual charts in the hospital's electronic database.
Blood Sampling and Laboratory Measurements
Serum levels of low-density lipoprotein cholesterol (LDL), high-density lipoprotein cholesterol (HDL), triglycerides, and creatinine were determined by using commercial tests. CBC, which included total white blood cells, neutrophils, platelet count, MPV, and platelet distribution width (PDW) were obtained using Sysmex XN-2000 automated hematology analyzer (Sysmex, Japan).
Only the most recent available blood work performed prior to the CCTA test, and no longer than a week before the CCTA, was included.
Hematologic indices were MPV (fL); white blood cell count, WBC (103/µL); neutrophils (103/µL); platelet count (103/µL), PDW (fL); hemoglobin (g/dL), creatinine (mg/dL), HDL (mg/dL); LDL (mg/dL), and triglycerides (mg/dL) data were collected as well.
CCS and CCTA Protocol
All data were acquired on a dual-source computerized tomography (CT) scanner (SOMATOM Flash or SOMATOM Force, Siemens Healthineers, Erlangen, Germany). All acquisition and reconstruction protocols (spiral, sequential, or high pitch spiral flash) adhered to the society of Cardiovascular Computed Tomography guidelines for the performance and acquisition of coronary computed tomographic angiography. Our CT laboratory clinical routine includes an initial calcium score scan followed by CTA.
CAC Percentile
The MESA CAC calculator was used to categorize patients CAC. The MESA study was characterizing subclinical cardiovascular disease and the risk factors that predict progression to clinically overt cardiovascular disease or progression of the subclinical disease. 15 In this study, the researchers developed a CAC score reference values web tool to provide the estimated probability of non-zero calcium, and the 25th, 50th, 75th, and 90th percentiles of the calcium score distribution by classifying CCS for a particular age, gender, and race. 16
We have calculated the CAC percentile for each patient using 2 assumptions: First, because we did not have an information on ethnicity and the vast majority of our patients were Caucasians, we assumed a default white gender on the calculator. Second, the MESA population did not include patients below the age of 45 years old. Our study had 46 patients below this age. Therefore, we have assumed a similar CAC percentile of 45 years old to patients younger than the age of 45 with the assumption that both populations are of similar low risk for CAC.
Statistical Analysis
Descriptive statistics for studied variables are presented as mean (standard deviation, SD) for normally distributed variables, median (interquartile range, IQR) for non-normally distributed variables, and frequency (percentage) of categorical variables.
Correlation between 2 numeric variables was done by Pearson's correlation method for normally distributed variables. For non-normally distributed variables we used Spearman's correlation test.
Comparisons of continuous variables between independent groups were done by independent sample T-test and analysis of variance for more than 2 groups. Chi-square test was used for comparison of categorical variables.
We used ordinal logistic regression models to measure the strength of the relationship between CAC percentile and MPV, signified as odds ratio.
Univariate regression analysis was used to measure the strength of the relationship between CAC percentile and MPV. A multivariate regression analysis was used to adjust for cardiovascular risk factors (including demographics, medical background, and LDL levels) which may be confounders in assessing the relationship between CAC percentile and MPV.
All analyses were conducted using SPSS statistical software (version 25.0). All statistical tests were 2-sided and significance was determined at a P-value .05.
Results
Patients’ Characteristics
Patients baseline characteristics are shown in Table 1. The study population consisted of 251 patients, of them 156 males (62%). One hundred and ninety-four (77.3%) patients underwent CCTA during hospitalization while the rest were outpatients. MPV values had a normal distribution with mean MPV of 10.83 fL (±1.03 SD).
Clinical and Laboratory Characteristics According to CAC Percentile.

Data are expressed as means (±SD) and medians (IQR).
Abbreviations: CAC, coronary artery calcification; WBC, white blood cells; MPV, mean platelet volume; PDW, platelet distribution width; LDL, low-density lipoprotein; HDL, high-density lipoprotein.
A total of 120 (47.8%) patients were below the 50th CAC percentile, 47 (18.7%) were in the 50th to 74th CAC percentile, 45 (18%) patients in the 75th to 89th CAC percentile, and 39 (15.5%) were above the 90th CAC percentile.
MPV and CCS Correlation
In general, there was a positive, but relatively weak, correlation between high MPV values and high CCS values, although it was statistically significant (r(249) = 0.130, P = .039). Nevertheless, there was a strong association between mean MPV and CAC percentile (10.67 [0.97] for CAC < 50th; 10.74 [1.09] for CAC 50-74th; 10.98 [0.91] for CAC 75-89th and 11.27 [1.14] for CAC > 90th, P = .009), as shown in Figure 1.

Mean MPV by CAC percentile.
Cardiovascular Risk Factors CAC Percentile
There were statistically significant differences between the CAC percentiles with respect to age with the most prominent difference between <50th percentile and above the >50th percentile (mean 52.11 and 60.37, respectively, P < .001). The 90th CAC percentile was also associated with the highest prevalence of diabetes mellitus (DM), hypertension, and dyslipidemia as shown in Table 1 (P = .002, .003, .001, respectively). There was no significant difference between the groups regarding creatinine levels (P = .949).
Platelet Indices (Other Than MPV) and CAC Percentile
Platelet count and PDW distribution for each of the 4 percentiles were associated with strong difference although it did not reach statistical significance (P = .054 and .088, respectively).
Medical Therapy and CAC Percentile
Interestingly, statin therapy, but not aspirin therapy was associated with higher CAC percentile (P = .001).
Univariate and Multivariate Analyses of MPV as a Predictor for CAC Percentiles
In a univariate analysis MPV, older age, history of DM, hypertension, or dyslipidemia were positively correlated to CAC percentiles (OR 1.45, 1.04, 1.78, 2.19, respectively). Moreover, statin therapy and high levels of LDL were also positively correlated with higher CAC percentiles (OR 2.69, 1.02, respectively) (Figure 2). In a multivariate analysis adjusted for age and gender, MPV was independently correlated with higher CAC percentile, (OR = 1.55 [CI 1.21-1.98], P < .001). Moreover, when further adjusting cardiovascular risk factors such as DM, hypertension, dyslipidemia, and smoking status, MPV was independently correlated with higher CAC percentile (OR = 1.57 [CI 1.22-2.01], P < .001). Lastly, when adjusting for statin therapy and LDL levels, MPV demonstrated the strongest correlation with higher CAC percentile (OR = 2.65 [CI 1.39-5.04], P < .001) as shown in Table 2.

Univariate analysis of factors associated with coronary artery calcification.
Multivariate Analysis of MPV as a Predictor of CAC Percentile.
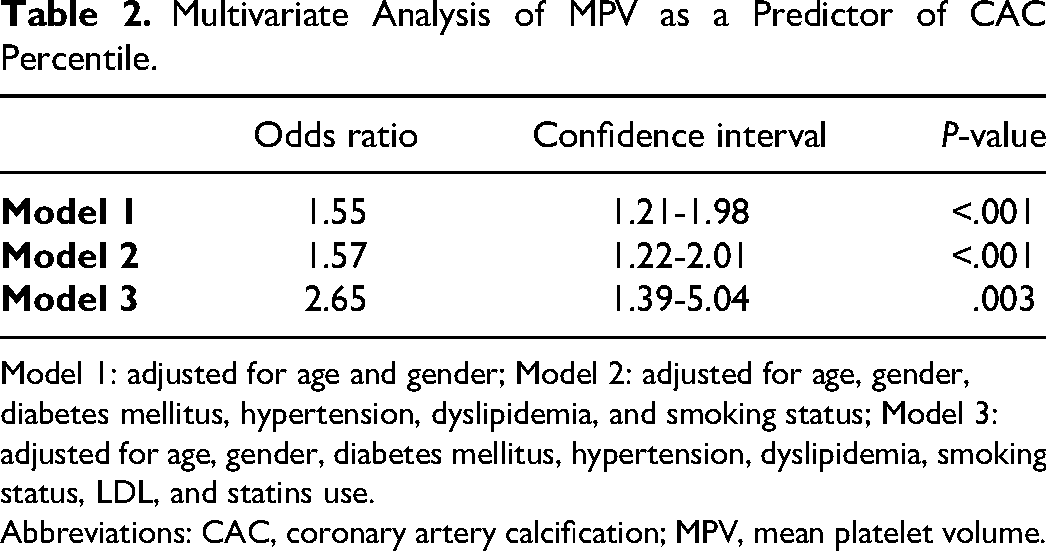
Model 1: adjusted for age and gender; Model 2: adjusted for age, gender, diabetes mellitus, hypertension, dyslipidemia, and smoking status; Model 3: adjusted for age, gender, diabetes mellitus, hypertension, dyslipidemia, smoking status, LDL, and statins use.
Abbreviations: CAC, coronary artery calcification; MPV, mean platelet volume.
Discussion
There are several important findings in the current study: first, we found a positive association between MPV and CAC percentile. This association was independent of demographic, medical background, statin use, and LDL level. Second, our results show that elevation of even 1 fL of MPV multiplies the risk of having a higher CAC percentile by 1.55-2.65. Third, the 90th CAC percentile was associated with the highest prevalence of DM, hypertension, dyslipidemia, and statin therapy.
Our findings support previous data as Jung, et al who examined 259 asymptomatic patients who underwent CCTA. 17 They defined CAC as CCS > 1 and found that patients with CAC had significantly higher MPV values than subjects without CAC and determined that MPV was an independent predictor of CAC. Nevertheless, the definition of CCS > 1 as CAC might not be accurate when assessing different gender and age. Our study utilized the MESA CAC Score reference values web tool to individually assess whether the patient's CCS is higher relatively to his age and gender percentiles. Our method adds not only a more accurate definition of CAC but a severity scale of the CAC. Interestingly, in contrast to other studies which reported that calcified plaque had no clear association with LDL levels,18,19 our results suggest a direct association between LDL levels and CAC percentile. Furthermore, diagnosis of dyslipidemia, which does not completely coincide with higher LDL levels due to possible undertreatment or under-responsiveness to statin therapy, was also found to be associated with a higher CAC percentile.
Statin use was also found to differ significantly between the groups and to be more prominent in higher CAC percentiles. This finding is in correlation with previous studies.20–25 Lee et al found that while the percent atheroma volume progressed slower in statin users, the progression of calcified percent atheroma volume increased more rapidly 20 (similar findings were observed in a study by Henein et al 21 ).
These results led the 2018 American Heart Association/American College of Cardiology (AHA/ACC) Cholesterol Management Guidelines to recommend that there is no clinical utility for CCS scoring in statin users. 22 Xian et al examined the effect of statin use on mice and found that pravastatin use may alter the progression and microarchitectural features of vascular calcium deposits. 23 Nevertheless, our study cannot determine the cause–effect relationship as to whether statin use elevated the CAC or CAC as a direct or indirect cause for statin use.
Lastly, other than MPV, the hematologic indices in our study, such as WBC, did not differ significantly between the groups which might suggest other mechanism for CAD on top of acute inflammation. 12 MPV elevation may be related to chronic inflammation or to higher turnover in bone marrow, due to hypercoagulability state.26,27 Other platelet activation indices such as platelet count and PDW were associated with a strong difference (although they did not reach statistical significance). These results further support the role of platelet activation in CAD and the specific elevation of MPV in CAC in comparison to other platelet activation indices.
Notably, MPV had relatively weaker association with CAC percentile in comparison diabetes, hypertension, dyslipidemia, and statin use. Nevertheless, the association between MPV and CAC percentile remained independent of those conditions which suggest appropriate use of MPV as a predictor of CAC percentile in patients with those conditions.
Our study had several limitations. First, its relatively small cohort; nevertheless, all patients were evaluated for chest pain and had a complete demographic, laboratory, and CCTAs scan. Second, the study design cannot assess a cause–effect relationship. Lastly, we did not perform a long-term mortality follow-up.
In conclusion, CAD prevention has several challenging aspects, among which is the early detection and classification of at-risk populations. There are several scoring systems designed to identify populations at risk, but there is always a need for a more accurate, simple, and inexpensive CAD markers. In this study, we found MPV, a simple and accessible blood test, to be an independent marker of CAC.
Although our results are to be verified by prospective large cohorts, these results might encourage the incorporation of MPV in early detection scoring and screening.
Footnotes
Declaration of Conflicting Interests
The authors declared no potential conflicts of interest with respect to the research, authorship, and/or publication of this article.
Ethic Aspects
The study was performed in accordance with the principles of the Declaration of Helsinki and was approved by the ethics committee at the SZMC. Informed consent was waived due to the retrospective nature of this study.
Funding
The authors received no financial support for the research, authorship, and/or publication of this article.