
Abstract
Background
The average frequency of thrombosis in patients with COVID-19 is still high despite low molecular weight heparin (LMWH) prophylactic. Global hemostasis assays, particularly thrombodynamics (TD), known to be sensitive to both hypercoagulation and heparin effects, could potentially be useful for individual management of anticoagulant therapy.
Methods
A total of 74 patients with lung involvement >50% were randomized into two groups: Group A (44 patients) received weight-based dosing of LMWH, and Group B (30 patients) received the first LMWH dose by a weight-based dosing protocol and then received an adjusted dose based on TD daily results. The endpoints of the study were thrombosis and bleeding as well as discharge or death of the patient.
Results
The incidence of thrombosis was 3 times lower in Group B under TD control compared to Group A without TD control: 7% versus 23 respectively (p = .05). The relative risk of thrombosis if the average clot growth rate V in TD exceeded the threshold value of 25 μm/min was 14.3 (p = .0005, 95% confidence interval 3.2-63.7). There were no clinically significant bleeding episodes in Group B while there were 7% in unregulated Group A. Mortality in Group B under TD control was lower than that in Group A without control: 27% versus 36%, respectively (p = .13).
Conclusions
The dosing LMWH under thrombodynamics control in severe patients with COVID-19 allows for a significant reduction in thrombotic complications. Long-term hypercoagulation revealed by thrombodynamics (3 and more days) is a strong predictor of thrombosis (AUC = 0.83).
Introduction
It is well known that SARS-CoV-2 infection causes a serious disorder in the hemostasis system that clinically manifests in the form of thrombosis, ischemic stroke and pulmonary embolism.1–8 Most international guidelines recommend using routine doses of thromboprophylaxis with LMWH in all in-hospital patients with COVID-19.9–13 Using therapeutic-intensity over prophylactic-intensity of anticoagulation are still de debatable,11–13 although some recommendations suggest to individualized the therapy in the assessment of the patient's risk of thrombosis and bleeding according to clinical scales. 11 It has been reported that thrombosis events can occur despite anticoagulation prophylaxis in severe patients with COVID-19.14–16 The behavior of routine coagulation tests, such as APTT, PT and INR, in patients with COVID-19 infection does not reveal the development of hypercoagulation.
Some researchers reported that APTT and PT were levels was normal in patients with COVID-19.17–22 However, there are publications indicating the elongation of APTT and PT, both in ICU18,23–27 and non-ICU patients.19,20,26,28–31 We observed a lack of coherence in the behavior of the standard clotting tests in different studies. However, fibrinogen levels are reported to be elevated both in severe patients22–24,26,27 and in hospitalized patients with mild illness.17,26,31 The most significant changes among standard tests were obtained for D-dimer levels. The authors described the progression of the hypercoagulation state with elevated D-dimer levels in patients with COVID-19 infection.1–3,5–7,17–19,21,22,24,26,28,30,32 In addition, the analysis showed that D-dimer values are significantly higher in patients with severe illness than in mild patients.17–19,21,25,31 However, the assessment of the effectiveness of anticoagulant therapy using laboratory methods remains unclear.
Recent studies on global hemostatic assays thromboelastography (TEG), thrombin generation tests (TGT) and rational thromboelastometry ROTEM revealed hypercoagulation in patients with COVID-19.24,27,33–36 The TD assay has also already shown the expected sensitivity to the hypercoagulation state in patients with SARS-CoV-2 infection on admission as well as the effect of anticoagulant therapy in these patients during treatment. 37 This once again indicates a strong increase in coagulation potential in COVID-19 patients.
It has been confirmed that the risk of thrombosis is much higher in hospitalized COVID-19 patients, especially those admitted to the ICU. 38 Approximately 6% to 25%4,39 of hospitalized patients with COVID-19 develop venous thromboembolism (VTE), and this rate can be as high as 70% in ICU patients with COVID-19 infection (ranging from 11% to 70% for VTE in ICU COVID-19 patients).3,16,40,41 Thus, considering previous experience with TD assays,42–44 our study was designed to assess the effectiveness of TD assays for individual anticoagulation control in patients with SARS-CoV-2 infection for decreasing thrombohemorrhagic complications.
Methods
Participants and Design
A total of 106 patients (18 years and older, 60 men) with confirmed COVID-19 diagnoses admitted to the ICU were included in the study. The study was approved by the Independent Ethics Committee of City Clinical Hospital №52 of the Moscow Health care Department (№ 01вн/0221 issued on the third of March 2021).
Patient inclusion criteria
Age 18–80 years. Confirmed COVID-19 diagnosis, pneumonia (with lung involvement >50% by CT scan; CT 3-4 degree). Criteria for not including patients in the study group on admission:
The patient had a prior history of LMWH/UFH treatment for 7 days or more. Continued use of previously prescribed oral anticoagulants during hospitalization. Concomitant diseases in decompensation stage (blood system disorders, liver cirrhosis, active cancer). Hemorrhagic syndrome, bleeding or other contraindications for anticoagulant therapy. Criteria for exclusion of patients from the study group during the study:
Patient's nonconsent to continue the study. Transfer to extracorporeal membrane oxygenation (ECMO). Decision of the attending physician. Criteria for exclusion of patients from the study results analysis:
Violation of patient protocol management—failure to comply with LMWH therapy adjustment rules in the correction group for more than 2 consecutive days. The patient was involved in the study protocol for less than 3 full days. The patient had a prior history of LMWH/UFH treatment for 7 days or more. Criteria for temporary suspension/termination of the study:
Systematic noncompliance with therapy adjustment rules in the correction group (more than 30% of cases). Systematic preanalytical errors—violation of rules of blood sample collection, storage and transportation (in more than 30% of cases). Switching anticoagulant therapy from LMWH to UFH. In case the interim analysis of the study results, performed at least once a month, showed a significantly higher incidence of thrombohemorrhagic complications in the correction group.
Randomization
After inclusion in the study, all patients were divided into 2 groups, depending on what information would be used to prescribe and adjust their anticoagulant dosage:
Group A (or “1”)—no adjustment, weight-based dosing: LMWH at a dosage of 100 IU/kg 2 times a day (12:00 and 00:00) Group B (or “2”)—dosage adjustment according to the results of thrombodynamics tests: on the first day LMWH is prescribed at a dosage of 100 IU/kg 2 times a day (12:00 and 00:00), then (on the subsequent days) the dosage is adjusted based on the test results.
Patients were randomized using sealed envelopes with a unique code inside each envelope (simple randomization). When a new patient was included in the study, the treating physician randomly selected an envelope from the set, opened it, and attached the unique code to the patient's case report form (CRF). Using this code and the randomization table, the principal investigator determined the group into which the patient would be assigned and communicated this to the treating physician.
Blood Collection and Plasma Preparation
Blood samples were drawn daily into 3.6-mL vacuum tubes (Univac, Russia) with 3,2% sodium citrate buffer in the morning immediately before the next injection of LMWH (“on the tail end” of LMWH). The blood samples were processed by centrifugation at 1500 × g for 15 min to obtain platelet-poor plasma (ppp), and part of the plasma was subsequently subjected to centrifugation at 10,000 × g for 5 min to obtain platelet-free plasma (pfp).
Thrombodynamics Assay
The general concept of the test was described previously.42,43,45 The thrombodynamics assay was performed using Thrombodynamics Analyser System T2-F and Thrombodynamics TDX kits (HemaCore LLC, Moscow, Russia). The coagulation process in thrombodynamics starts from a localized surface that has immobilized tissue factor mimicking blood vessel wall damage. The process of fibrin clot formation was recorded in time-lapse video microscopy mode by means of the dark-field light scattering method. The obtained series of photos showed how the form, size, and density of the fibrin clot changed over time. On the basis of the recorded photos, the stationary rate of clot growth (V) was calculated as the mean clot growth rate at an interval of 15 to 25 min after the beginning of clot growth. For healthy persons, the normal reference range is 20 to 29 μm/min.
LMWH Dosage Adjustment According to TD Results
The TD algorithm for LMWH dose correction in Group B is presented in Figure 1.

Thrombodynamics-guided thrombosis prophylaxis algorithm compared to standard anticoagulation dosing.
After entering the study, the patients from Group B started to receive a standard weight-adjusted LMWH dosage of 100 IU/kg 2 times a day. If the standard dose of LMWH did not bring the thrombodynamics parameter V (clot growth rate) into the target range of moderate hypocoagulation18–26,28,29 μm/min before the third or fourth injection, a sequential correction of the dosage was performed in steps of no more than ± 2500 IU at the next injection of the drug (in the evening) with the control of the effect after the next injection.
Outcomes
Discharge with recovery
Death
Thrombosis, pulmonary embolism, stroke
Clinically significant bleeding (BARC types 2-5)
Characteristics of the Groups
A total of 106 patients were included in the study. As a result of randomization conducted at the time of patient entry into the study, there were 49 patients in Group A and 57 patients in Group B (see Table 1).
Group Composition.

During protocol management, 32 patients were excluded in accordance with the accepted exclusion criteria—violation of LMWH therapy regimen, short duration of stay in the study, and history of long-lasting anticoagulant therapy (for patients transferred from other hospitals). Thus, 44 patients remained in Group A, and 30 patients remained in Group B for further analysis (a total of 74 patients, see Table 1).
The demographic and age characteristics of the analyzed groups, as well as data on length of stay, are presented in Table 2. There were no statistically significant differences between the analyzed groups by age or length of stay in hospital (p = .22 and p = .45, respectively, Mann–Whitney U test).
Group Characteristics.

Data presented as absolute value [% of total] or as median [interquartile range].
Differences between the analyzed groups did not exceed 10% for comorbidities (see Table 3).
Comorbidities.

Overall, the two groups were comparable.
Statistical Analysis
Fisher's exact test (p < .05) and the Mann–Whitney U test (p < .05) were used to reveal statistically significant differences in the groups. ROC analysis was performed to establish thrombodynamic predictive power and cutoff values. Statistical analyses were performed using Microsoft Excel (Microsoft, USA) and MedCalc (MedCalc Software Ltd, Belgium).
Data Sharing Statement
For original deidentified data, please contact Sergey S. Karamzin karamzin@yandex.ru.
Results
Thrombosis
All episodes of thrombotic complications were classified into the following types:
- Thrombosis at entry—at the time a patient was included in the study, thrombosis was detected by the first ultrasound or CT scan (carried out no later than three days from the day of entry). These thrombotic complications were not included in further analysis. - Primary thrombosis (hereafter simply “thrombosis”) is thrombosis detected by ultrasound or CT scan when there was no thrombosis on previous evaluation. Further analysis was performed only for this type of thrombosis.
The incidence of thrombosis was 3 times lower in Group B, where anticoagulation was performed under TD control, compared to Group A without TD control (Figure 2): 7% (2 of 30 cases) versus 23% (10 of 44 cases), respectively (p = .05, Fisher's exact test).

The incidence of thrombosis in Groups A and B. *–statistically significant differences (p < .05, Fisher's exact test).
The distribution of V values in the TD assay (Figure 3) shows that the majority of values for patients with thrombotic episodes are in the hypercoagulation range (V > 29 µm/min)—56%, compared to only 12% in patients without thrombosis.

Distribution of V values in the TD assay for patients with and without thrombotic events. For patients with thrombosis, only measurements preceding the first thrombotic episode are taken into account.
Types of thrombotic complications are presented in Table 4.
the Types of Thrombotic Complications.
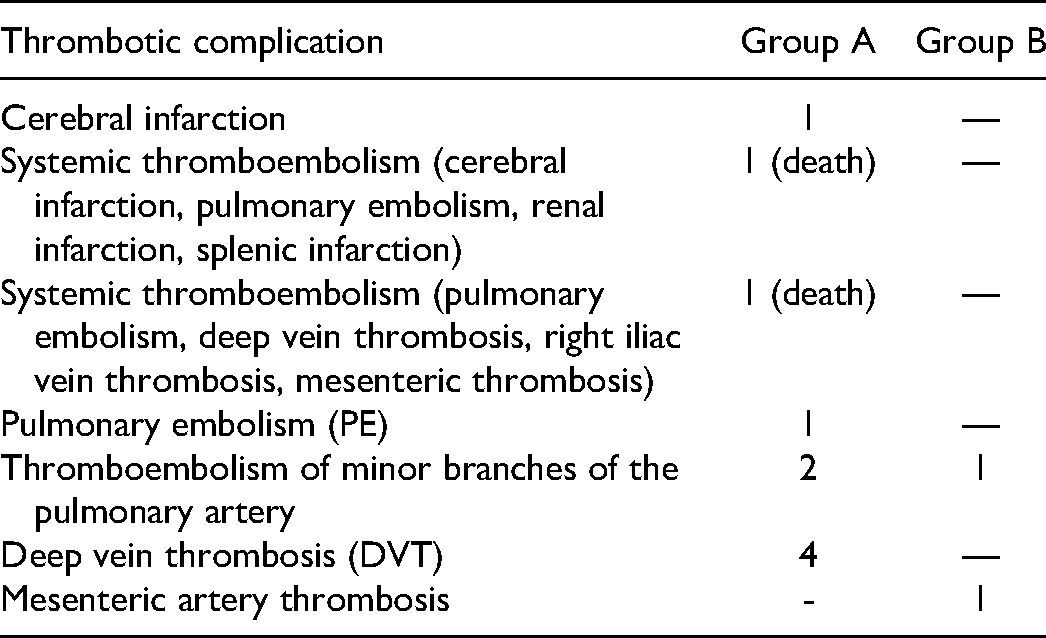
It should be noted that only 2 of the 12 thromboses with a high probability were the reason for death. In both cases, systemic thrombosis affected different organs, including the brain.
Bleeding
There were no clinically significant bleeding episodes in Group B, and there were 3 episodes in Group A: neck hematoma in one patient, gluteal hematoma with hip hematoma in the second patient and inguinal hematoma with hip hematoma in the third (Figure 4). The number of outcomes is not enough for statistical analysis.

The incidence of bleeding in Groups A and B.
Fibrinogen levels were normal or even higher in patients with neck and inguinal hematomas before the hemorrhagic episode (4.8 and 3.7 g/l, respectively, with a normal range of 2-4 g/l). The patient with gluteal hematoma had a slight reduction in fibrinogen levels to a minimum of 1,89 g/l. Interestingly, platelet levels were in the normal range in the patient with neck hematoma (402-451*109/l with normal range 150-450*109/l). The patients with inguinal and gluteal hematomas had thrombocytopenia values of 40-50*109/l and 50-63*109/l, respectively, 3 days before the observation of bleeding. The patient with inguinal hematoma received substitution platelet therapy with an effect of 159*109/l the day before bleeding. It is possible that the cause of bleeding in these patients was the low PLT levels. There were no deaths due to hemorrhagic complications.
The rate of death was lower in Group B with TD anticoagulation control than in weight-based Group A (27% in Group B vs 36% in Group A, Figure 5), although there was no significant difference (p = .13, Fisher's exact test).

Death and survival rates in Groups A and B among 74 patients enrolled in the analysis.
Differences Between Patients with and Without Thrombosis
While observing the individual dynamics of the V parameter in patients, it was noticed that thrombosis is usually caused not by a single episode of hypercoagulation (which can be caused by one of the numerous therapeutic interventions to which patients in the ICU are much more often exposed than patients in therapeutic departments) but by a state of lasting hypercoagulation (3 or more days). An illustrative example of such chronic hypercoagulation leading to thrombosis is shown in Figure 6.

Individual dynamics of clot growth rate V by days of stay in the ICU in patients from Group A with developed thrombosis. The gray rectangular area is the target range for clot growth rate V. The V values measured over the three days preceding thrombosis are additionally highlighted in red.
V values for the patient are not only above the target range of moderate hypocoagulation (13-23 μm/min) but also above the normal range (the upper limit of normal is 29 μm/min). The patient had several episodes of thrombosis. Strong hypercoagulation persisting for several days leads to brain infarction and then to venous thrombosis without signs of recanalization later on.
It has been hypothesized that long-standing hypercoagulation leads to thrombosis. The average clot growth rate <V3> over a three-day interval was chosen as a parameter characterizing both the severity and duration of hypercoagulation (such averaging also allows us to smooth out possible daily fluctuations of hemostasis, which are typical for severe ICU patients who undergo heterogeneous daily interventions, and to exclude the influence of possible single preanalytical errors in the analysis results).
All patients were divided into two groups: without (Group 1) and with (Group 2) thrombosis. As thrombosis was always confirmed by regularly performed ultrasound Dopplerography (USDG) or CT scan, the mean clot growth rates <V3> three days before the USDG/CT scan were calculated for these two groups. In the group without thrombosis, all mean clot growth rates preceding all USDG/CT scans were included in the analysis. In the group with thrombosis, all mean clot growth rates preceding USDG/CT scans in which thrombosis was detected were included in the analysis. This is shown graphically in Figure 7.

Sampling principle of mean clot growth rate <V3>. For Group 1, all mean clot growth rates three days before each USDG/CT scan were included in the analysis. For Group 2, mean clot growth rates three days before USDG/CT scan that confirmed thrombosis were included in the analysis.
The Mann–Whitney U test revealed that the groups significantly differed with a high level of significance (p = .0002) (see Figure 8a). In Group 1 (without thrombosis), only 25% of <V3> values lie in the area of hypercoagulation (above the target range indicated by the green shading), while in Group 2 (with thrombosis), more than 75% of values lie in the area of hypercoagulation.

TD assay mean clot growth rate at the 3-day interval <V3> (a), fibrinogen level (b), PT (c), APPT (d) for patients with and without thrombosis. The gray area shows target/normal reference ranges. The box plot indicates the following parameters: the median (the horizontal line inside the box), the 25th and 75th percentiles (the bottom and the top of the box, respectively), and the fifth and 95th percentiles (the end of the whiskers). * - statistically significant differences (Mann–Whitney U test criterion, p < .01). NS represents no significant difference.
Fibrinogen levels and standard clotting times APTT and PT revealed no differences (p > .01) between groups of patients with and without thrombotic complications (Figure 8b to d)
Thrombodynamic Predictive Power
ROC analysis showed that the TD parameter mean clot growth rate V at the 3-day interval (<V3>) had a high predictive power for thrombosis (area under the ROC curve AUC = 0.83, Figure 9). The cutoff value for <V3> was 25 μm/min (sensitivity 80%, specificity 80% for thrombosis detection).

ROC curve for the mean clot growth rate at the 3-day interval <V3>.
The relative risk of thrombosis if the mean clot growth rate <V3> exceeded the threshold value of 25 μm/min was 14.3 (p = .0005, 95% confidence interval 3.2-63.7).
Discussion
COVID-19 patients in the ICU had a nearly 3 times higher incidence of symptomatic thrombosis events.40,41 The use of anticoagulation therapy during COVID-19 treatment is a clinical guidance. The goal is now the management and adjustment of appropriate doses of anticoagulants. It is reported the incidence of VTE for all hospitalized patients with COVID-19 (n = 579), despite universal prophylaxis, was 18.7% (95% CI: 14.0-23.4) compared with 1.04% (95% CI: 0.92-1.16) in 27,980 patients hospitalized for influenza during 2013 to 2018 in the same hospitals. 14 According to Leentjens et al., 15 the average frequency of venous thromboembolic complications in ICU patients with COVID-19 is nearly 45%, despite prophylactic and even therapeutic doses of LMWH. American Society of Hematology 2021 reported in the latest guidelines on the use of anticoagulation for thromboprophylaxis in patients with COVID-19 (August 26, 2022) that an individualized assessment of the patient's risk of thrombosis and bleeding is important when deciding on anticoagulation intensity. 11 But summarizing the experience of the application of routine coagulation tests in COVID-19 patients, it can be noted that standard clotting times (APTT, PT) are not sensitive to multiple disorders of the hemostasis system during coronavirus infection.1–3,5–7,16–22,29,46,47 Measurements of concentrations of FVIII activity and of von Willebrand factor (vWF) antigen, or concentration of protein C, antithrombin III anticoagulants and the components of the fibrinolysis system (t-PA, TAFI, PAI-1, alpha2-antiplasmin) showed that these markers are also not helpful in determining risk groups for thrombotic complications or death in patients with COVID-19.17,22,24,34,48 In contrast, global hemostasis assays revealed hypercoagulation in these patients.3,16,40,41 Panigada et al. 24 compared heparinase-modified TEG in 30 severe COVID-19 patients and in a control group of 40 healthy volunteers. The authors noted a significant increase in the angle α (in 72% of patients) and in maximum amplitude (МА) (in 83% of patients) compared to the controls. ROTEM also revealed the presence of hypercoagulation in more than 50% of patients with COVID-19.20,21 The TD assay also showed the expected sensitivity to the hypercoagulation state in patients with SARS-CoV-2 infection on admission as well as the effect of anticoagulant therapy in these patients during treatment. 37 Additionally, the Kofteridis et al. 49 study about the role of anti-Xa activity in monitoring anticoagulation therapy during COVID-19 treatment is interesting. They reported that 81% of patients with a standard approach to anticoagulation therapy needed dose adjustment due to lower than target anti-Xa levels. This also confirms the real need for the individual correction of anticoagulation therapy in COVID-19 patients.
Global tests are also useful for evaluation the state of hemostasis system on anticoagulation therapy. Our study showed that individualization of anticoagulant dose based on thrombodynamic test results improved outcomes in patients with severe COVID-19 virus infection—the incidence of thrombosis was 3 times lower in the group with TD-based LMWH control than in the group without TD control: 7% versus 23%, respectively (p = .05, Fisher's exact test). Hranjec et al. 50 used TEG with a platelet mapping addition to monitor anticoagulation therapy in 72 patients with COVID-19. The authors developed a system for increasing and decreasing the enoxaparin dose related to TEG parameters. Unfortunately, the authors did not perform a comparison of groups by thrombotic or hemorrhagic complications, but they reported that patients not controlled by TEG had an increased risk of death (relative risk = 7.7; p < .0001). In contrast, we did not find a strong difference in mortality between groups, but the relative risk of thrombosis in the group not controlled by TD in our study was 14.3 (p = .0005, 95% confidence interval 3.2-63.7) if the average clot growth rate exceeded the threshold value of 25 μm/min.
There was no clinically significant bleeding in the TD-guided group, while it was 7% in the unregulated group. Due to the small number of bleeding episodes (3 cases), statistical analysis was not possible, but the very rare occurrence of clinically significant hemorrhagic complications suggested relatively safe usage of therapeutic doses of LMWH in severe ICU patients. Mortality in the TD-guided group was lower than that in the group without TD control: 27% versus 36%, respectively (p = .13).
Chronic hypercoagulation by thrombodynamics (persisting for three or more days) appears to be a sensitive predictor of thrombosis (AUC = 0.83). In patients on therapeutic doses of LMWH, the relative risk of thrombosis was 14 times higher when the mean clot growth rate V at the three-day interval exceeded the threshold value of 25 μm/min (blood collection before the next injection of LMWH).
From a practical point of view, TD can be recommended for daily monitoring of the hemostasis system in severe ICU patients with COVID-19 in addition to fibrinogen and D-dimer levels. While using therapeutic dosages of LMWH for those patients, one should strive to keep thrombodynamic clot growth rate V in the range of moderate hypocoagulation (13-23 μm/min) “on the tail end” of the effect of LMWH.
Footnotes
Acknowledgments
The team of authors expresses their deep gratitude to the team of volunteers who participated in the implementation of the project: Elizaveta Bovt, Oles Eliseeva, Irina Jumaniyazova, Lidia Nekrasova, Irina Markova, Sergei Obydenny, and Fedor Balabin.
The authors express their special gratitude to all the staff of City Clinical Hospital No. 52 for the opportunity to conduct regulated research work and timely data collection.
The authors also express their gratitude to Tatyana Popova and Alexey Ivanov for their invaluable contribution to the work with the data array and graphical data processing.
Authorship Contributions
S.S.K. and V.T.A. conceived of the presented idea. S.S.K, V.T.A., S.V.T. and E.V.F. contributed to the design and implementation of the research, to the analysis of the results. E.A.S. wrote the paper with input from all authors.
Declaration of Conflicting Interests
The author(s) declared the following potential conflicts of interest with respect to the research, authorship, and/or publication of this article: S.S.K. is an employee of HemaCore LLC, which holds several patents and patent applications related to the diagnostic use of spatial clot growth and developed an assay under the trade name thrombodynamics®.
Funding
The author(s) received no financial support for the research, authorship, and/or publication of this article