
Abstract
Aim
There is no model for predicting the outcomes for coronary heart disease (CHD) patients with chronic kidney disease (CKD) after percutaneous coronary intervention (PCI). To develop and validate a model to predict major adverse cardiovascular events (MACEs) in patients with comorbid CKD and CHD undergoing PCI.
Methods
We enrolled 1714 consecutive CKD patients who underwent PCI from January 1, 2008 to December 31, 2017. In the development cohort, we used least absolute shrinkage and selection operator regression for data dimension reduction and feature selection. We used multivariable logistic regression analysis to develop the prediction model. Finally, we used an independent cohort to validate the model. The performance of the prediction model was evaluated with respect to discrimination, calibration, and clinical usefulness.
Results
The predictors included a positive family history of CHD, history of revascularization, ST segment changes, anemia, hyponatremia, transradial intervention, the number of diseased vessels, dose of contrast media >200 ml, and coronary collateral circulation. In the validation cohort, the model showed good discrimination (area under the receiver operating characteristic curve, 0.612; 95% confidence interval: 0.560, 0.664) and good calibration (Hosmer-Lemeshow test, P =
Conclusions
We created a nomogram that predicts MACEs after PCI in CHD patients with CKD and may help improve the screening and treatment outcomes.
Introduction
Chronic kidney disease (CKD) is an independent risk factors for poor prognosis of coronary heart disease (CHD), and CHD complicated with CKD is closely related to poor prognosis.1–4 For patients with comorbid CKD and CHD, severe cardiac events are often life-threatening, as opposed to deterioration of renal function.4 CKD has a severe impact on evaluations performed prior to coronary angiography and on the rate of further revascularization, thereby affecting prognosis.5 When comparing two means of revascularization in patients with comorbid CKD and CHD, most studies found that coronary artery bypass grafting was associated with better long-term prognosis than was percutaneous coronary intervention (PCI).6 The choice of PCI or coronary artery bypass grafting is usually based on surgical risk and patient preference. Despite the poor prognosis of PCI, a large number of patients with comorbid CKD and CHD choose it as the means of revascularization.
Unfortunately, most prospective clinical studies exclude patients with CKD, and the few studies that include CKD patients included no subgroup analysis.7 Therefore, PCI treatment of CKD-CHD patients lacks a basis in evidence, and the risk factors affecting PCI outcomes remain unclear. Hence, it is critical to establish a prediction model of outcomes following PCI in patients with CHD-CKD to guide the choice of procedure, predict risks, and improve outcomes.
Nomograms calculated from predictive models are accepted as trusted tools for predicting risk by illustrating predictive factors in terms of clinical features of prognostic events. They return predictive probabilities for various events. We developed and validated a nomogram of major adverse cardiovascular events (MACEs) for patients with comorbid CKD and CHD undergoing percutaneous coronary intervention.
Study Population and Methods
Patient Selection
We included 1714 consecutive patients with comorbid CKD and CHD undergoing PCI from January 1, 2008 to December 31, 2017. The development cohort included 1258 patients between January 1, 2008 and December 31, 2014. The validation cohort included 456 patients between January 1, 2015 and December 31, 2017. This study was approved by the Ethics Committee of Beijing Anzhen Hospital. The requirement for informed consent was obtained for this study. The flowchart outlining the study is shown in Figure 1.

Flow chart of patient selection.
We defined CKD as the estimated glomerular filtration rate(eGFR) below 60 ml/min.1.73m2 for at least 3 months or diagnosis with chronic renal insufficiency according to the International Classification of Disease-10. Patients were excluded if their eGFR progressively recovered to normal or they failed PCI. PCI was defined as balloon dilatation and drug-eluting stent implantation after coronary angiography. And “failed PCI” was defined as failure to stent implantation and balloon dilation, or percutaneous coronary balloon dilation only. Non-Asians were also excluded.
We searched the clinical database via International Classification of Disease-9 and International Classification of Disease-10 in the electronic medical record system of Anzhen Hospital and established Excel database based on these record, double inputted and checked to ensure the accuracy of data. All the patients undergone PCI were followed up by the research team blind to the enrollment to reduce measurement bias.
Baseline Characteristics and Outcomes
Demographics included sex, age, height, weight, and body mass index. Medical history, diagnosis, positive family history of CHD, history of revascularization, smoking history and smoking index, hypertension, diabetes, heart failure, dyslipidemia, and old cerebral infarction. Laboratory indexes included the first complete blood counts, liver functions, renal functions, blood fat levels, electrolytes, markers of myocardial injury, and coagulation functions after admission. The characteristics of coronary lesions included the number of diseased vessels, nature of the lesion, site and severity of stenosis, Gensini score, target vessel, type and number of stents, and dose of contrast media.
Follow-up was conducted using outpatient and telephone follow-ups and medical records. The definition of MACEs was recurrent angina(persistence or recurrence of angina after PCI), recurrent myocardial infarction, or “repeated target lesion revascularization”(revascularization was performed due to stent restenosis or progression of target vessel disease), all-cause death or cardiac death within three years after PCI.
Statistical Analysis
All data were statistically analyzed using SPSS 25.0 for Windows (IBM Corp.), Stata 15.0 (Stata Corp.), and RStudio (version 3.5, “rms” and “glmnet” packages; http://www.Rproject.org). All continuous variables were tested for normality using the Kolmogorov-Smirnov method. Normally distributed continuous variables are expressed as mean ± standard deviation, and were compared using independent sample Student t-test. Non-normally distributed variables are expressed as median and interquartile range, and were compared using the Mann-Whitney U-test. Categorical variables are expressed as number and percentage, and were compared using the chi-square and Fisher exact tests. Statistical significance was defined as P < .05 with two-sided tests.
The least absolute shrinkage and selection operator method was used to select the most useful predictive features from the primary data set. When lambda reaches a certain size, increasing the number of independent variables or decreasing lambda cannot significantly improve the performance of the model. Therefore, “lambda.1se” (minimum lambda double labeling error) and 10-fold cross-validation via minimum criteria gives a model good performance and minimum independent variables. The binary logistic regression was established with the selected variables, and the area under the receiver operating characteristic curve (AUROC) was calculated.
The data from the independent validation cohort were used to check the performance of the model. All predictive factors that were filtered out in the development cohort formed a logistic regression formula, and were calculated to show the probability for each patient. The AUROC curves were measured to quantify the discrimination performance of the model in the development and validation cohorts. If the AUROC equals 0.5, a diagonal line indicates that the model has no discrimination. If the AUROC approximates 1, it indicates stronger discrimination. Calibration plots were used to assess the calibration of the model, accompanied by the unreliability test and Hosmer-Lemeshow test (P > .05 supports the goodness of calibration). Good calibration is indicated by fitting the line with a slope on a 45° angle and passing through the origin.
Decision curve analysis was used to evaluate the net benefit and to determine the clinical usefulness in the validation cohort. Plotting net benefit against each threshold probability yields the “decision curve,” and the threshold probability range can be calculated.
By visualizing all of the predictive factors in the model with lines and assigning a score depending on the different weights, we calculated the total score of all of the predictive factors and corresponding risks.
Results
The development cohort included 1258 patients, and the incidence rate of overall MACEs was 53.42% (672 patients). The validation cohort included 456 patients, and the incidence rate of overall MACEs was 44.96% (205 patients). Univariate analysis showed the relationship between each variable and the occurrence of overall MACEs (Tables 1, 2).
Univariate analysis of patients in the development and validation cohorts.

MACEs, major adverse cardiovascular events; SBP, systolic blood pressure; DBP, diastolic blood pressure; HR, heart rate; BMI, body mass index; PFH, positive family history; SCD, sudden cardiac death; ACS, acute coronary syndrome; OMI, old myocardial infarction; HF, heart failure; CKD, chronic kidney disease; TRI, transradial intervention; SVD, single-vessel disease; DVD, double-vessel disease; TVD, three-vessel disease; ARI, acute renal injury; CCC, coronary collateral circulation; PCI, percutaneous coronary intervention; LM, left main; DAPT, dual antiplatelet therapy; RAASI, renin- angiotensin- aldosterone system inhibitors; LMWH, low-molecular-weight heparin; PPI, proton pump inhibitors; WBC, white blood cell; LDLC, low-density lipoprotein cholesterol; CRP, C-reactive protein; INR, international normalized ratio
Composition of MACEs in the development and validation cohorts.

MACEs, major adverse cardiovascular events;
We incorporated all variables into least absolute shrinkage and selection operator regression to identify predictive factors to build regression models. The lambda.min value was 0.01693237, and lambda.1se value was 0.02456597. The variables that were not compressed to 0 at lambda.1se were identified as predictor factors: positive family history, history of revascularization, ST segment change, anemia (serum hemoglobin was less than 120 g/L in male and 110 g/L in female), hyponatremia (serum sodium was less than 135 mmol/L), transradial intervention, the number of diseased vessels, dose of contrast media >200 ml, and coronary collateral circulation. Grades 1 to 3 were considered as effective coronary collateral circulations by the Rentrop-Cohen classification. Grade 1defined as collateral filling of branches of the vessel without visualization of epicardial artery, grade 2 as partial collateral filling of the epicardial artery, and grade 3 as complete collateral filling of the epicardial artery (Figure 2). On the basis of these results, we developed a prediction model (Table 3), from which a nomogram that predicts the incidence rate of overall MACEs after PCI for CKD-CHD patients was generated (Figure 3).
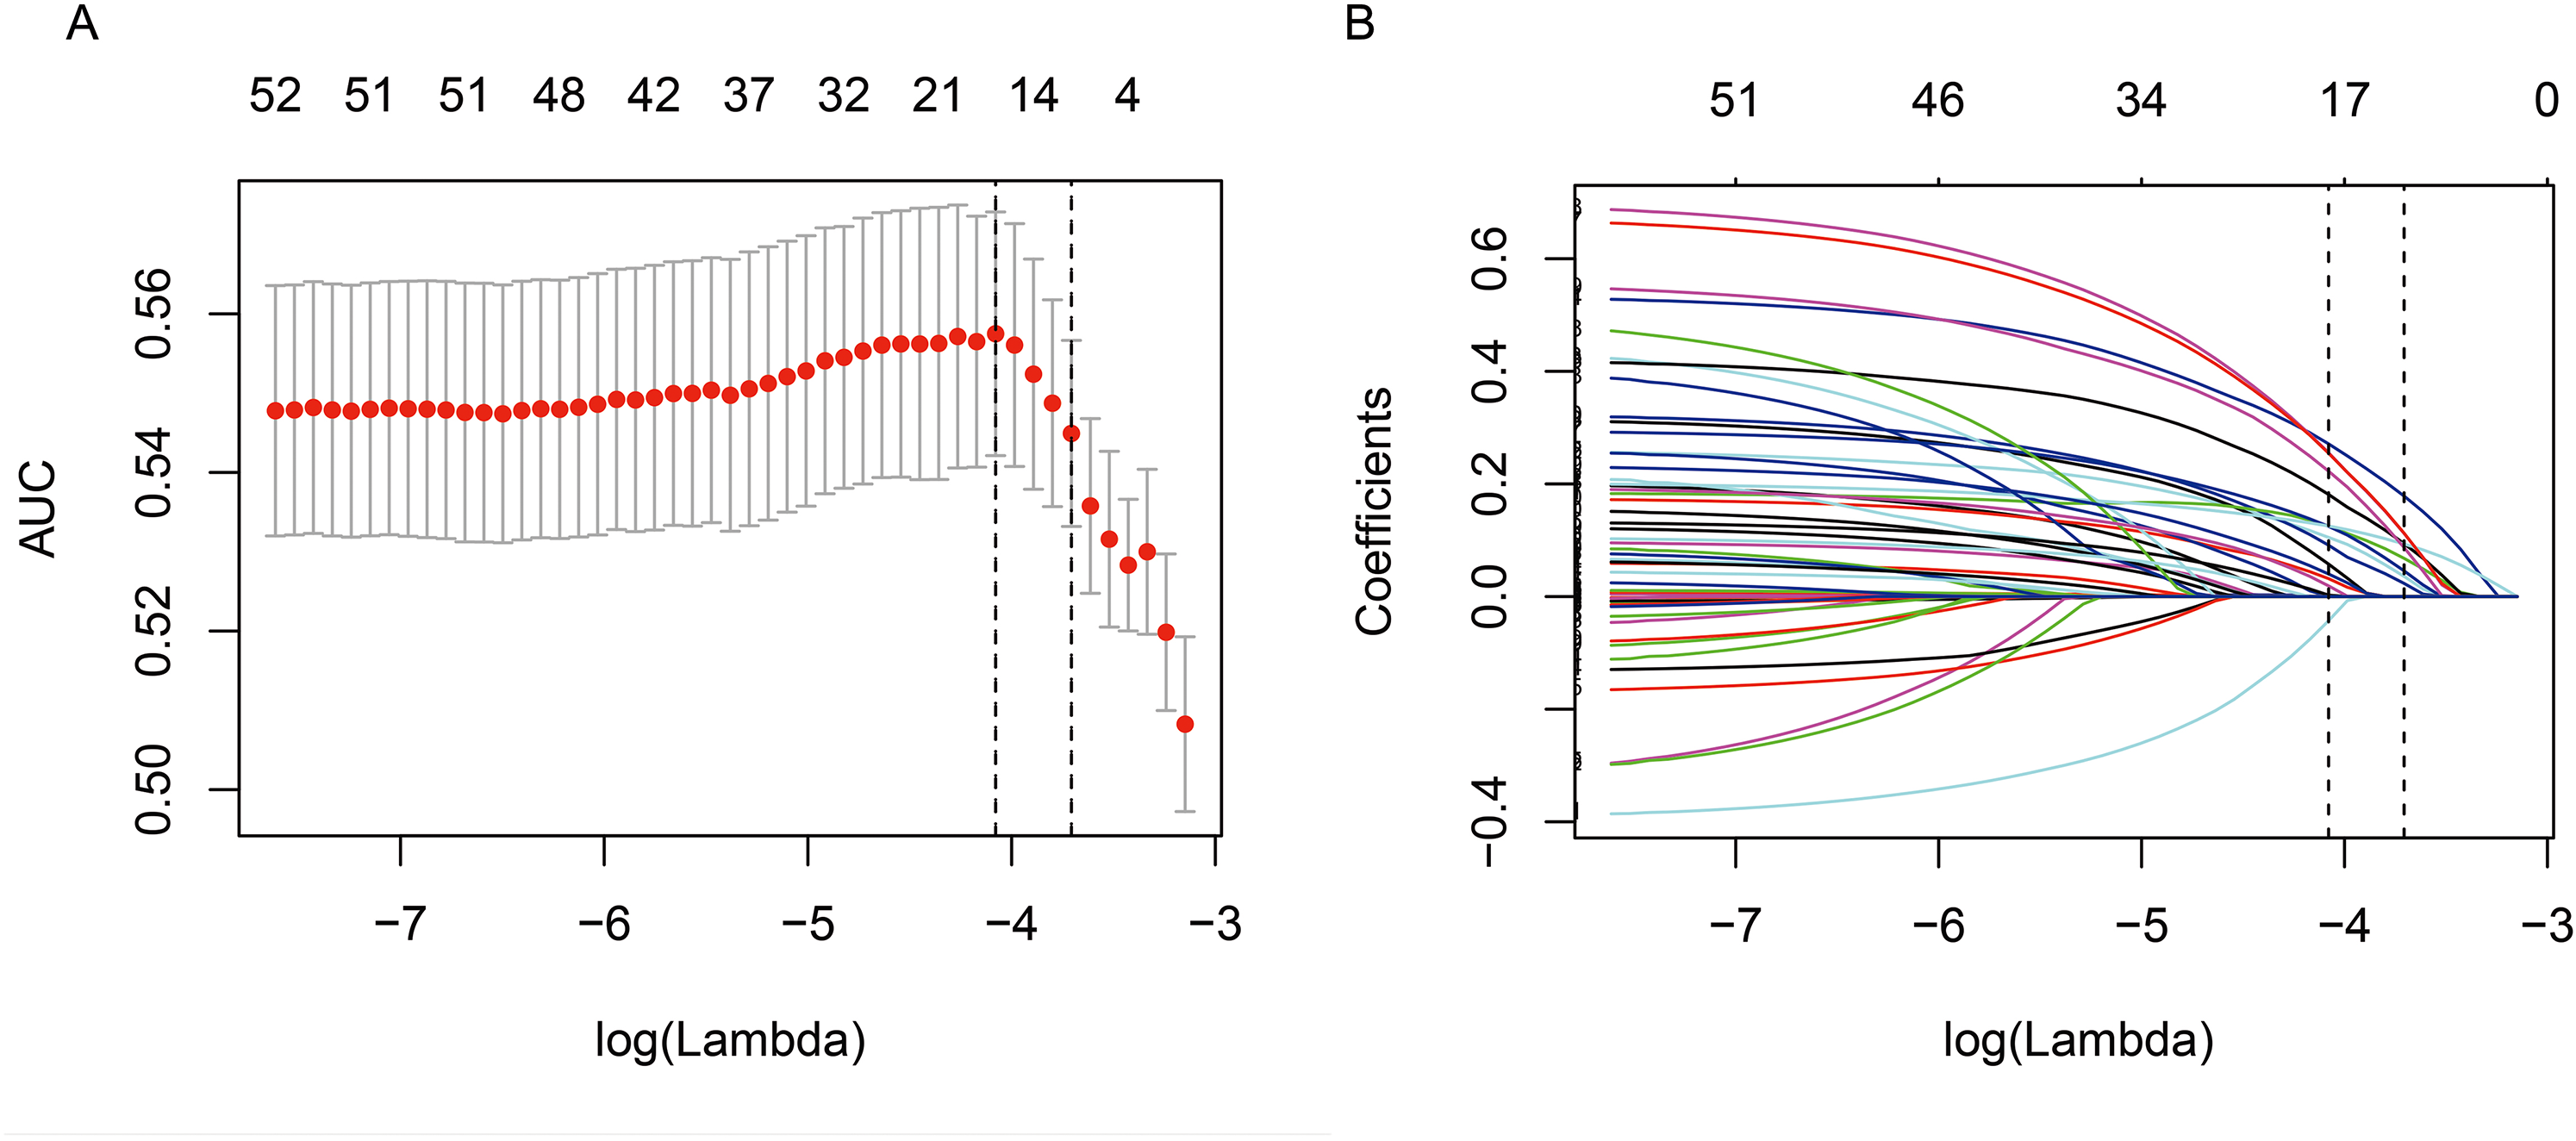
Texture feature selection using the least absolute shrinkage and selection operator (LASSO) binary logistic regression model.
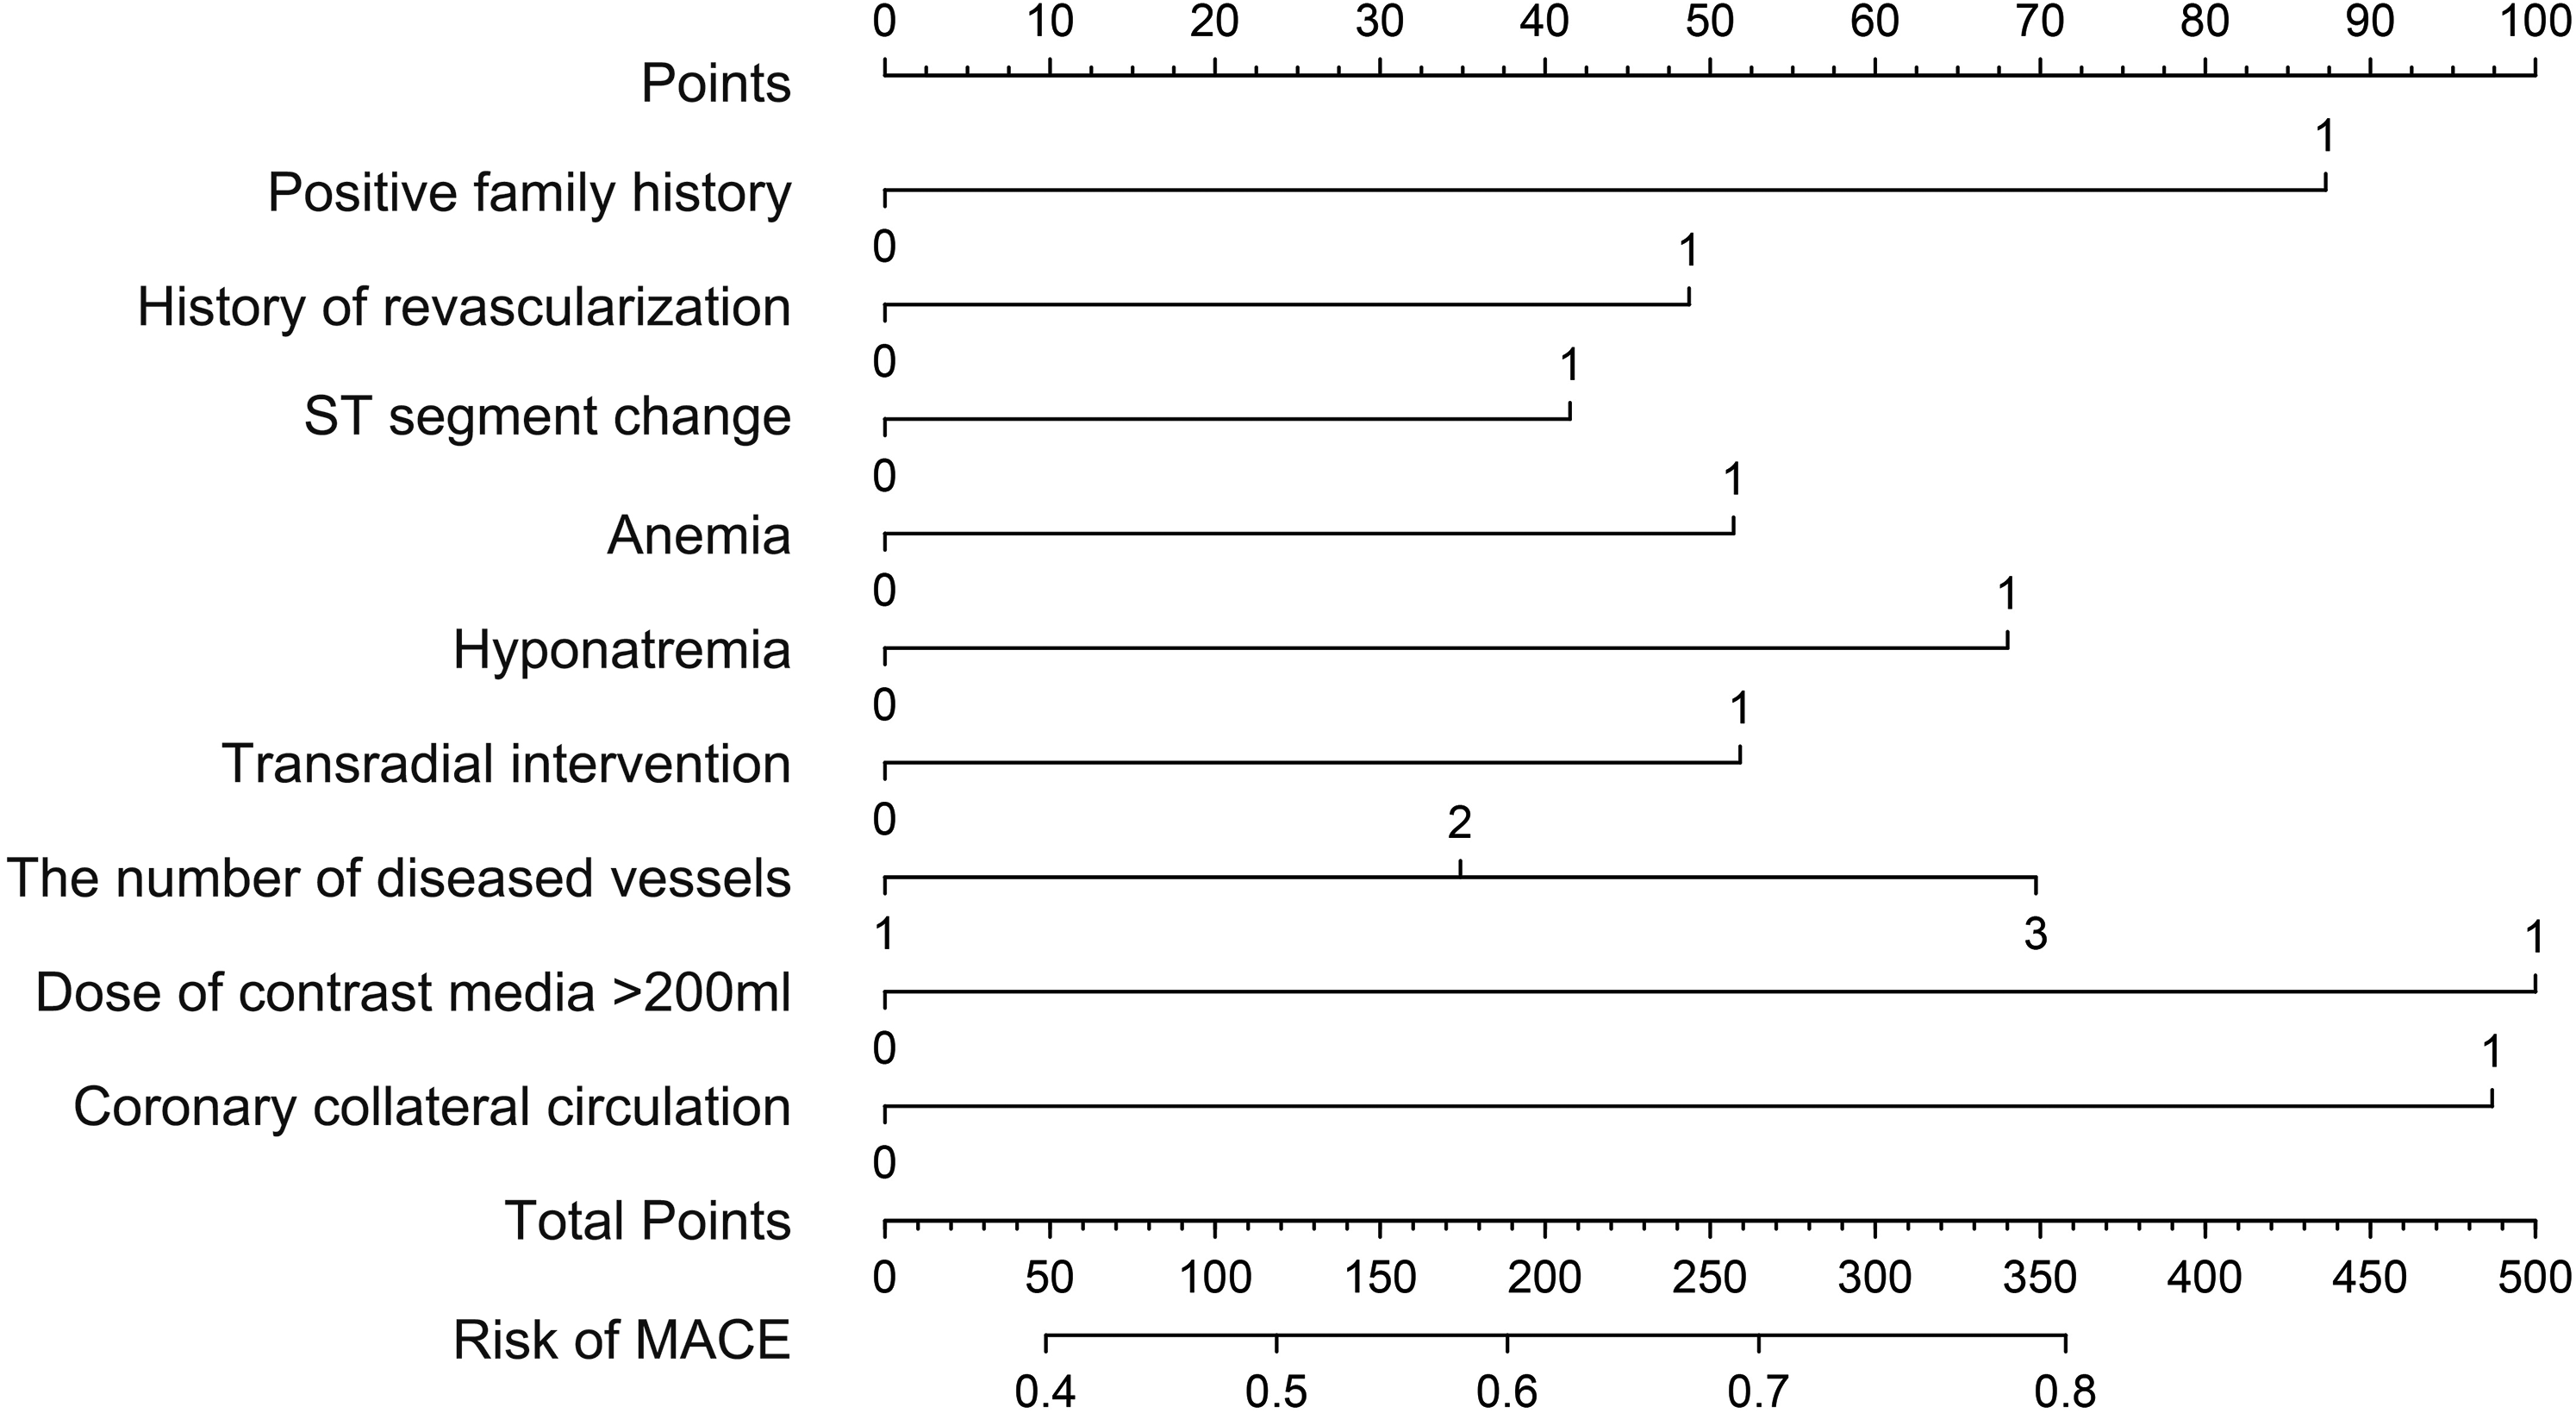
Radiomics nomogram. The nomogram is developed using the development cohort with positive family history of coronary heart disease, history of revascularization, ST segment change, anemia, hyponatremia, transradial intervention, the number of diseased vessels, dose of contrast media >200 ml, and coronary collateral circulation. MACE, major adverse cardiovascular event
Multivariate binary logistic regression of MACEs in the development cohort.
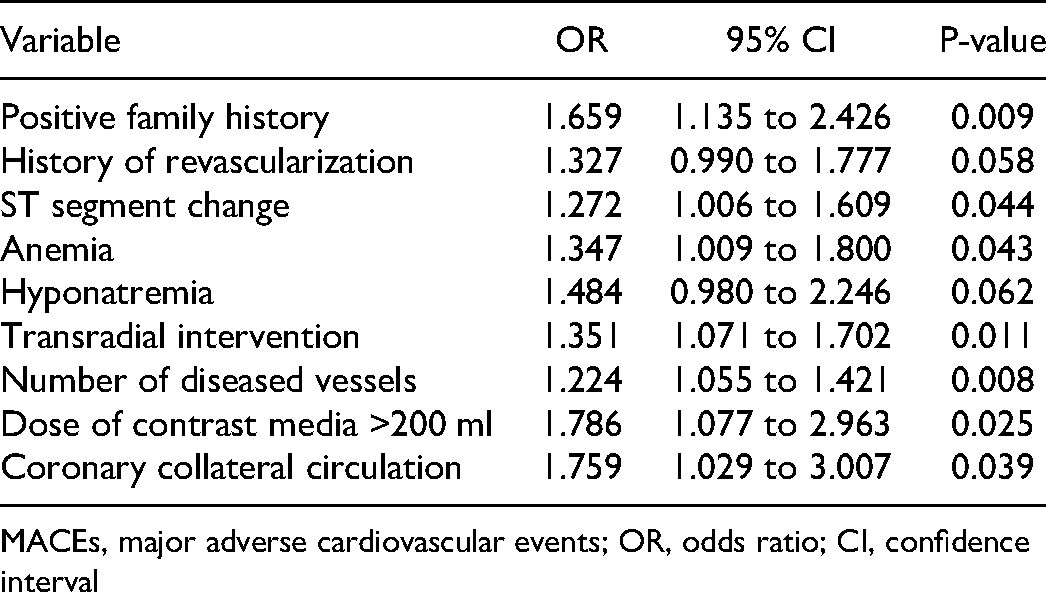
MACEs, major adverse cardiovascular events; OR, odds ratio; CI, confidence interval
The nomogram is used by drawing a line straight upward to the points’ axis at the corresponding points of each prediction factor. All scores in the points’ axis of every prediction factor are summed as total points. Finally, a straight line is drawn downward to the risk of MACEs axis at the point in the total points. For example, a patient with comorbid CKD-CHD has CHD family history, history of revascularization, anemia, triple-vessel disease, and collateral circulation. The scores of these predictors were 87, 46, 51, 70, and 97, respectively. The total score was 351, and the suspected probability of MACEs after PCI was approximately 80%.
AUROCs for the development and validation cohorts were 0.605 (95% confidence interval [CI]: 0.574, 0.636) and 0.612 (95% CI: 0.560, 0.664), respectively. Cut-off values for the risk probability was 0.538 (sensitivity, 52.08%; specificity, 63.65%) (Figure 4).

Areas under the ROC curves. A. Development cohort. B. Validation cohort.
The calibration plot showed the relationship between the predicted probabilities based on the nomogram and the actual values of the validation cohort (Figure 5). A plot along the 45° line would indicate a perfect calibration model in which the predicted probabilities are identical to the actual outcomes. The line connecting the predicted probability value of the verification set is another dotted line. Hosmer-Lemeshow test is the goodness of fit test and the model evaluation standard. It is expressed by the degree of bias between the fitting curve and the perfect calibration model. P > .05 is considered to be a good fit with statistical significance.

Calibration plot shows the relationship between the predicted probabilities based on the nomogram and the actual values of the validation cohort. A plot along the 45° line indicates a perfect calibration model in which the predicted probabilities are identical to the actual outcomes.
The unreliability index U test result of calibration in the validation cohort was −0.004 (P = .963), and the maximum excursion and average excursion were 0.090 and 0.011, respectively (Figure 5). The chi-square statistic according to the Hosmer-Lemeshow test was 9.96 (P = 0.444), suggesting that the model was well calibrated.
The decision curve analysis showed that if the threshold probability range was from 34% to 63%, using the model to predict the incidence rate of MACEs after PCI for patients with comorbid CKD-CHD was superior to either the treat-all-patients or the treat-no-patients models. Within this range (34%–63%), the net benefits were comparable, and the cut-off value (40.36%) was in this range (Figure 6).

Decision curve analysis. The y-axis measures the net benefit. Dotted line, the nomogram; black line, the assumption that all patients have major adverse cardiovascular events (MACEs); thin grey line, the assumption that no patients have MACEs.
Discussion
PCI is the primary treatment for patients with comorbid chronic kidney disease and coronary heart disease, In spite of the poor prognosis. most prospective clinical studies exclude patients with CKD cause the lack of evidence-based medical evidence, therefore exploring the risk predictors after PCI for CKD patients will lead to better treatment outcomes, especially for risk factors associated with MACE. The nomogram is accepted as a reliable tool for predicting the risk of outcomes by illustrating important predictors. We developed and validated a nomogram for the preoperative prediction of MACEs after PCI for CKD patients.
Validation of the prediction model is important to avoid overfitting and determine generalizability. Here, AUROCs for the development and validation cohorts demonstrated certain discrimination . Calibration plots was used to show the optimal agreement between predicted and actual observations. In this study, results showed that the model was well calibrated. Decision curve analysis was use to exploring the clinical usefulness of the nomogram. If the threshold probability range was from 34% to 63%, using the model to predict the incidence rate of MACEs after PCI for patients with comorbid CKD-CHD was superior to either the treat-all-patients or treat-no-patients model. This range also covered the cut-off value of risk probability in this model (40.36%).
This prediction model incorporated nine predictors on the basis of clinical characteristics for predicting MACEs: positive family history, history of revascularization, ST segment change, anemia, hyponatremia, transradial intervention, the number of diseased vessels, dose of contrast media >200 ml, and coronary collateral circulation.
Positive family history is a risk factor for cardiovascular disease (CVD). It is defined as at least one parent with premature CVD before 55 years of age for the father and/or 65 years of age for the mother.8 Numerous studies found that for patients with CVD in addition to risk factors, full consideration of positive family history of CVD is helpful for primary prevention and treatment decision-making in CVD.9 Here, positive family history was also an important predictor.
Regardless of the revascularization technique, the probability of repeat revascularization in CHD-CKD patients remains higher than that of the general population. CKD is also often considered to be a risk factor for repeat revascularization; however, its mechanism is unclear.10 It is believed that CKD may increase the chronic inflammatory response, and multiple vessel lesions and diffuse lesions may lead to incomplete revascularization,11 which is more likely to be combined with hypertension and diabetes12 and increase the probability of repeat revascularization after PCI or coronary artery bypass grafting.13
Electrocardiography is the most common auxiliary examination for clinical evaluation of myocardial ischemia; however, it may produce false negative results. Nevertheless, ST segment depression and ST-T dynamic changes were significantly related to coronary stenosis on the basis of excluding cardiomyopathy.14
Anemia is a common complication of CHD and CKD. Anemia in CKD patients is associated with an increased risk of CVD, morbidity, and mortality.15 After PCI, the prognosis of anemia combined with CKD is worse than either condition individually.16
Electrolyte abnormalities are common complications of CKD. Hyponatremia is among the most common electrolyte disorders, and is associated with outcomes including death, cardiovascular events, and CKD progression.17–19 Hyponatremia is associated with decline of renal function, suggesting that the ability to maintain water homeostasis is decreased.20 It is an independent risk factor for poor prognosis of CKD.21,22 There was no clear correlation between poor prognosis and degree of hyponatremia and CKD,23,24 which is consistent with the present study's findings in that the effect of hyponatremia rather than the level of blood sodium was the predictive factor in this model.
Transradial intervention (TRI) was superior to transfemoral intervention (TFI) in reducing bleeding complications. For CKD patients, there is conflicting evidence as to whether the TRI or TFI is more favorable. In studies that considered the radial artery to be beneficial, most patients tended to benefit from a reduction in bleeding complications; however, this benefit may be offset by renal function levels and follow-up time of the selected population and different prognostic end-points.25,26 Although many retrospective analyses compared the risks and benefits of approaches in CKD patients, most investigators maintain that we should be cautious in choosing TRI for CKD patients.27 It should be noted that TRI and anemia are predictive factors in this model. We believe that the presence of anemia as a predictive factor also balances the benefits of TRI in reducing bleeding complications compared with those of TFI. We emphasize the overall prediction ability of the model after incorporating these predictors.
The severity and prognosis of CHD are related to the number of vascular lesions.28 This trend is more obvious in CKD patients, because they are more likely to also have atherosclerosis risk factors.29 CKD patients have chronic inflammation and lipid abnormality, high-density lipoprotein deficiency, and high oxidation rate of low-density lipoprotein,30–32 which causes CHD-CKD patients to be more likely to have multivessel disease, calcification lesions, and complex coronary artery lesions.
Poor prognosis in CKD patients after PCI is associated with the use of high volumes of contrast media and contrast-induced acute kidney injury (CI-AKI).30 Our study counted the occurrence of CI-AKI and the volume of contrast media; however, the volume of contrast media >200 ml rather than the occurrence of CI-AKI was ultimately entered into the model. CI-AKI is related to pre-existing CKD, cardiogenic shock, diabetes, advanced age, baseline anemia, and nephrotoxic drugs. Therefore, the volume of contrast media may be more sensitive than CI-AKI.33–36
Coronary collateral circulation (CCC) is another source of blood supply for ischemic myocardium. Animal models showed that CCC has substantial protective effects on the myocardium; however, for humans, the effect on long-term prognosis remains controversial.37 Some studies found that abundant CCC plays an important role in acute myocardial injury, but this finding did not reach statistical significance in revascularization.37–39 CCC is an important compensatory mechanism of myocardial ischemia, closely related to the degree of coronary stenosis. Less than 90% stenosis is rarely accompanied by the generation of CCC. Therefore, in the study of long-term prognosis of PCI patients, abundant CCC suggests that more serious coronary artery disease may mask mortality benefit. Its negative effect on long-term prognosis is self-evident.
In the prediction model, each prediction factor is not necessarily a risk factor. Physicians should pay attention to the overall predictive effect of the model and the discrimination and calibration of the model to achieve a net benefit for individual patients. According to the results, if this prediction model is used in clinical prediction, and the predicted probability of MACE is 34%∼ 63%, which is reasonable to choose whether to perform PCI according to the prognostic outcome model.
Limitation
This study has several limitations. First, our data comes from a single center, and there may be selection bias. Second, The study population was selected over a 10-year period, during which both coronary artery interventional therapy methods and interventional therapy devices such as stents were constantly developing and improving, which may cause certain data bias. third, this study need further prospective multicenter studies should be performed to externally validate our nomogram.
Conclusions
This is the first model to predict the prognosis after PCI for CKD patients. In the clinical setting, it is convenient to use a nomogram to predict individual risk.
Author's Note
This study was approved by the Ethics Committee of Beijing Anzhen Hospital. The requirement for informed consent was obtained for this study.
Footnotes
Declaration of Conflicting Interests
The authors declared no potential conflicts of interest with respect to the research, authorship, and/or publication of this article.
Funding
The authors disclosed receipt of the following financial support for the research, authorship, and/or publication of this article: This work was supported by the National Key Research and Development Program of China (grant number 2017YFC0908800, SML20180601, DFL20150601).