
Abstract
Objective
To establish a predictive model for poor prognosis after incomplete revascularization (ICR) in patients with multivessel coronary artery disease (MVD).
Methods
Clinical data of 757 patients with MVD and ICR after percutaneous coronary intervention (PCI) in the Affiliated Hospital of Chengde Medical University from January 2020 to August 2021 were retrospectively collected. The least absolute shrinkage and selection operator regression method was used to screen variables, and multivariate logistic regression was used to establish a predictive model. An independent cohort was used to validate the model. The C-statistic was used to verify and evaluate the discriminative ability of the model; the calibration curve was drawn, and the decision curve analysis (DCA) was performed to evaluate the calibration degree, the clinical net benefit, and the practicability of the model.
Results
The predictive factors included female, age, unconjugated bilirubin, uric acid, low-density lipoprotein, hyperglycemia, total occlusion, and severe tortuosity lesion on coronary angiography. The C-statistic of the training and validation sets were 0.628 and 0.745, respectively. The statistical value of the Hosmer–Lemeshow test for the calibration curve of the training and validation sets were 5.27(P = 0.873) and 6.27 (P = 0.792), respectively. DCA showed that the model was clinically applicable when the predicted probability value of major adverse cardiovascular events(MACEs) ranged from 0.07 to 0.68.
Conclusions
We established a predictive model for poor prognosis after ICR in patients with MVD. The predictive and calibration ability and the clinical net benefit of the predictive model were good, indicating that it can be used as an effective tool for the early prediction of poor prognosis after ICR in patients with MVD.
Keywords
Introduction
A major public health issue is coronary heart disease (CHD), one of the leading causes of mortality in the globe. 1 In the treatment of CHD, medical treatment or percutaneous coronary intervention (PCI) has been controversial. Teoh Z et al's research on ISCHEMIA and ORBITA has concluded that medical treatment is superior to PCI in stable angina. 2 Nevertheless, in patients with functionally significant stenoses, PCI and the medical therapy decreased the need for urgent revascularization. 3 The role and status of interventional therapy in CHD treatment have been widely recognized. However, PCI in patients with multivessel coronary artery disease (MVD) remains a concern for interventional surgeons.4,5 Previous evidence-based studies have suggested that the incidence of long-term adverse cardiovascular events has significantly increased with incomplete revascularization (ICR) compared with complete revascularization (CR). Some patients have poor satisfaction and prognosis due to poor symptom improvement or limited benefits after PCI.6–9 MVD, especially in patients with heart failure, diabetes mellitus, or cerebral infarction, is an indication of coronary artery bypass grafting. 10 However, with the progress in interventional technology, more clinical studies support the choice of PCI for patients with MVD, as it has the advantages of less trauma, shorter recovery time, and low cost. 11 Most patients with complex vascular diseases still prefer PCI. 12 Compared with coronary artery bypass grafting (CABG), the mortality was similar but patients treated with PCI had higher rates of repeat revascularisation. 13 However, most existing studies lack individualized evaluation methods for each individual patient. Therefore, this study intends to establish a predictive model for poor prognosis in patients with MVD after ICR to comprehensively and objectively analyze the risk factors of poor prognosis in patients with MVD after ICR.
Materials and Methods
Patient Selection
Patients admitted to the Affiliated Hospital of Chengde Medical University between January 2020 and August 2021 who underwent coronary angiography were selected. If the patient has three-vessel disease or left main artery disease or heart failure, CABG is recommended as the first choice, and the revascularization method determined by the patient's will. In patients undergoing PCI, if the clinical data, such as the dynamic changes of ST-T in ECG, can determine the responsible ischemic vessels, interventional therapy should be performed on those vessels; otherwise, interventional therapy should be performed on the lesions with diameter >2.25mm and stenosis >70%. A total of 757 patients who met the inclusion criteria were selected for this study. According to the order of discharge time, patients were divided into training (80%; n = 606) and validation (20%; n = 151) sets. The inclusion criteria were as follows: (1) patients with MVD and ICR undergoing PCI and (2) patients who were followed up for one year. the exclusion criteria were as follows: (1) patients with immune and hematopoietic system disorders; (2) patients with severe liver, kidney, lung, and other organ lesions or those with MVD complicated by malignant tumors; (3) patients with connective tissue disease and coronary vasculitis; and (4) patients with aortic dissection, hypertrophic cardiomyopathy with acute coronary syndrome. A flow diagram of the selection process is shown in Figure 1.
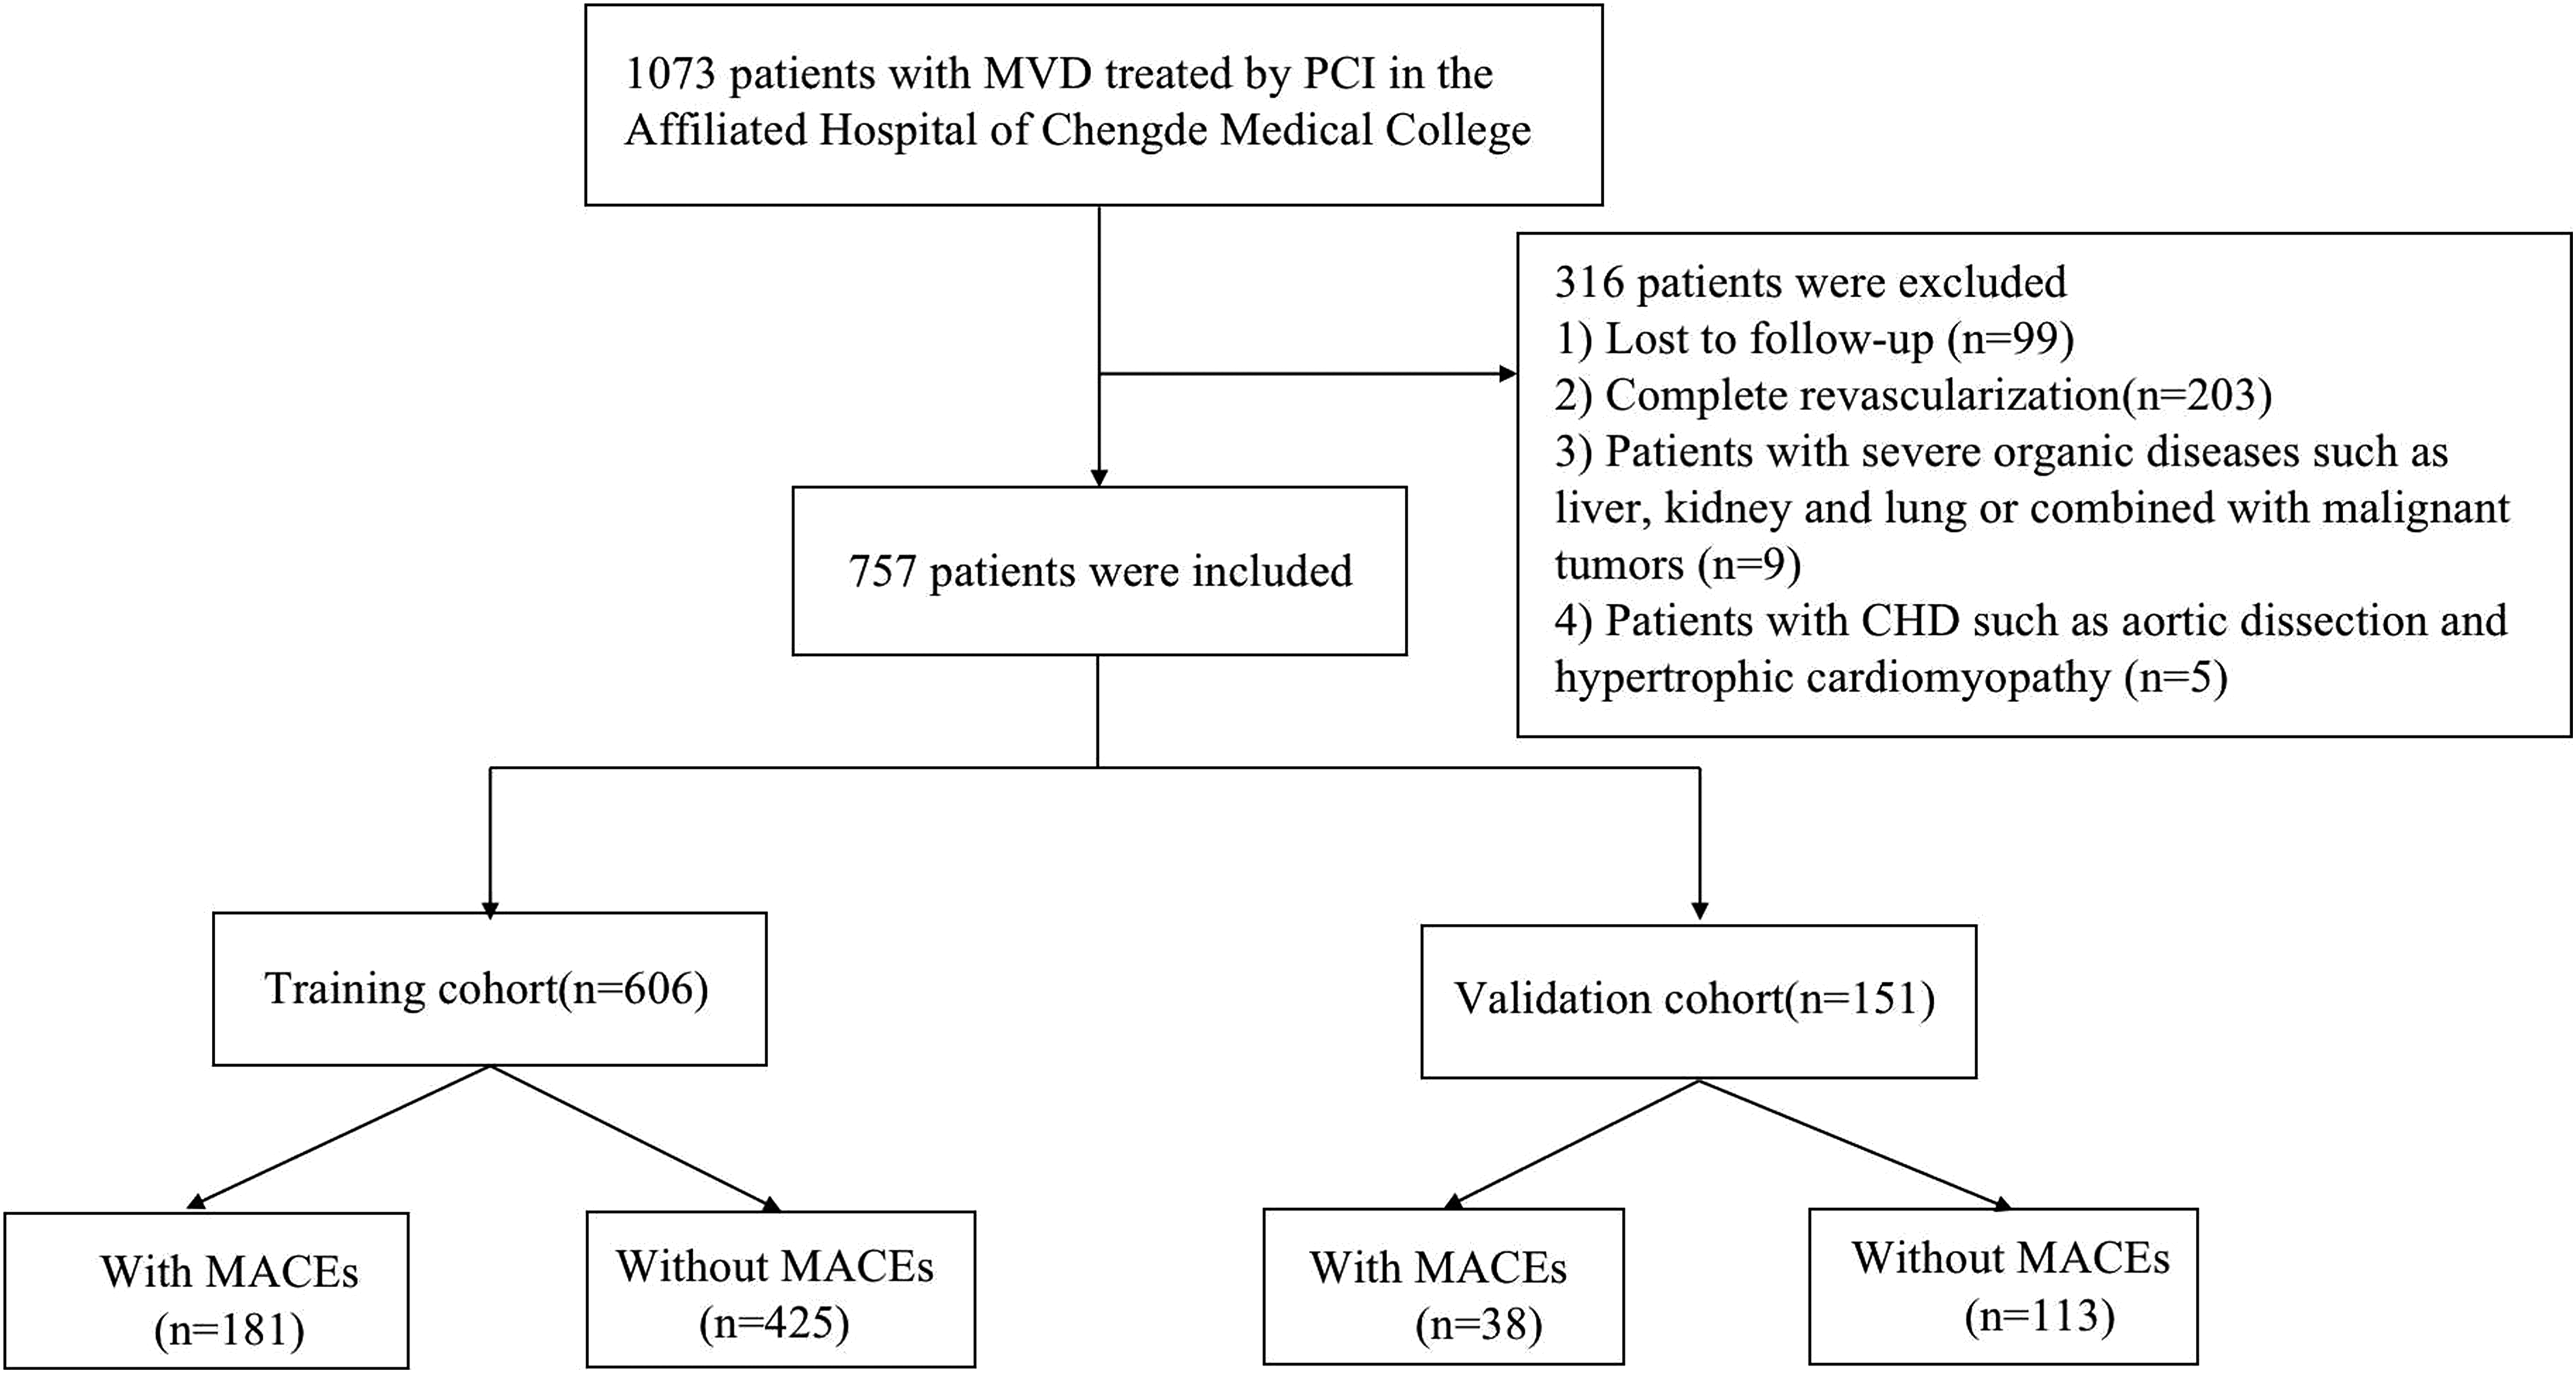
Flow diagram showing the patient selection process.MVD, multivessel disease; MACEs, Major adverse cardiovascular events; PCI, percutaneous coronary intervention.
Clinical Data Collection
General data, including age, sex, height, weight, body mass index (BMI), systolic blood pressure(SBP), diastolic blood pressure(DBP), heart rate(HR) on admission, clinical diagnosis, history of smoking, dyslipidemia, dysglycemia, diabetes, cerebral infarction, and hypertension, were collected. Data on laboratory test indicators, including absolute lymphocyte, platelet, white blood cell, and absolute monocyte counts, hematocrit, total cholesterol (TC), coefficient of variation of red blood cell distribution width, low-density lipoprotein cholesterol (LDL), absolute neutrophil count, urea nitrogen, serum creatinine, uric acid, high-density lipoprotein cholesterol (HDL), creatine kinase isoenzyme, unconjugated bilirubin (UCB), and serum potassium, triglyceride, and fasting blood glucose (FBG) were also obtained. Data on the characteristics of coronary artery disease and interventional treatment, including total occlusion (TO), blunt stump, chronic total occlusion (CTO), severe tortuosity, collateral circulation formation, thrombus, small vessel lesions, diffuse lesions, vascular calcification, bifurcation lesions, aorto-ostial stenosis, puncture approach, stent length, and number of stents, were also collected. Derived indicators included the residual SYNTAX score (rSS), baseline SYNTAX score (bSS), 14 and the ratio of neutrophils ( × 109/L) to the absolute lymphocyte count ( × 109/L) (NLR). Medication received, including dual antiplatelet therapy (DAPT) and the type of dual antiplatelet medication. Postoperative complication, including acute renal injury (AKI), subcutaneous haematoma, gastrointestinal bleeding (GIB) and cerebral hemorrhage.
Statistical Methods
The Stata15.0, SPSS26.0, and rms package of RStudio(3.5) statistical software were used to examine all of the data. Normally distributed quantitative data are presented as mean ± standard deviation, and the using student's t-test to compare the normal distribution data between groups.`Non-normally distributed data are expressed as median and interquartile range, and using the Mann–Whitney U test to compare between groups. The chi-square or Fisher's exact test was used to compare count data between groups and express them as percentages.
There were 181 patients with MACEs in the training set, according to the 1:10 EPV principle, the study variables should not exceed 18. The variables in this study were 44 which is not comply with the 1:10 EPV principle, so the least absolute shrinkage and selection operator (LASSO) regression method was used for variable screening to ensure the robustness of this model. Increasing the number of independent variables or lowering lambda did not appreciably enhance the model's performance after the penalty coefficient (lambda) reached a certain magnitude. A model with high performance and minimum independent variables uses “lambda.1se” (minimum lambda double labeling error) and 10-fold cross-validation. The independent variables screened above were used to create a binary logistic regression, and the the area under the receiver operating characteristics curve (AUROC), which is equal to the C-statistic in logical regression analysis was obtained.
The performance of the model was evaluated using data from independent validation sets. The model's diagnostic performance in the training and validation sets were measured using the C-statistic. The calibration of model was assessed using the calibration plots. A method used to evaluate the net benefit and determine its clinical applicability in the validation set is decision curve analysis (DCA). The selected independent variables were considered predictors, and the predictors screened in the training set were used to establish a logistic regression equation that was used to calculate the predicted probability value of MACEs in all individuals in the validation set. The diagonal indicates that the model has no discriminative power when the C-statistic is equal to 0.5; the closer the C-statistic is near 1, the greater the model's discriminative capacity is. The calibration plots closer the 45° slant line of all the predicted probability values is to the zero crossing, the better the fit, which proves that the model has a certain predictive ability. The unreliability and Hosmer–Lemeshow tests were performed at the same time, and the calibration ability was proved by P > 0.05. The DCA was obtained by calculating the net benefit for each predicted probability value, and a valid range of predicted probability values was calculated, within which there was a clinical net benefit from using the model.
Finally, the model was visualized to provide a nomogram. All predictors in the model were visualized using line segments, and a score was assigned according to different weights. The total score of all predictors was calculated, and the corresponding risk probability value was obtained in the nomogram.
Results
Comparison of Clinical Data
The proportion of TO (36.5% vs 27.8%, P = 0.03) was higher in the MACEs group than in the non-MACE group, and the difference was statistically significant. UCB [8.18 (5.20,11.94) versus 9.39 (6.82,12.76), P = 0.03] and age [58 (53,65) versus 61 (54,67), P = 0.02] were significantly lower in the MACEs group than in the non-MACE group, and the differences were statistically significant (Table 1).
Univariate Logistic Regression Analysis of the Training and Validation Sets.
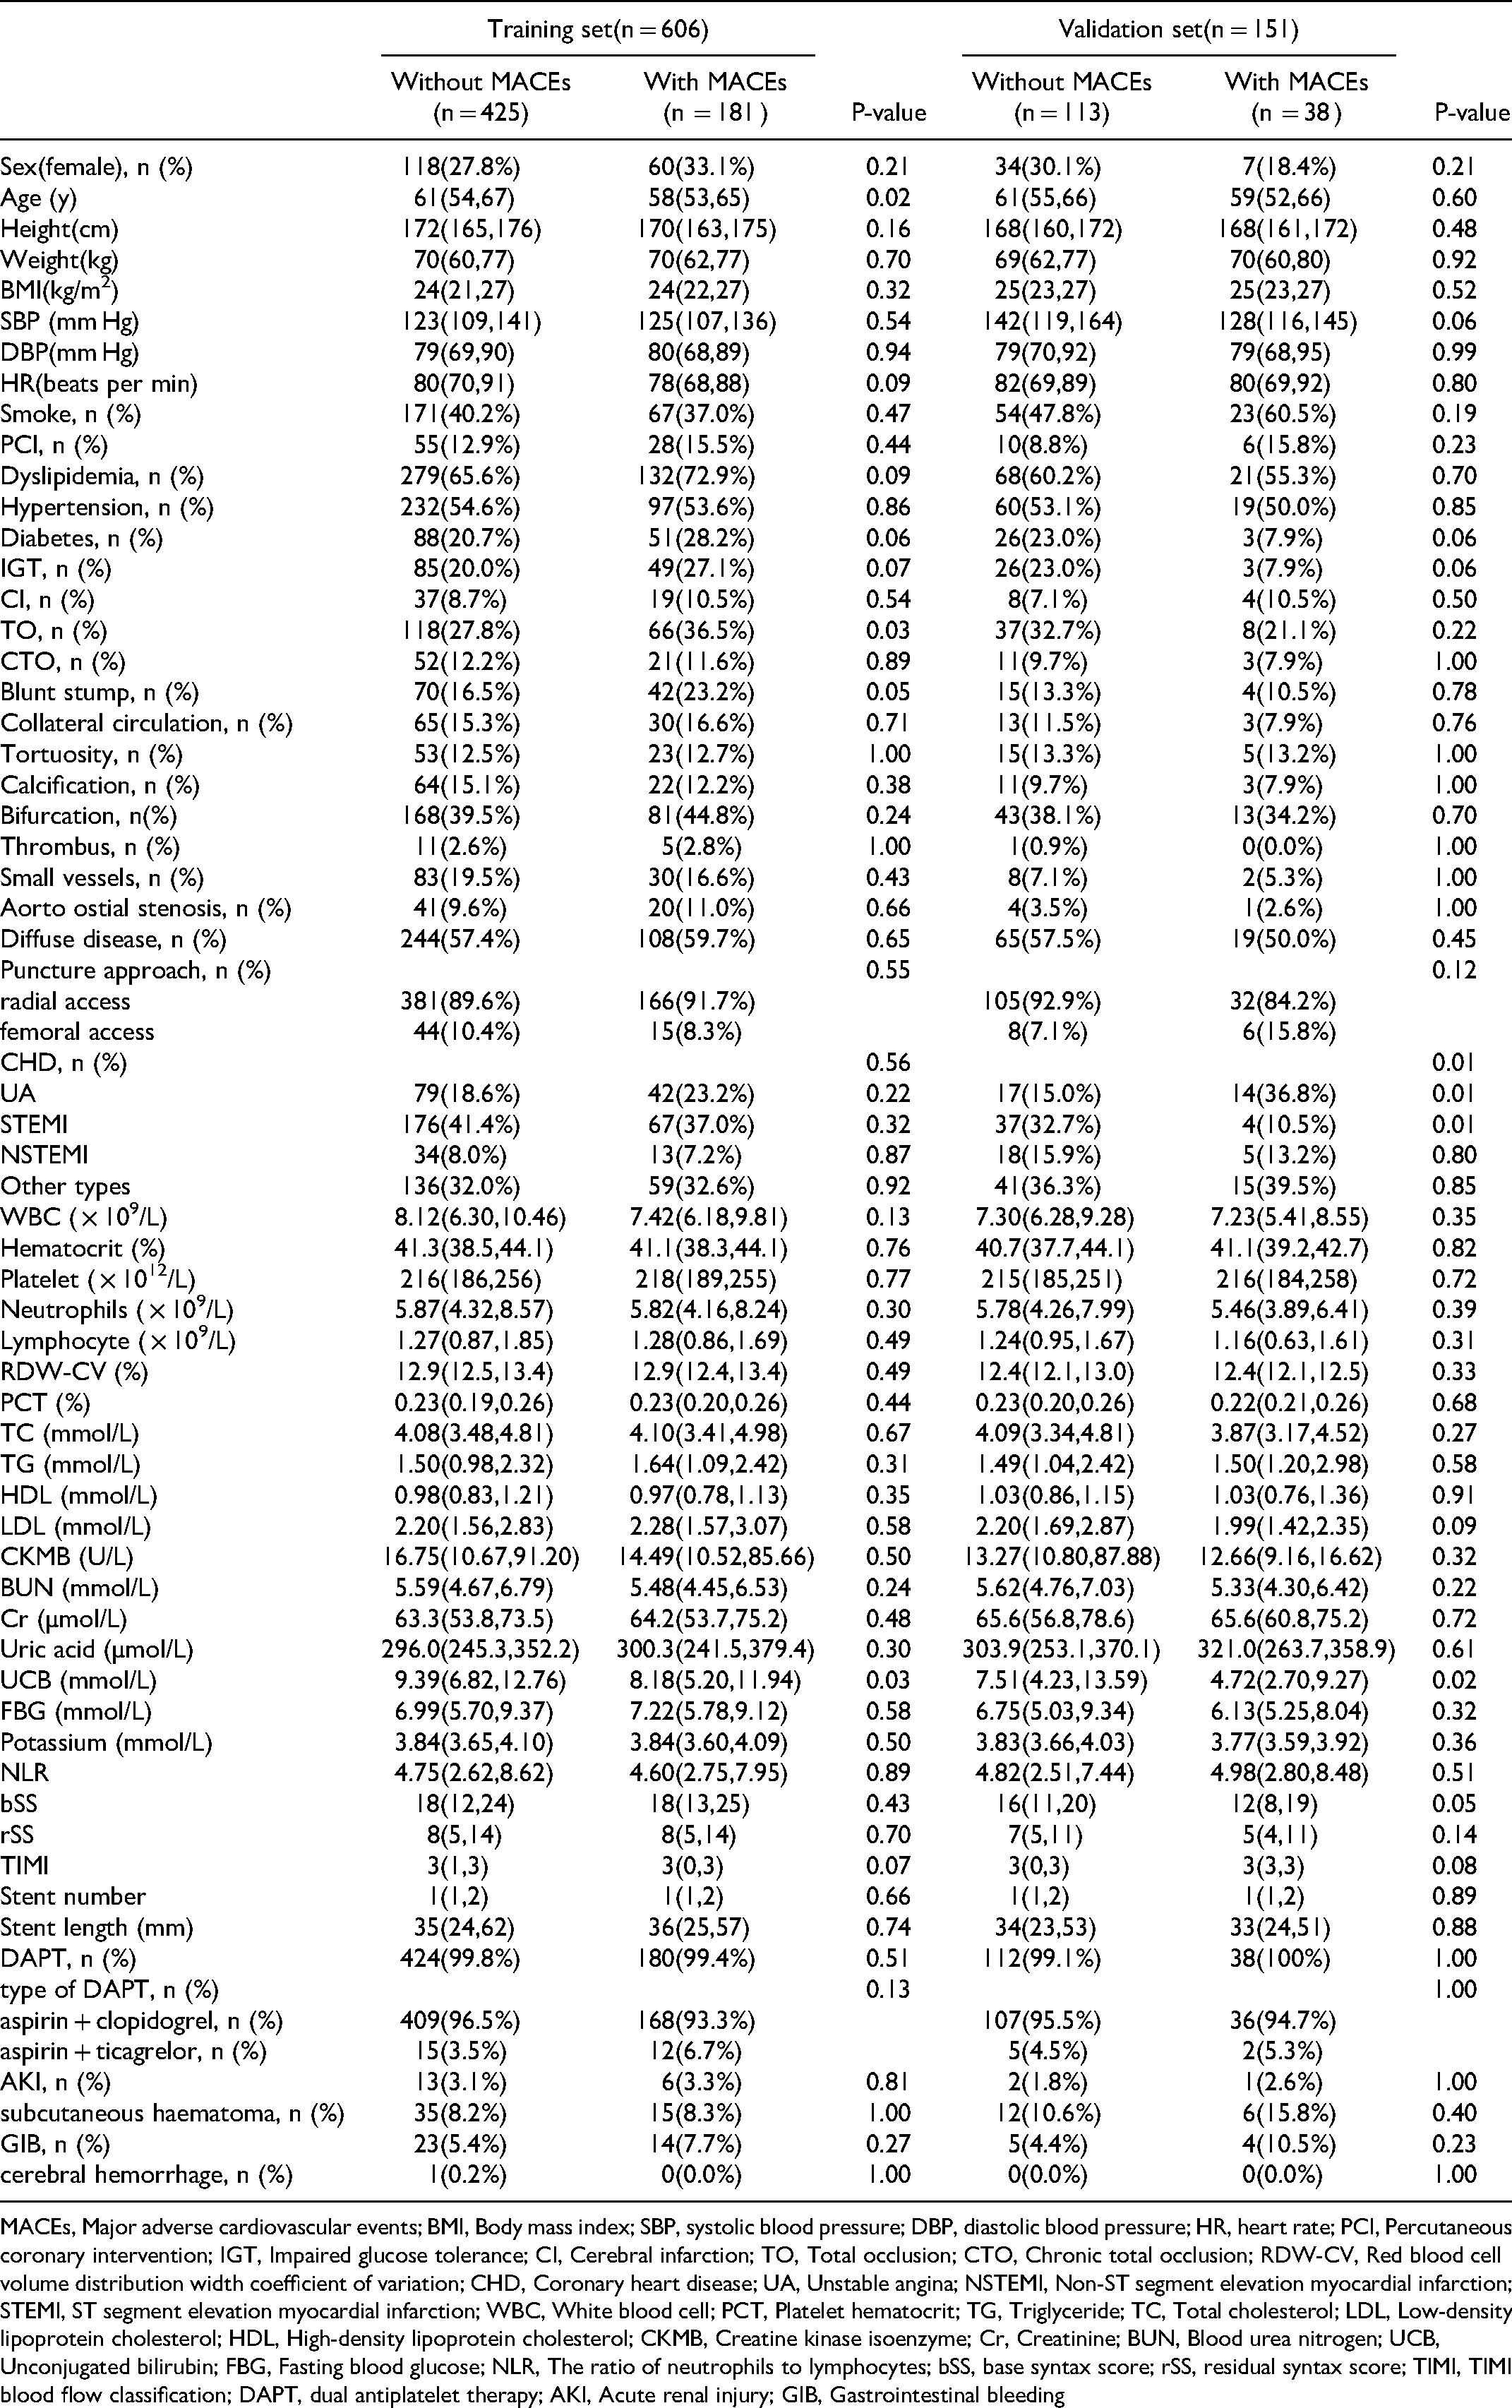
MACEs, Major adverse cardiovascular events; BMI, Body mass index; SBP, systolic blood pressure; DBP, diastolic blood pressure; HR, heart rate; PCI, Percutaneous coronary intervention; IGT, Impaired glucose tolerance; CI, Cerebral infarction; TO, Total occlusion; CTO, Chronic total occlusion; RDW-CV, Red blood cell volume distribution width coefficient of variation; CHD, Coronary heart disease; UA, Unstable angina; NSTEMI, Non-ST segment elevation myocardial infarction; STEMI, ST segment elevation myocardial infarction; WBC, White blood cell; PCT, Platelet hematocrit; TG, Triglyceride; TC, Total cholesterol; LDL, Low-density lipoprotein cholesterol; HDL, High-density lipoprotein cholesterol; CKMB, Creatine kinase isoenzyme; Cr, Creatinine; BUN, Blood urea nitrogen; UCB, Unconjugated bilirubin; FBG, Fasting blood glucose; NLR, The ratio of neutrophils to lymphocytes; bSS, base syntax score; rSS, residual syntax score; TIMI, TIMI blood flow classification; DAPT, dual antiplatelet therapy; AKI, Acute renal injury; GIB, Gastrointestinal bleeding
All variables were included in the LASSO regression to find valuable predictors to establish the regression model. The values for lambda.min and lambda.1se were 0.02136 and 0.05320, respectively. Predictor variables were those that were not compressed to 0 at lambda.1se. (Figure 2), including female, age, UCB, Uric acid, LDL, hyperglycemia, TO, and severe tortuosity lesions on coronary angiography.

Texture feature selection using binary logistic regression model with least absolute shrinkage and selection operator (LASSO). A. The LASSO model uses 10-fold cross-validation with minimal criteria to choose the tuning parameter (λ). The minimal criterion and one standard error of the minimum criteria(the 1-SE criteria) are used to create dotted vertical lines at the optimal values. B. A coefficient profile plot is produced against the log (λ) sequence. The selected value is marked with a vertical line using 10-fold cross-validation.
Logistic regression was performed using these variables, and the predictive model is shown in Table 2. The nomogram of this model can be used to predict MACEs after ICR in patients with MVD (Figure 3). Specifically, the score of each predictor can be obtained by drawing a line vertically upward to the “score” line at the corresponding point of each predictor. Add the scores for each predictor up to a total score, and the predicted probability value of the risk of MACEs can be obtained by drawing a straight line vertically down the point of the total score to the “Risk of MACEs” axis. For example, male and female were scored 0 and 4 respectively, the age of 25–85 were scored from 11 to 0, LDL, UCB and other predictive factors all correspond to different scores. The total score was obtained by summation of the corresponding scores, thus obtaining the risk of MACEs after ICR by drawing a straight line vertically down the point of the total score to the “Risk of MACEs” axis.
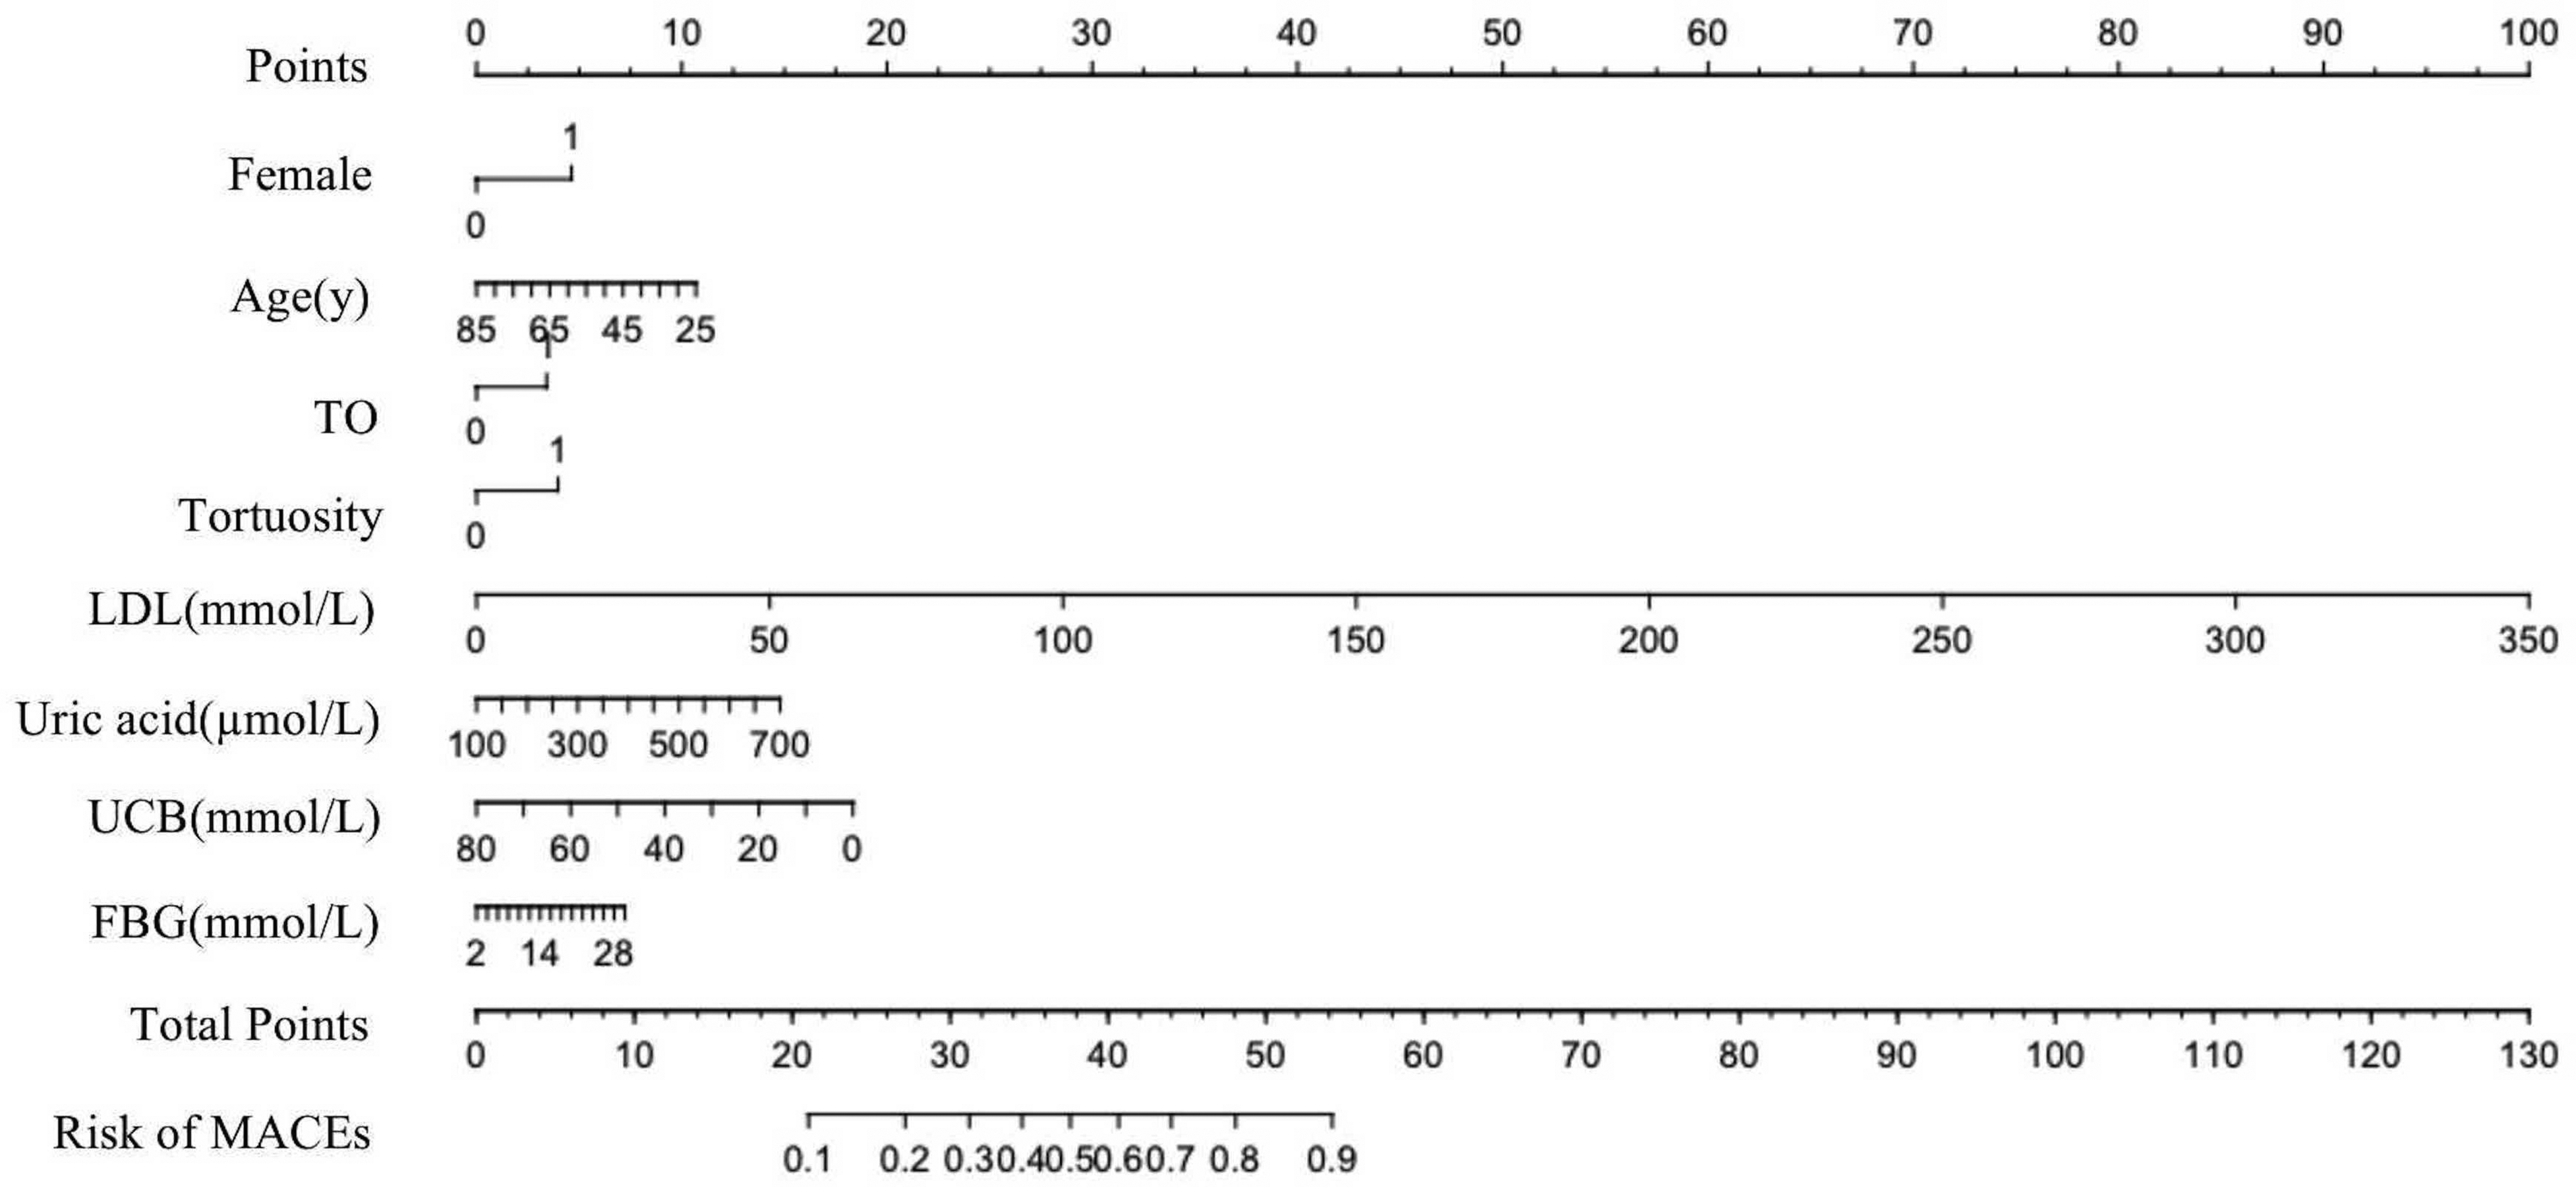
Nomogram. This nomogram was developed using the training set with female, age, UCB, uric acid, LDL, hyperglycemia, TO and tortuosity lesions on coronary angiography as predictors. TO, Total occlusion; LDL, Low-density lipoprotein cholesterol; UCB, Unconjugated bilirubin; FBG, Fasting blood glucose.
Composition of MACEs in the Development and Validation Sets.

TO, Total occlusion; LDL, Low-density lipoprotein cholesterol; UCB, Unconjugated bilirubin; FBG, Fasting blood glucose
In the training set, the C-statistic of the predictive model for MACEs within one year after PCI in patients with ICR was 0.628 (95% confidence interval (CI) = 0.551–0.684) (Figure 4A); that in the validation set was 0.745 (95%CI = 0.630-0.860) (Figure 4B).

The area under the receiver operating characteristic (AUROC) curves. A. Development cohort. B. Validation cohort.
The calibration curve evaluates the agreement between the actual and predicted values of a predictive model. The cross-origin curve with a slope of 45° in the figure is an ideal curve that represents a model with perfect predictive ability. The closer the actual curve is to the ideal curve, the better the consistency between the actual and predicted values of the modelis, that is, the better the calibration ability of the model is.
The unreliability index U test result of calibration in the training set and validation set were −0.005 (P = 0.999), and −0.022 (P = 0.993), respectively (Figure 5). And the maximum excursion and average excursion in training set were 0.167 and 0.020 (Figure 5A), and the validation set were 0.080 and 0.034 (Figure 5B). The chi-square statistic according to the Hosmer–Lemeshow test of the training set was 5.27(P = 0.873) and the validation set was 6.27 (P = 0.792), indicating that the model had good calibration ability.
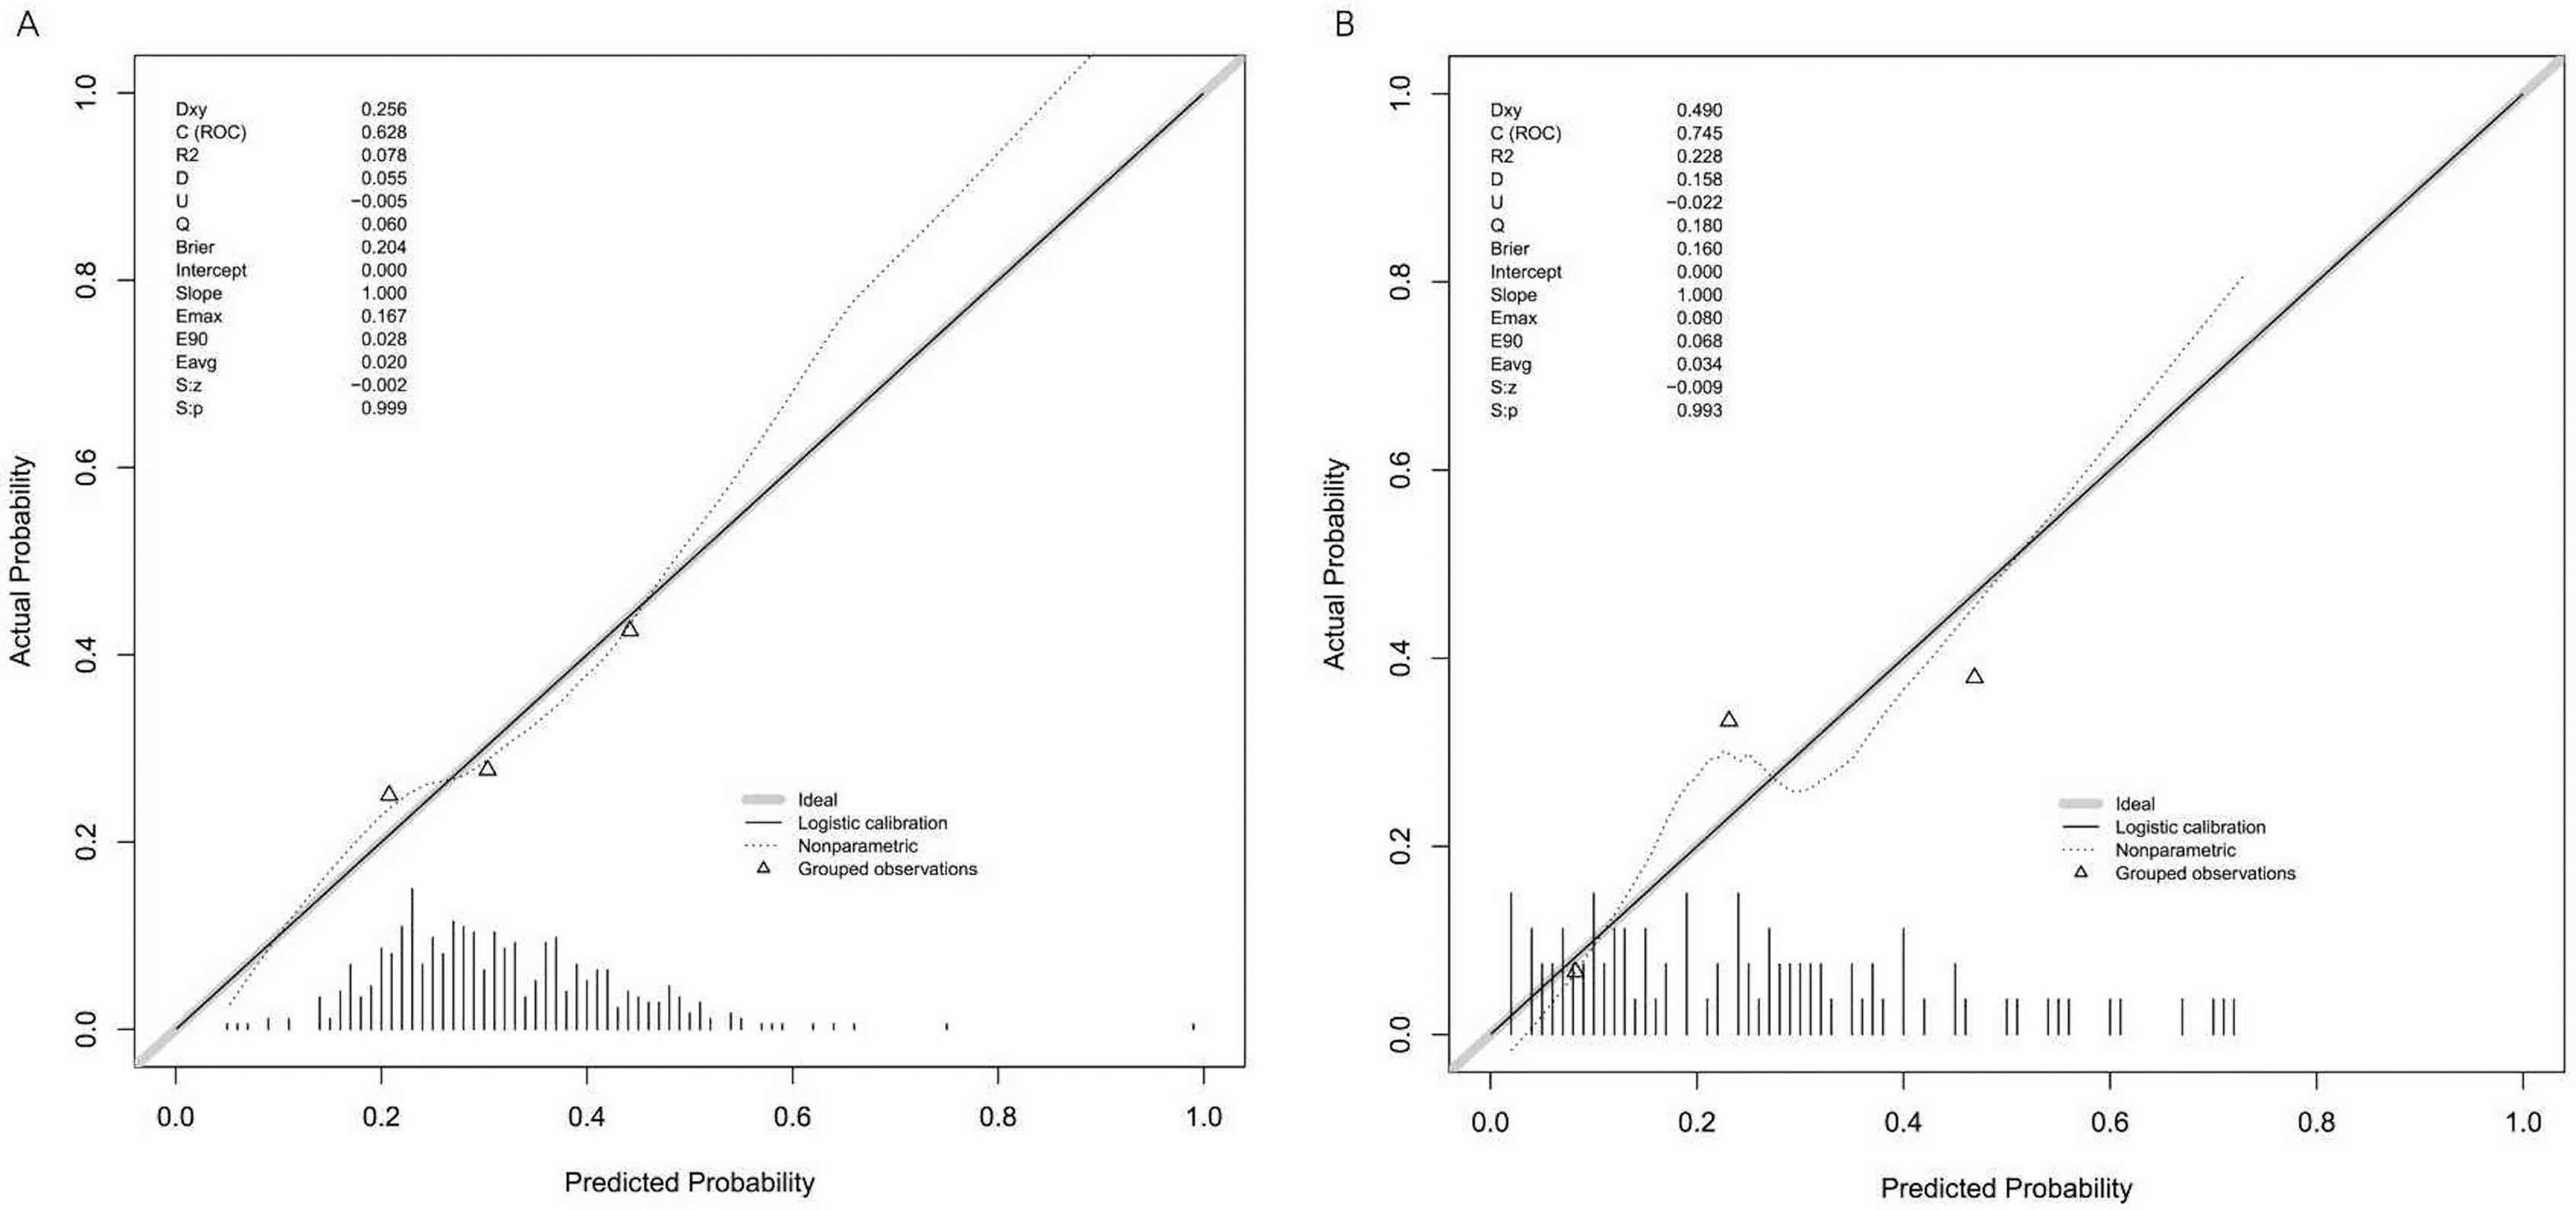
Illustration of the link between the actual values and the predicted probability based on the nomogram in the calibration plot. A perfect calibration model shows a plot at the 45°line where the expected probability match the outcomes exactly. A. Training set. B. Validation set.
DCA was performed to evaluate the clinical practicability of the predictive model, where the x-axis measures the threshold probability and the y-axis measures the net benefit. The horizontal axis represents that all samples are negative (Treat None) and have zero net benifit, the oblique line represents that all samples are positive (Treat All), and the range formed between the DCA curve and the horizontal and oblique line indicates the clinical net benefit interval. This suggests that there is a clinical net benefit with the use of the model when the predicted probability value is between 0.07 and 0.68 (Figure 6).
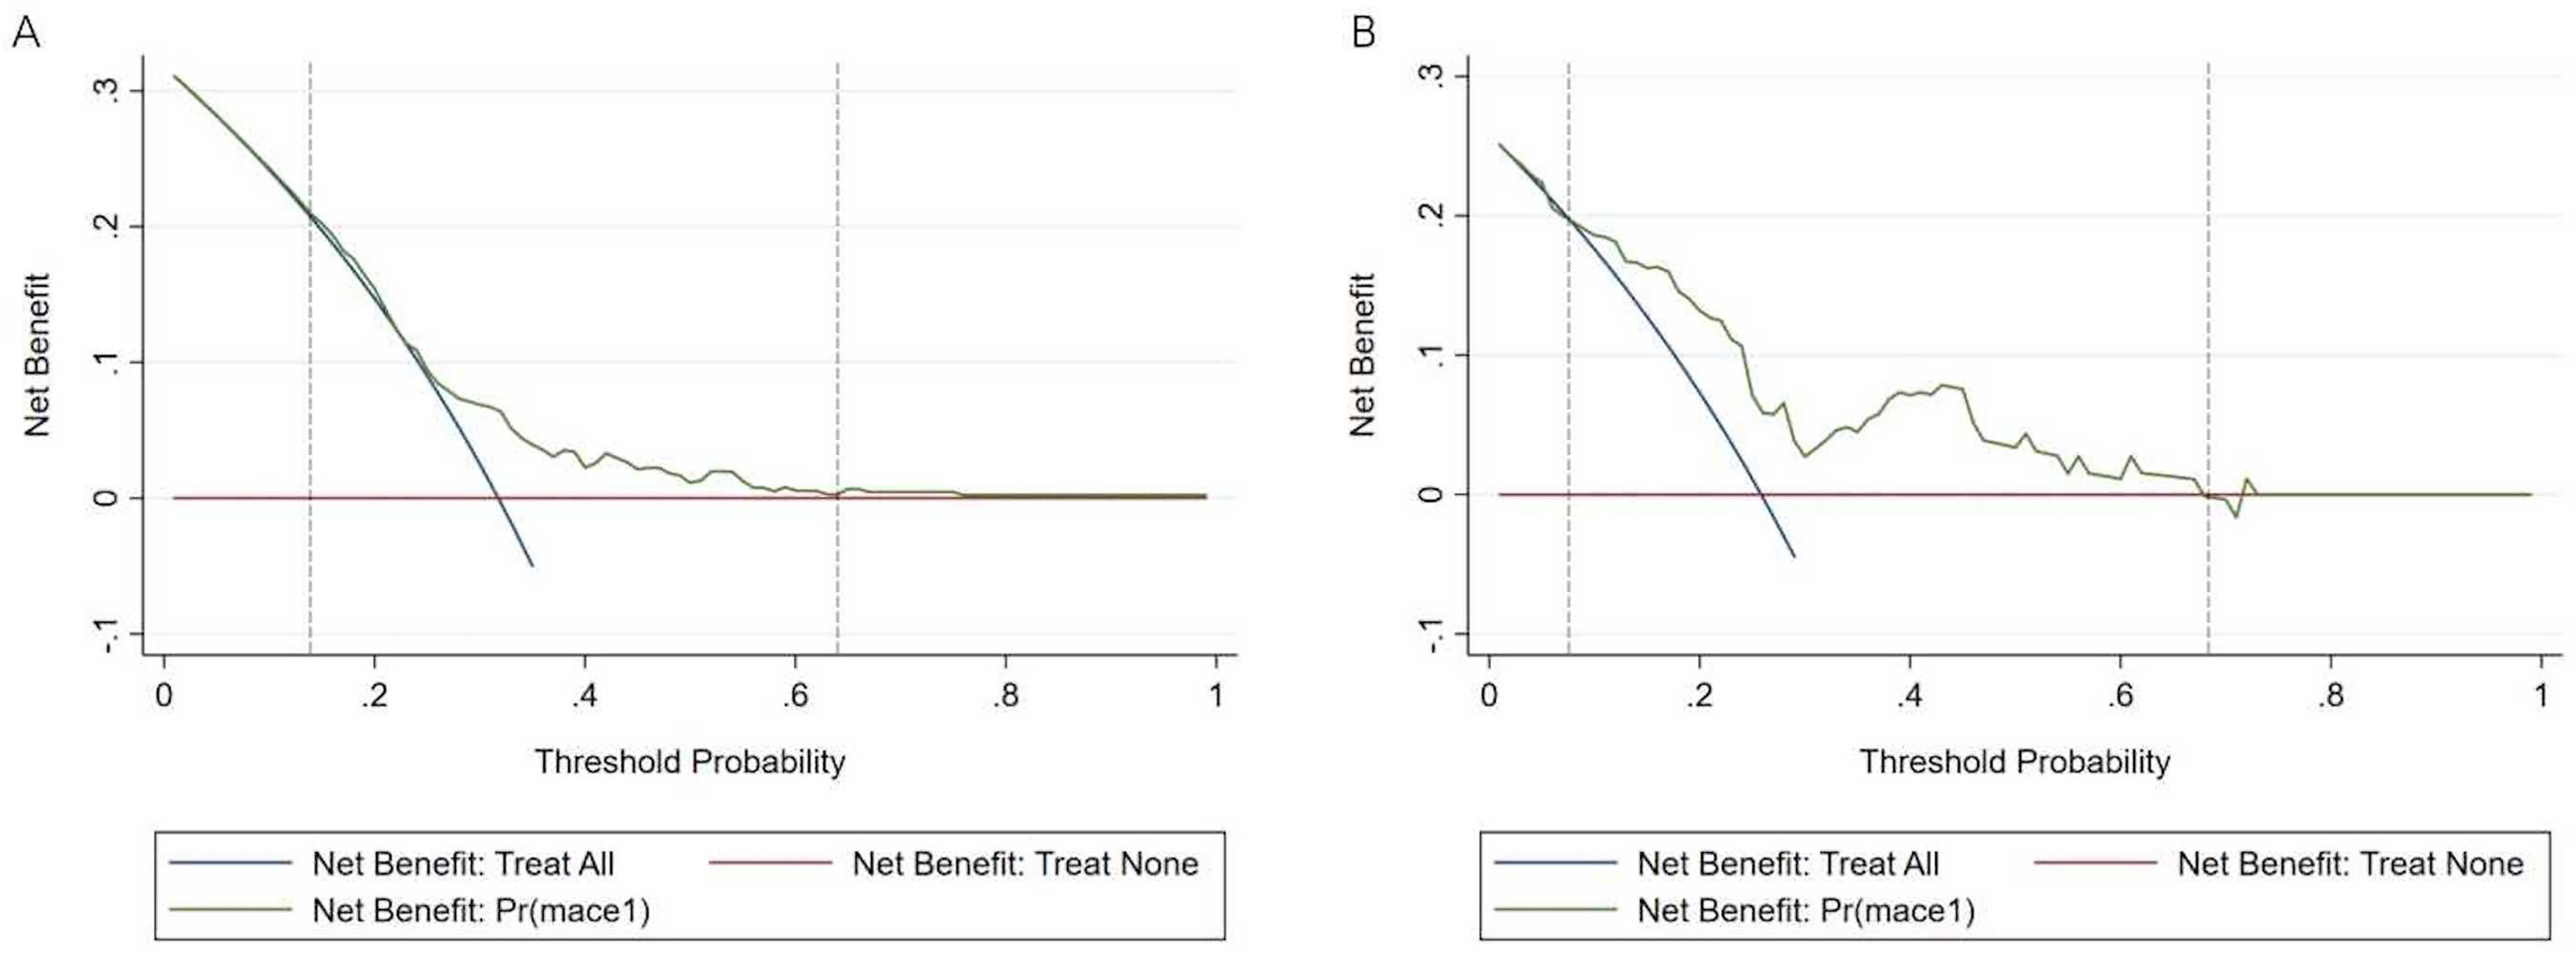
Decision curve analysis (DCA) curves. The nomogram is represented by the dot. A. Training set. B. Validation set.
Discussion
CHD poses an increasingly enormous threat to the health of Chinese people, and it is imperative to strengthen the prevention and treatment of CHD. The development and widespread use of PCI in clinical practice have improved the prognosis of patients with CHD. However, ICR can lead to poor prognosis. At present, most of the studies on ICR in patients with CHD focus on the analysis of independent risk factors. However, the predictive model is more intuitive and vivid than the traditional prediction method. Patients often have multiple independent risk/protective factors simultaneously, a nomogram integrates the interactions among different factors and is more holistic. A nomogram can visualize the model and obtain the prediction results more conveniently and intuitively. In this study, an effective predictive model was constructed for poor ICR prognosis in patients with MVD to guide the individualized treatment of ICR in patients with CHD.
Eight independent risk factors were identified: female, age, UCB, Uric acid, LDL, hyperglycemia, TO, and severe tortuosity lesions on coronary angiography. A predictive model was developed and validated using these eight independent variables to calculate the probability of poor prognosis in patients with MVD after ICR.
We found that the incidence of MACEs was higher in women with MVD who underwent ICR than in men, which is consistent with the findings of Guo et al 15 and Stehli et al. 16 Perhaps the atypical symptom of chest pain in women prolongs the interval from the onset of symptoms to the first medical contact, which leads to the poor prognosis in female patients. The predictive model constructed in this study included female as a predictor of poor prognosis, confirming the above conclusion. Simultaneously more emphasis was placed on the integral performance of the model, namely, the interaction among predictors. For example, age was an independent risk factor for CHD in a previous study. However, we did not come to the same conclusion because young people are more active than older people, and their myocardia consume more oxygen; therefore, they are more prone to experiencing chest pain induced by myocardial ischemia after ICR. This finding also suggests that revascularization should be completed as much as possible in young patients. In addition, Ville et al demonstrated that older adults were less likely to have repeat coronary angiography revisited than younger adults. 17 Therefore, the probability of finding in-stent restenosis is lower; that is, the probability of finding MACEs after ICR is lower in older adults. The interaction between age and sex can be corrected using this model.
Diabetes has been widely recognized as a risk factor for the pathogenesis and prognosis of CHD. According to Riche et al, patients with a history of diabetes had greater rates of restenosis and mortality after PCI than those without a history of the disease. 18 In addition, after PCI, individuals with good glycemic control had a considerably decreased rate of MACEs, especially regarding the incidence of re-revascularization. 19 Hyperglycemia causes neuropathy, including cardiovascular autonomic neuropathy, which can cause resting tachycardia, delayed heart rate recovery, and decreased heart rate variability and thus increase the probability of readmission after PCI. 20 Therefore, the incidence of MACEs in patients with MVD who have ICR is increased, and compared with traditional risk factors, such as dyslipidemia and hypertension, hyperglycemia appeared to be a predictor in the model, indicating the important role of abnormal glucose metabolism in the poor prognosis of ICR in patients with MVD.
As a new risk factor for atherosclerosis, high uric acid levels have received increasing attention in clinical practice, and some studies have confirmed that they are highly correlated with the risk of cardiovascular events in patients with MVD. Fang et al found that hyperuricemia was an independent risk factor for cardiovascular disease. 21 Uric acid induces inflammation by stimulating the release of chemokines and inflammatory markers (eg, high-sensitivity C-reactive protein), and activating vasoconstrictor mediators (eg, endothelin-1 and angiotensin II).22,23 In addition, uric acid may stimulate the renin-angiotensin system, which further promotes vascular smooth muscle cell growth, arterial function impairment, and arterial wall hardening.24,25 Lim et al reported that plasma purine-breaking metabolites such as uric acid may be markers of coronary plaque instability and inflammation and can be used as markers of restenosis in patients with a history of PCI. 26
Many studies have suggested that UCB has cardioprotective effects, and Vitek et al 27 investigated the association between CHD and Gilbert syndrome (a genetic disorder that causes unconjugated hyperbilirubinemia with normal liver chemistry) and reported that the prevalence of CHD in patients with Gilbert syndrome was 2% (n = 50), compared with 12.1% (n = 2296, P < 0.05) in the general population. Gilbert syndrome reduces the risk of cardiovascular death to one-third that in the general population. 28 Although there is no study on the relationship between UCB and prognosis after PCI, the conclusion of this study can be explained by the theory that Gilbert syndrome reduces the incidence of CHD. The protective effect of Gilbert syndrome on the heart greatly reduces the risk of poor prognosis after ICR in patients with CHD. The mechanisms underlying this protective effect include anti-atherogenic effects through the inhibition of lipid oxidation, decreased platelet adhesion, and decreased lipid levels.29–32 In particular, the dual effects on platelets and blood lipids may be more significant after PCI.
High LDL levels is an established risk factor for CHD. Virchow, a German pathologist, proposed the “lipid infiltration theory” in 1863, which suggests that elevated lipids in blood (including LDL, very low-density lipoprotein, and their residues) invade the arterial wall and accumulate between smooth muscle cells, collagen, and elastic fibers, causing the proliferation of smooth muscle cells, which like monocytes from the blood, can engulf large amounts of lipids and become foam cells. The degradation of lipoproteins to release cholesterol, cholesteryl esters, TC, and other lipids and the binding of LDL to proteins and sugars in the arterial wall to produce insoluble precipitates can stimulate fibrous tissue proliferation, all of which together constitute atherosclerotic plaques. The incidence of atherosclerosis increases with an increase in plasma cholesterol levels. 33 LDL levels are positively correlated with the occurrence of atherosclerosis, and LDL are deposited within the extracellular matrix in blood vessels through apoB100 to form atherosclerotic plaques. 34 In this study, LDL appeared as a predictor and had a significant impact on the model, suggesting that it may be a risk factor worthy of more extensive attention or good control for patients with ICR and MVD.
We also found that complex lesions, such as TO and severe tortuosity lesions, were independent risk factors for MACEs in patients with MVD after ICR. TO and severe tortuosity lesions were defined as complex lesions. 14 Costa et al showed that patients with complex lesions were at higher risk of developing ischemia and dying after PCI. 35 Severe tortuosity lesions are common on angiography, and their extent is strongly related to age. 36 The hemodynamic shear forces of angulated arteries may affect the formation and subsequent rupture of atherosclerotic plaques, resulting in acute coronary syndromes. 37 Furthermore, the delivery of a stent may be more challenging in cases of significant tortuosity lesions. The pressures pushing forward on the surfaces of drug-eluting stents during delivery might cause the drug coating to rupture or peel off, causing a thrombus or encouraging intimal hyperplasia. Turgut et al observed a significantly higher probability of left ventricular diastolic dysfunction in patients with severe tortuosity lesions than in those without. 38 The incidence of MACEs after surgery has increased in patients with MVD who have ICR. TO means there is no forward blood flow (contrast media) filling the occlusion site and distal end, and the absence of perfusion leads to cardiomyocyte necrosis. Necrotic cardiomyocytes cannot recover, worsening prognosis.
Our predictive model included eight predictors that were readily available during hospital admission. The predictive model has noninvasive clinical features and can quickly estimate whether PCI should be recommended for patients with MVD. This predictive model can help doctors determine whether individuals with MVD are at a high risk of having a poor outcome after ICR and can give evidence for early identification of these patients. For example, according to the results of this predictive model, in patients who are female and young with MVD with TO, tortuosity lesions, and with high LDL, Uric acid, FBG, and low UCB levels, CR should be performed as far as possible or CABG can be performed in patients with indications in view of the high risk of MACEs after ICR according to the results of this study.
Because not all predictors in this predictive model are risk factors, the holistic nature of the model should be considered when applying the predictive model in clinical practice, and attention should be paid to the discriminative and calibration ability of the model. Based on the results of this study, a prediction probability of MACEs after ICR between 0.07 and 0.68 in patients with MVD is reliable for deciding whether PCI should be performed.
Limitation
As a single-center retrospective study, this study must have certain limitations. For example, according to the previous literature, the AUROC of the training set should be greater than the AUROC of the validation set, but this study did not reach the same conclusion, this may be caused by the heterogeneity of the population or the large difference in the distribution ratio of a certain indicator in the population. Next, the DCA curve should be infinitely close to Treat All and Treat None, but the net benefit curve is lower than the Treat None curve between 0.69 and 0.72, which may be related to the bias of individual data. Furthermore, there are many variables included in the study, so further expanding the sample size may either improve the robustness of the model or better control the selection bias of the data. Finally, although this model has passed internal verification, there is still a lack of external verification results to prove the prediction ability of the model. In the future, we will continue to expand the sample size, strive to include data from multicenter studies, and conduct prospective studies to further validate the results.
Conclusions
The poor prognosis for ICR after PCI in patients with CHD and MVD is predicted by predictive model for the first time. It is practical to utilize a nomogram to predict individual risk in the therapeutic context.
Supplemental Material
sj-docx-1-cat-10.1177_10760296221139258 - Supplemental material for Establishment of a Predictive Model for Poor Prognosis of Incomplete Revascularization in Patients with Coronary Heart Disease and Multivessel Disease
Supplemental material, sj-docx-1-cat-10.1177_10760296221139258 for Establishment of a Predictive Model for Poor Prognosis of Incomplete Revascularization in Patients with Coronary Heart Disease and Multivessel Disease by Huan Lian, Zhuoyan Zhao, Kelin Ma, Zhenjiang Ding, Lixian Sun and Ying Zhang in Clinical and Applied Thrombosis/Hemostasis
Supplemental Material
sj-xlsx-2-cat-10.1177_10760296221139258 - Supplemental material for Establishment of a Predictive Model for Poor Prognosis of Incomplete Revascularization in Patients with Coronary Heart Disease and Multivessel Disease
Supplemental material, sj-xlsx-2-cat-10.1177_10760296221139258 for Establishment of a Predictive Model for Poor Prognosis of Incomplete Revascularization in Patients with Coronary Heart Disease and Multivessel Disease by Huan Lian, Zhuoyan Zhao, Kelin Ma, Zhenjiang Ding, Lixian Sun and Ying Zhang in Clinical and Applied Thrombosis/Hemostasis
Footnotes
Author's Note
This study was approved by the Ethics Committee of The Affiliated Hospital of Chengde Medical University Hospital. The requirement for informed consent was obtained for this study.
Kelin Ma is also affiliated at Department of Cardiology, Beijing Shijingshan District Hospital, Beijing, China.
Declaration of Conflicting Interests
The author(s) declared no potential conflicts of interest with respect to the research, authorship, and/or publication of this article.
Funding
The author(s) received no financial support for the research, authorship, and/or publication of this article.
Supplemental Material
Supplemental material for this article is available online.
References
Supplementary Material
Please find the following supplemental material available below.
For Open Access articles published under a Creative Commons License, all supplemental material carries the same license as the article it is associated with.
For non-Open Access articles published, all supplemental material carries a non-exclusive license, and permission requests for re-use of supplemental material or any part of supplemental material shall be sent directly to the copyright owner as specified in the copyright notice associated with the article.