
Abstract
Background:
Magnetic resonance (MR) black-blood thrombus imaging (BTI) is an accurate diagnostic technique for detecting deep vein thrombosis (DVT) but to date there have been no studies comparing the diagnostic performance and consistency of this technique at different field strengths. In this study, we evaluated and compared the diagnostic performance of BTI for detecting DVT at 1.5 T and 3.0 T field strengths.
Methods:
A total of 40 patients with DVT were enrolled in this study from November 2015 up to October 2018. All patients underwent BTI, a contrast-free T1-weighted MR imaging technique for detecting DVT, and contrast-enhanced MR venography (CE-MRV) at 1.5 T or 3.0 T field strengths. The MR data analyses used 1160 segments from the venous lumen of the 40 patients. The signal-to-noise ratio and contrast-to-noise ratio between thrombus and muscle/lumen were calculated to compare BTI at 1.5 T or 3.0 T to determine the image performance for thrombus detection at 1.5 T or 3.0 T. Two physicians blinded to the study evaluated all BTI images and calculated the overall sensitivity (SE), specificity (SP), positive predictive value (PPV) and negative predictive value (NPV), accuracy, and diagnostic consistency at 1.5 T and 3.0 T. These images and values were compared to control CE-MRV images that had been obtained by 2 senior physicians and used as reference standards. In addition, the reliability and consistency of diagnoses between observers were also evaluated.
Results:
Two study-blind physicians reviewed all BTI images to diagnose thrombus and to determine SE, SP, PPV, NPV, and accuracy. There were no statistical differences in SE, SP, PPV, NPV, or accuracy between the 1.5 T and 3.0 T groups.
Conclusions:
Black-blood thrombus imaging has high SE, SP, and accuracy for DVT diagnosis both at 1.5 T and 3.0 T field strengths. This noninvasive diagnostic technique, which does not require the use of contrast agents, can be widely used in the clinical screening of DVT and follow-up after treatment.
Introduction
Based on reports from the World Health Organization, cardiovascular and cerebrovascular diseases are the leading global causes of death and are especially prevalent in lower-middle to high-income countries. 1,2 Pulmonary embolism originating from deep venous thrombosis (DVT) of the lower extremities is the third leading cause of cardiovascular death after coronary artery disease and stroke. 1 However, because of the absence of early signs indicating the onset of adverse thrombotic events, DVT is often overlooked with regard to thrombotic complications. Thus, early detection of thrombus plays a critical role in the prevention and management of cardiovascular and cerebrovascular events.
Ultrasonography is currently the most popular technique used for DVT screening due to its low cost, noninvasiveness, operational convenience, and high diagnostic sensitivity (SE) and specificity (SP). Color Doppler flow imaging (CDFI) has found widespread usage in the clinical diagnosis of DVT. 3,4 However, the diagnostic SE and SP of CDFI are directly dependent on the proficiency of the operator, and the method is limited to detecting thrombus located at specific sites (eg, pelvic veins), making it unsuitable for evaluating the vessel state as a whole. These inadequacies restrict its application in the diagnosis and treatment of DVT. 5 –8
Recent studies have described the value of magnetic resonance (MR) black-blood thrombus imaging (BTI) in the diagnosis of thrombus. 9 –13 To diagnosis a thrombus, it is necessary to suppress the signal flowing through the blood and to capture the signal of the stationary tissue. Because the concentrations of methemoglobin (MET-Hb) rely on the phase of the DVT, the signal intensity (SI) of the thrombus on the T1-weighted image varies. Thus, if the content of MET-Hb in the acute phase is low, the SI of thrombus on BTI is equal or slightly higher; if the content of MET-Hb in the subacute phase is higher, the thrombus has a high SI; if the content of MET-Hb in the chronic phase is very low (indicating a conversion to hemoflavin), the thrombus shows a lower SI but higher than the surrounding blood signal. However, the evolution of thrombus is complex, and mixed signals often appear because the proportion and location of MET-Hb in thrombus are different. 13 –15 The 3-dimensional imaging of BTI can provide clinicians with multidirectional image information about whether there is vascular variation, which allows a more accurate diagnosis and description of the location and size of thrombus and can even indicate the age of thrombus, which has very important significance when choosing treatment. 10,16 -18 Anticoagulation and thrombolytic therapies are the mainstay of DVT treatment; however, they are the most effective in the acute phase and rapidly decrease in their effectiveness as thrombus composition evolves with age. 16 –18
The 1.5 T and 3.0 T MR systems are commonly used in the clinic. In previous studies, 9 –11 BTI has been used at either 3.0 T or 1.5 T field strengths for the diagnosis of DVT, respectively. Research demonstrated that BTI is an accurate diagnostic technique for DVT but to date there has been no research comparing the diagnostic performance and consistency of this technique at different field strengths.
In this study, we tested and verified the signal-to-noise ratio (SNR) and contrast of BTI images obtained from 1.5 T and 3.0 T MR. We evaluated the overall SE, SP, positive predictive value (PPV), negative predictive value (NPV), and accuracy of BTI across both MR systems to compare and confirm whether clinical diagnostic conditions were met.
Materials and Methods
Patients
A total of 40 patients with lower extremity DVT were enrolled from November 2015 up to October 2018 and were imaged on either 1.5 T or 3.0 T MR platforms. Twenty patients were assigned to the 1.5 T MR group, and 20 patients were assigned to the 3.0 T MR group. The inclusion criteria were: (1) positive results of lower extremity DVT confirmed by a routine ultrasonography; (2) stable vital signs; and (3) no serious cardiovascular or cerebrovascular diseases or renal insufficiency. The exclusion criteria included: (1) contraindications to MR such as renal insufficiency, pregnancy, claustrophobia, or previous implants performed without confirmed MR safety and (2) lower extremity arterial occlusive diseases. 12 This research was approved by the ethics committees of the 2 study institutions, and written informed consent was obtained in all cases.
All patients had lower extremity DVT. Twenty patients were enrolled at Pan Yu Central Hospital (male/female [M/F] = 11/9; age range: 29-81 years; average age: 52.7 ± 15.7 years) and were imaged on a 1.5 T MR platform. Of this group, 6 patients had thrombus in the right lower extremities, 11 patients had thrombus in the left lower extremities, and 3 patients had bilateral thrombus in the lower extremities. The second group of 20 patients were enrolled at Shenzhen Institutes of Advanced Technology (M/F = 12/8; age range: 28-79 years; average age: 50.4 ± 13.7 years) and were imaged on a 3.0 T MR platform. Of this group, there were 7 patients with thrombus in the right lower extremities, 11 patients with thrombus in the left lower extremities, and 2 patients with bilateral thrombus in the lower extremities. All 40 patients had pain and swelling in the limbs. The duration of symptoms ranged from 2 days to 7 years but all patients had experienced a recent exacerbation of DVT symptoms. Because of the clinical symptoms of most patients, and according to the patient’s will, only 3 of the 40 patients were performed BTI on both 1.5 T and 3.0 T MR scanners.
Magnetic Resonance Scanning
Magnetic Resonance scanning was performed on a 1.5 T clinical scanner (Siemens Avanto, Germany) in our institution and on a 3.0 T scanner (Siemens TimTrio) at the collaborating institution. All patients were placed feet first in the supine position and examined using a BTI sequence and a 3-station scanning. The scanning device contained a 6-channel body coil, an 8-channel peripheral vascular coil, and integrated spine coils; these coils covered the pelvic cavity, thigh, and calf, respectively. Contrast-enhanced MR venography (CE-MRV) was also performed on each of the patients as per our previous studies. 9 –11 For this, 30 mL of contrast agent (Magnevist, 469 mg/mL, Bayer, Berlin, Germany) was injected intravenously by a remote-controlled injection system (Medrad Spectris, Indianola, Pennsylvania), followed by a 20-mL saline flush. When the contrast agent arrived at the external iliac artery, the scanning process was triggered. The scan was repeated 3 times to improve the reliability of the scan. The scan parameters of BTI and CE-MRV on 1.5 T and 3.0 T were the same as previous studies, respectively. 9 –11 The BTI and CE-MRV scanning parameters of 1.5 T and 3.0 T are detailed in Table 1.
Imaging Parameters of BTI (1.5 T), CE-MRV (1.5 T), BTI(3.0 T), CE-MRV (3.0 T) in the Patient Study.
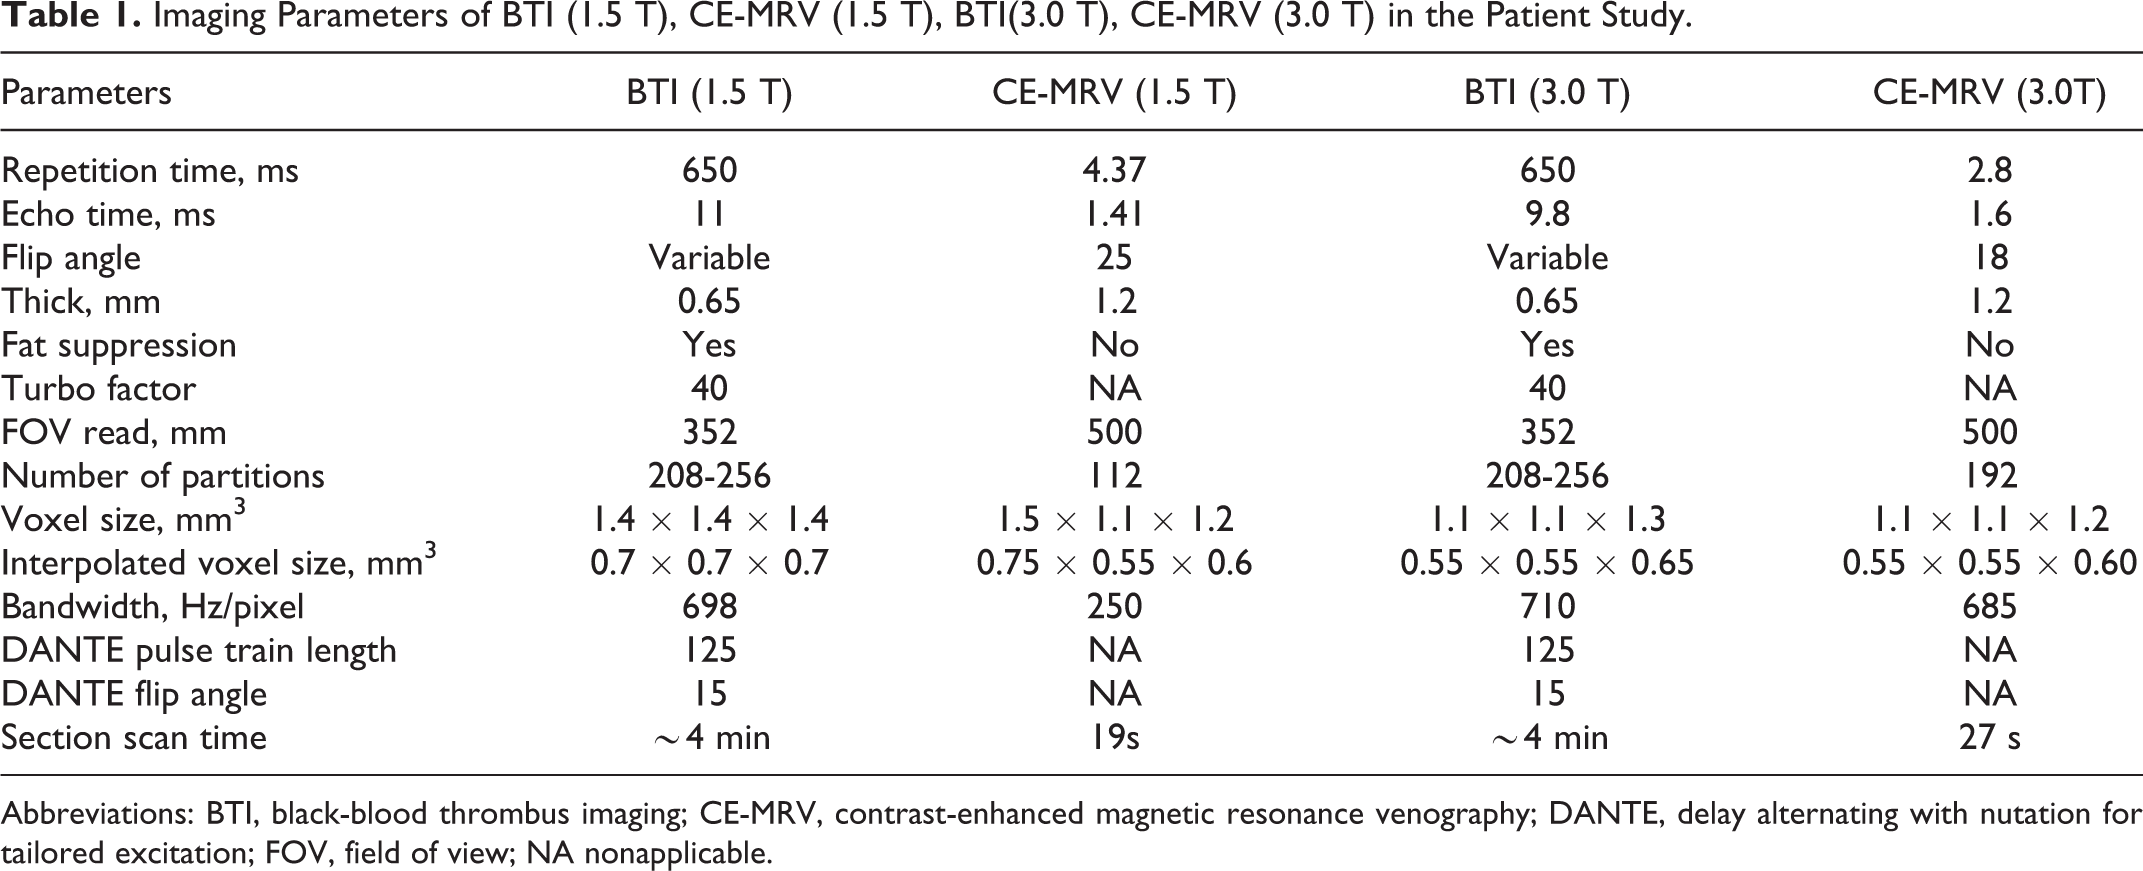
Abbreviations: BTI, black-blood thrombus imaging; CE-MRV, contrast-enhanced magnetic resonance venography; DANTE, delay alternating with nutation for tailored excitation; FOV, field of view; NA nonapplicable.
Image Analyses
All images were imported into a postprocessing workstation (Avanto or Leonardo; Siemens, Germany), and the MR images from the 1.5 T and 3.0 T systems were blindly evaluated together. Two radiologists with more than 10 years of cardiovascular MR experience were employed to blindly evaluate the BTI and CE-MRV images independently and randomly, without knowledge of the patient’s clinical information. The overall venous system of the lower extremity was divided into 29 segments: the inferior vena cava and common iliac vein, internal iliac vein, external iliac vein, common femoral vein, femoral vein, deep femoral vein, popliteal vein, tibiofibular trunk vein, anterior tibial vein, posterior tibial vein, peroneal vein, great saphenous vein, small saphenous vein, and the lateral leg branch vein on the left and right sides. A 4-point scale of diagnostic confidence (1 = poor, 2 = fair, 3 = good, 4 = excellent) was used. Both readers were required to determine the presence of a thrombosis in any segment of the venous lumen and provide their diagnostic confidence score. If there were inconsistencies between the 2 readers on the reading of CE-MRV, a consensus was reached on the consultation by using all available clinical information, such as the diagnostic results of ultrasonography.
In order to confirm whether BTI images met the diagnostic quality requirements using 1.5 T and 3.0 T field strengths, a 4-point Likert scale13 was employed to evaluate the image quality of each observed vessel segment in all the patients. The 4-point scale for the image quality was defined as: 1 = poor: image with severe artifacts and/or poor venous blood signal suppression; 2 = fair: image with moderate artifacts and/or fair venous blood signal suppression; 3 = good: image with minimal artifacts and good venous blood signal suppression; and 4 = excellent: image free of artifacts and with excellent venous blood signal suppression.
The SNR and the contrast-to-noise ratio (CNR) of the 1.5 T and 3.0 T groups were calculated using SYNGO software (Siemens), respectively, for analyzing the statistical differences between the 2 groups of images. Using methods from previous studies, 9 –11 the apparent SNR of the thrombus, muscle, and the dark venous lumen was calculated as the mean SI divided by the standard deviation (SD) of the background (ie, SI/SD); and in order to avoid the deviation caused by different sampling resolution, SNR is normalized and compared (SNR3.0 T = SI/SD/[voxel3.0 T/voxel1.5 T]). The apparent CNR between the thrombus and the muscle ([SIthrombus − SImuscle]/SD) and between the thrombus and the venous lumen ([SIthrombus − SIlumen]/SD) was also calculated. In addition, the thrombus signal was classified as either isointense and hyperintense, the isointense thrombus has comparable SI to the adjacent muscle while the hyperintense thrombus has much higher SI compared to the adjacent muscle.
Statistical Analyses
Statistical analyses were performed using SPSS (IBM version 23.0; IBM North America, New York). Continuous variables were presented as mean ± SD, and categorical variables were presented as frequencies and percentages. Two-sample t test was used to detect the difference in continuous variable between 2 groups. Chi-square test was used to evaluate the overall SE, SP, PPV, and NPV, as well as the accuracy of BTI in the diagnosis of DVT. Interobserver agreement and agreement between 1.5 T and 3.0 T MR scanners were tested using the κ test. Statistical significance was established at P < .05.
Results
In total, 1160 venous segments from 40 patients were evaluated by both BTI and CE-MRV on 1.5 T and 3.0 T MR scanners, respectively. The CE-MRV results were used as the standard reference, indicating consensus on the diagnosis. Thrombus was confirmed in 203 (30.5%) of 580 venous segments examined on the 1.5 T MR platform. The distribution of thrombus in the 203 segments was as follows: 62 (30.5%) iliac vein segments, 79 (38.9%) femoropopliteal venous segments, 51 (25.1%) calf vein segments, 4 (2%) superficial venous segments, and 7 (3.5%) collateral branch venous segments. Thrombus was confirmed in 217 (37.4%) venous segments examined on the 3.0 T MR platform. The distribution of thrombus in the 217 segments included 71 (32.7%) iliac vein segments, 80 (36.9%) femoropopliteal venous segments, 56 (25.8%) calf vein segments, 3 (1.4%) superficial venous segments, and 7 (3.2%) collateral branch venous segments.
The SNR and CNR of the 2 sets of images were obtained using SYNGO software (Siemens; Figure 1). There was agreement on image quality and diagnostic confidence scores for all BTI and CE-MRV images (Tables 2 and 3). Both isointense and hyperintense thrombi had sufficient CNR for diagnosis between the 2 groups (Figure 2).

Comparison of histograms from 1.5 T and 3.0 T BTI images: SNR and CNR.
Comparison of BTI and CE-MRV Image Quality Scores Between 1.5 T MR and 3.0 T MR.

Abbreviations: BTI, black-blood thrombus imaging; CE-MRV, contrast-enhanced MR venography; MR, magnetic resonance.
Comparison of BTI and CE-MRV Diagnostic Confidence Scores Between 1.5 T MR and 3.0 T MR.a

Abbreviations: BTI, black-blood thrombus imaging; CE-MRV, contrast-enhanced MR venography; MR, magnetic resonance.
a n = 580.

Representative images from a DVT patient conducted on both 3T and 1.5T.
Tables 4 to 6 show the SE, SP, PPV, NPV, and accuracy of the 2 readers in diagnosing thrombus using BTI, using the consensus CE-MRV diagnosis as the reference standard. Concordance between the diagnosis of readers in the 2 groups was excellent (κ = 0.94, P < .001). As shown in Table 6, BTI was used on 2 different MR machines with different field strengths, showing approximately the same extent of the thrombus.
1.5 T Results of BTI and CE-MRV Examinations in 580 Vessel Segments.

Abbreviations: BTI, black-blood thrombus imaging; CE-MRV, contrast-enhanced magnetic resonance venography.
3.0 T Results of BTI and CE-MRV Examinations in 580 Vessel Segments.

Abbreviations: BTI, black-blood thrombus imaging; CE-MRV, contrast-enhanced magnetic resonance venography.
Qualitative and Statistical Analysis of BTI Measured on 1.5 T and 3.0 T MR for the Diagnosis of DVT Using Consensus CE-MRV as the Reference.

Abbreviations: ACC, accuracy; BTI, magnetic resonance black-blood thrombus imaging; CE-MRV, contrast enhanced magnetic resonance venography; DVT, deep vein thrombosis; MR, magnetic resonance; NPV, negative predictive value; PPV, positive predictive value; SE, sensitivity; SP, specificity.
Discussion
Based on relevant reports 13, 19 and previous studies, 9 –11 BTI has become an important tool to predict the success of thrombus therapy because changes in the venous thrombus signal can be observed on BTI images. With the rising popularity of MR in major hospitals and the development of MR technology, an increasing number of physicians use MR for preoperative evaluation and postoperative follow-up of lower extremity venous thrombosis. The purpose of this current study was to evaluate the use of BTI on 1.5 T and 3.0 T MR systems and to demonstrate that these can produce high-quality DVT images that meet the requirements for accurate diagnosis, with no deviation of diagnostic results due to the differing magnetic field intensities. The results of the study were in line with our expectations.
In this study, BTI images were shown to have high image quality; additionally, high diagnostic confidence scores were produced for both the 1.5 T and 3.0 T MR groups, with no statistical differences between the 2 groups. The SNR, CNR, and spatial resolution of 3.0 T MR images were better than those of 1.5 T MR images, and there were significant differences in the SNR and CNR of isointense and hyperintense thrombus between the groups (Figure 1). However, 1.5 T MR has lower specific absorption rate and better B0 field homogeneity which provides more uniform image. Nevertheless, the BTI technique has high SE (97.5% vs 97.7%), SP (98.6% vs 99.2%), and accuracy (97.5% vs 97.7%) for both 1.5 T and 3.0 T scans in diagnosing DVT. There were no statistically significant differences between the 1.5 T and 3.0 T MR groups.
Misdiagnosed or missed thrombus in the above knee venous segment was associated with the location of thrombus which, in cases of misdiagnosis, was at the boundary between the 2 segments of venous lumen. In addition, the structure of the pelvis is complex, and when the signal of the internal iliac vein thrombosis is the same as that of the surrounding muscles, DVT can be easily misdiagnosed. 11 In contrast, missed or misdiagnosed thrombus below the knee is not only related to the complex vessel structure but also the small lumen in the lower leg that causes slow venous blood flow which was not completely suppressed by BTI. This is not a problem unique to the BTI technique but is a common problem when the contrast is based on blood flow suppression or enhancement, such as with the widely used technique of ultrasound. Fortunately, because DVT is often characterized by obstruction/ dilatation of the involved veins and the clot is heterogeneous, the thrombus appeared as a signal with isolated and/or inhomogeneity intensity within the black venous lumen. Thus, many thrombi can be identified even if the venous blood flow is not suppressed completely.
The diagnostic confidence scores were approximately the same between the 2 groups with no statistically significant differences. The SNR and CNR were lower in the 1.5 T group than in the 3.0 T group, but these ratios did not influence the diagnostic scores. The SE, SP, PPV, NPV, and accuracy calculated from the 1.5 T MR and 3.0 T MR groups did not differ statistically. The diagnostic confidence scores of the 2 reviewers in the 2 groups were also highly consistent. Thus, there is a high degree of confidence that accurate diagnoses are provided before treatment and postoperative evaluation.
Although asymptomatic DVT is easily missed in the clinic, 3 asymptomatic cases of DVT in the contralateral lower extremity were identified in our study. We attribute our ability to detect asymptomatic DVT to the use of MR. Compared with ultrasonography, MR can simultaneously examine bilateral iliac veins, which are not affected by pelvic intestinal gas and other factors. It can be repeated many times and observations can be made at any oblique plane.
There were 2 shortcomings in this research. First, although the diagnostic gold standard for DVT is X-ray venography, 20 we utilized CE-MRV as the reference standard in this study. Nevertheless, CE-MRV has been demonstrated to have higher SE and SP compared with venography in multiple studies. 21 – 23 Second, only 3 patients with thrombus underwent MR scans on both 1.5 T and 3.0 T. This is because most of the patients didn’t agree to do BTI scan twice in a same day, which may cause a small deviation of the sample data. However, just like many multicenter studies, 13,23,24 as the reference standards are identity (ie, CE-MRV in this work), the collected data still can be used for agreement test.
Conclusions
In summary, this study confirmed that the SE and SP of BTI imaging for the diagnosis of DVT are highly consistent between the 1.5 T and 3.0 T MR platforms. It is a promising technique that can be widely used in the clinical screening of DVT.
Footnotes
Declaration of Conflicting Interests
The author(s) declared no potential conflicts of interest with respect to the research, authorship, and/or publication of this article.
Ethics approval and consent to participate
This study was approved by the institutional review boards of the Guangzhou Panyu Central Hospital (K20150030 and H20170024). In addition, informed consent was obtained from all the participants.
Funding
The author(s) disclosed receipt of the following financial support for the research, authorship, and/or publication of this article: This work was supported in part by the National Science Foundation of China (81971607,81729003) and the Natural Science Foundation of Guangdong (2017A050501026), Guangzhou Science, Technology and Innovation Commission (201804010240)