
Abstract
Deep vein thrombosis (DVT) is a common postoperative complication of knee/hip arthroplasty. There is a continued need for artificial intelligence-based methods of predicting lower extremity DVT risk after knee/hip arthroplasty. In this study, we performed a retrospective study to analyse the data from patients who underwent primary knee/hip arthroplasty between January 2017 and December 2021 with postoperative bilateral lower extremity venous ultrasonography. Patients’ features were extracted from electronic health records (EHRs) and assigned to the training (80%) and test (20%) datasets using six models: eXtreme gradient boosting, random forest, support vector machines, logistic regression, ensemble, and backpropagation neural network. The Caprini score was calculated according to the Caprini score measurement scale, and the corresponding optimal cut-off Caprini score was calculated according to the largest Youden index. In total, 6897 cases of knee/hip arthroplasty were included (average age, 65.5 ± 8.9 years; 1702 men), among which 1161 (16.8%) were positive and 5736 (83.2%) were negative for deep vein thrombosis. Among the six models, the ensemble model had the highest area under the curve [0.9206 (0.8956, 0.9364)], with a sensitivity, specificity, positive predictive value, negative predictive value, and F1 score of 0.8027, 0.9059, 0.6100, 0.9573 and 0.7003, respectively. The corresponding optimal cut-off Caprini score was 10, with an area under the curve, sensitivity, specificity, positive predictive value, and negative predictive values of 0.5703, 0.8915, 0.2491, 0.1937, 0.9191, and 0.3183, respectively. In conclusion, machine learning models based on EHRs can help predict the risk of deep vein thrombosis after knee/hip arthroplasty.
Introduction
Knee/hip arthroplasty is an effective method for treating end-stage knee and hip joint diseases. The number of knee/hip arthroplasties performed has rapidly increased, with the annual cases of total knee arthroplasty (TKA) and total hip arthroplasty (THA) in the United States projected to reach 1.92 million and 850,000, respectively by 2030. 1 Deep vein thrombosis (DVT) is a common postoperative complication of knee/hip arthroplasty. Previous studies have reported DVT incidence rates of up to 70% after THA 2 and 84% after TKA 3 in the absence of appropriate preventive measures. With improvements in intraoperative strategies and the effective and standardised adoption of perioperative preventive measures, such as early postoperative out-of-bed activities, physical prevention, and pharmacological prevention, the incidence of DVT has decreased significantly. However, a study by Rong et al 4 on venous angiography revealed that DVT incidence rates after THA and TKA were 12.0% and 22.7%, respectively, despite the adoption of standard preventive measures.
The clinical manifestations of DVT vary substantially. In certain patients with mild DVT, clinical symptoms may not be apparent, and the condition may only be detected during ultrasonography or other examinations. However, other patients may exhibit swelling and pain in the affected extremity, poor functional status, and slower recovery. Severe DVT may cause subsequent pulmonary complications, such as pulmonary thromboembolism (PTE), and is one of the major causes of death in the perioperative period. 5 In addition, medical prophylaxis, including aspirin, low-molecular-weight heparin, and direct factor Xa inhibitors, may increase the risk of local ecchymoses, bleeding from wounds, anaemia, intracerebral haemorrhage. They may also impose a higher economic burden on the patients.6,7 Therefore, predicting the occurrence of DVT after knee/hip arthroplasty is essential.
At present, methods commonly used in clinical practice for predicting DVT include measurement scales developed based on statistical analyses of clinical data. These include the Autar DVT scale, 8 JFK Medical Center DVT risk assessment tool, 9 Padua Prediction Score, 10 the Risk Assessment Profile for Thromboembolism scale 11 and Caprini Score for Venous Thromboembolism. 12 In particular, the Caprini score is the most commonly used measurement in the field of orthopaedics. 13 Although these measurement scales are easy to use and score, several shortcomings include a considerable time and effort required for scoring, low prediction accuracy, consideration of influencing factors, and inability to provide dynamic real-time early warnings. Recently, with advancing medical technology and continuous accumulation of data, the clinical application of artificial intelligence (AI) has revolutionised diagnostics and treatment paradigms. AI-based prediction methods are already capable of effectively predicting the risk of peripherally inserted central venous catheter (PICC)-related thrombosis 14 and thrombosis following total shoulder arthroplasty. 15
However, the feasibility of AI-based methods for predicting lower extremity DVT risk after knee/hip arthroplasty has not yet been reported. Therefore, the present study aimed to investigate the use of AI methods for predicting DVT after knee/hip arthroplasty using electronic health records (EHRs) and compare these results with traditional measurement scales represented by Caprini scores. We anticipate that the subjective evaluation of the risk of DVT can assist in the early identification of high-risk populations, and the subsequent adoption of effective preventive measures can reduce the risk of complications, such as PTE, accelerate patient recovery, and promote reasonable utilisation of healthcare resources.
Methods
Study Design and Setting
We conducted a retrospective analysis using the data from EHRs of a health system. The study protocol was approved by the hospital institutional review board (Approval No: IRB00006761-M202004). Since the data was obtained from a deidentified set retrospectively, consent was not required.
Study Samples
Patients who underwent knee/hip arthroplasty at our institution between January 2017 and December 2021 were considered for the study. Patients were identified through a search of EHRs using the International Classification of Diseases (ICD) procedure codes shown in Table 1 (ICD-9-CM 3-Beijing Inpatient Medical Record Home Page Procedure Classification and Codes V 6.01). The inclusion criteria were as follows: (i) patients who underwent primary knee/hip arthroplasty; (ii) patients who underwent bilateral lower extremity venous ultrasonography examination duration hospital stay after surgery. The exclusion criteria were as follows: (i) revision knee/hip arthroplasty; (ii) femoral head resurfacing arthroplasty; and (iii) new-onset DVT detected by preoperative bilateral lower extremity venous ultrasonography examination.
Procedure Codes of Patients Included in the Study.

Predictors
Input variables included information on demographics, clinical characteristics, laboratory test measurements, medication use, examinations, and comorbidities.
All variables of the EHRs from hospital admission to the time of postoperative bilateral lower extremity venous ultrasonography examination were extracted to form the feature dataset. If multiple bilateral lower extremity venous ultrasonography examinations were performed for the duration of hospital stay postoperatively, the end time was set as the time of the ultrasonography examination with the first positive result, ie, the time of determination of DVT onset. If no positive results were obtained, the end time was set as the time of the last ultrasonography examination. Table 2 shows the main patient features extracted from the EHRs.
Patient Features Extracted from the EHRs.
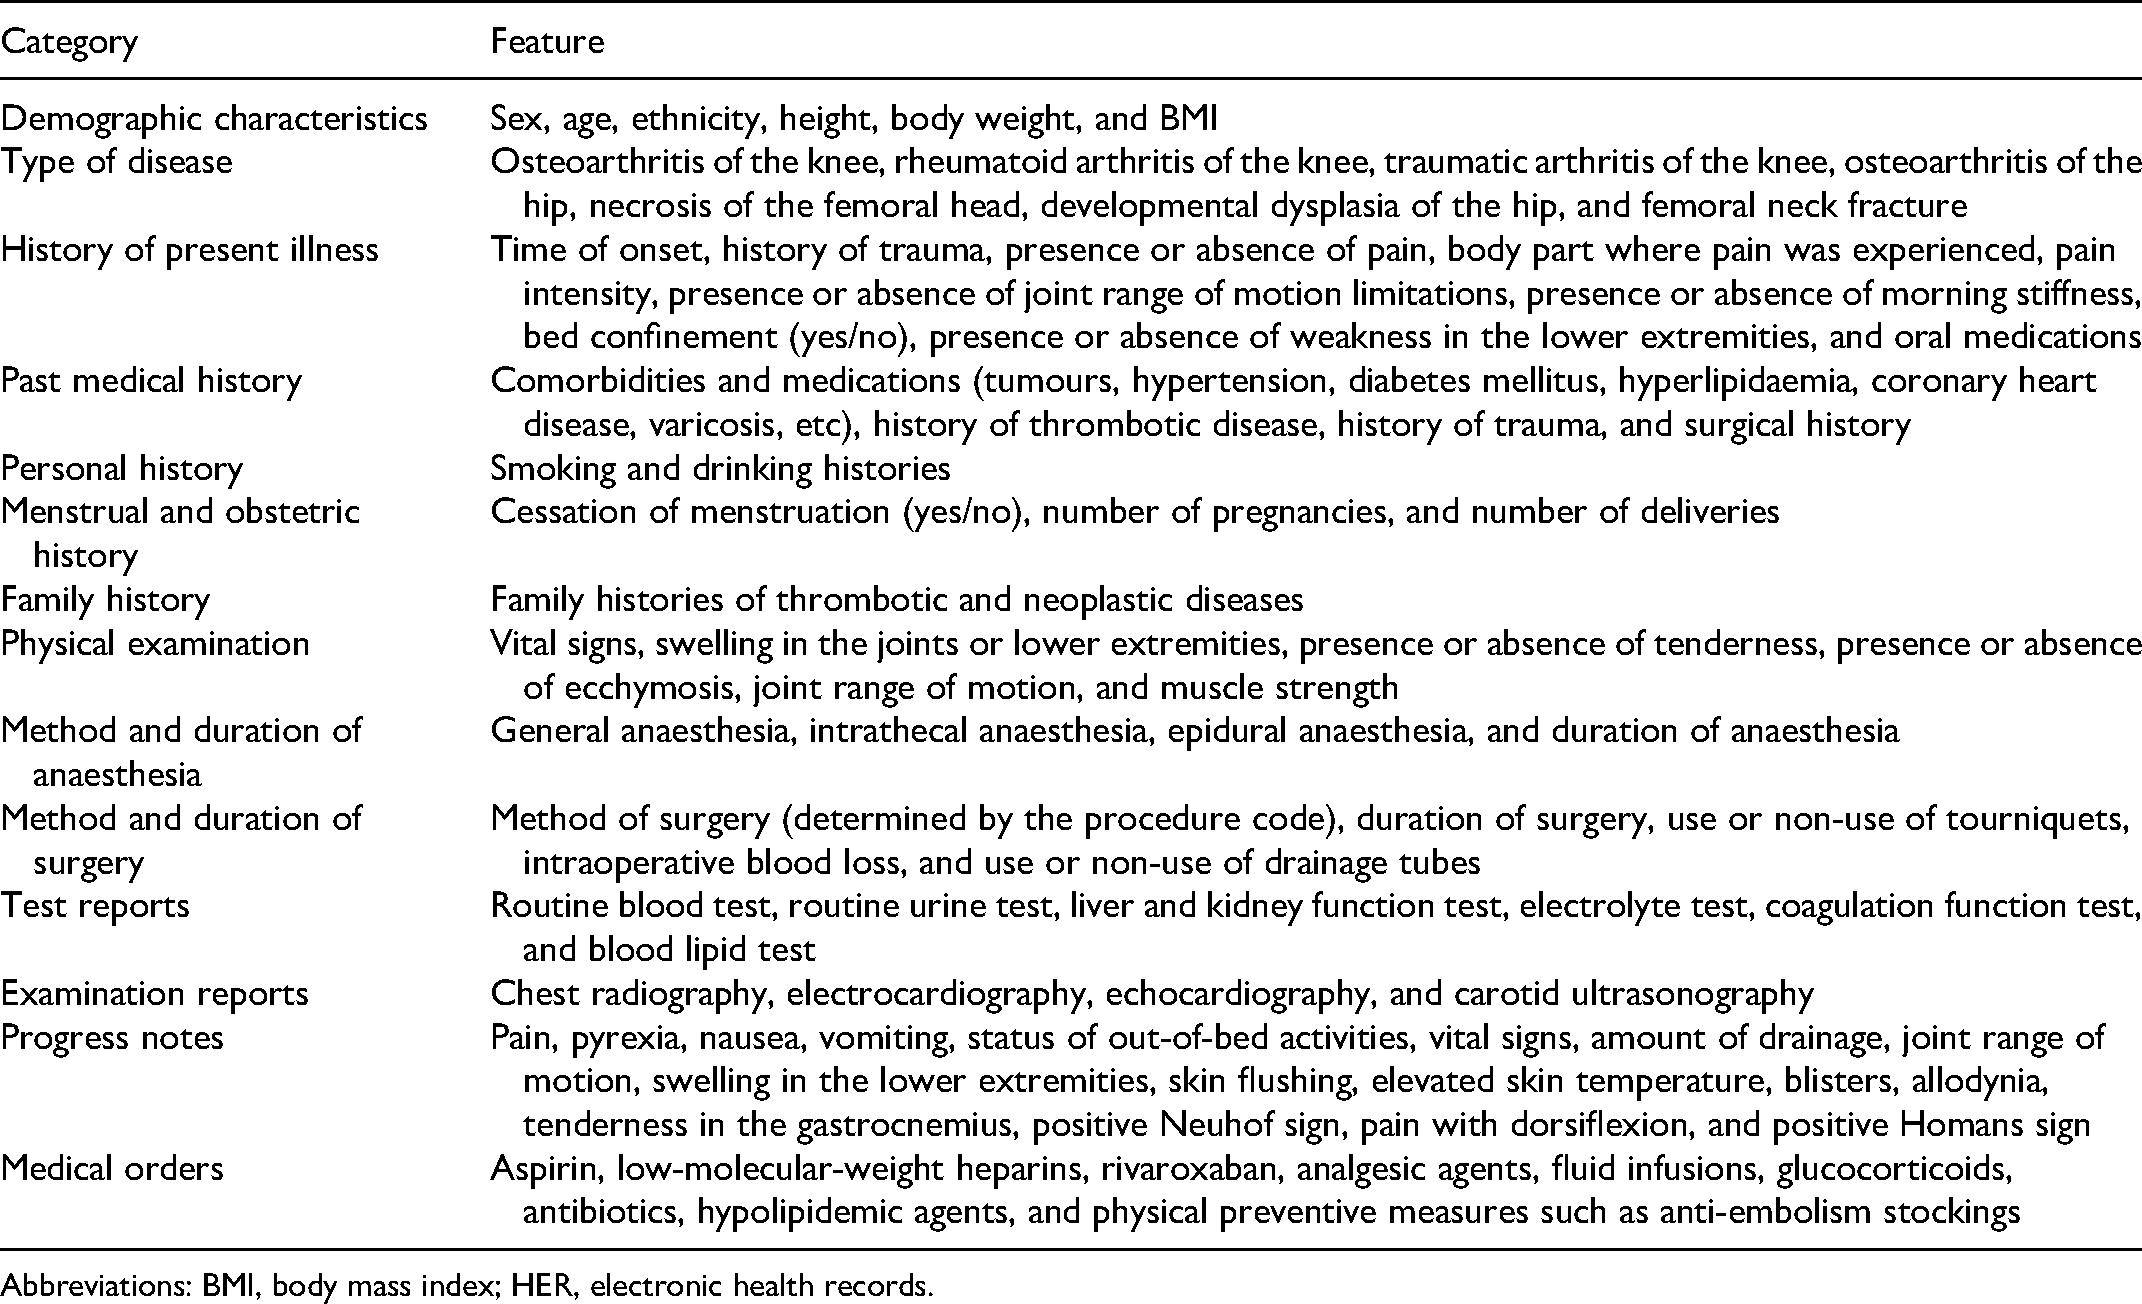
Abbreviations: BMI, body mass index; HER, electronic health records.
In our institution, DVT prevention protocol consisted of basic prevention measures, physical prevention measures, and drug prevention measures. (i) basic prevention measures included careful surgical operations to reduce venous intimal damage, correct use of tourniquet, raised limb after surgery to promote venous reflux, and moderate fluid supplementation to avoid blood concentration, etc; (ii) physical prevention measures included gradient compression stockings and intermittent pneumatic compression devices; (iii) drug prevention measures include rational use of, low molecular weight heparin, factor Xa inhibitors, aspirin, and other drugs. For example, low molecular weight heparin was used in primary total knee arthroplasty or total hip arthroplasty with reasonable dose and frequency during hospitalisation, while aspirin was used after discharge for patients without DVT, and Xa inhibitors was used after discharge for patients with DVT. The above prevention measures were adjusted individually.
Outcomes Measures
In our institution, all patients who underwent primary knee/hip arthroplasty between January 2017 and December 2021 received bilateral lower extremity venous ultrasonography examination within 5 weeks after surgery. Patients whose results of the lower extremity venous revealed the presence of DVT were designated as positive cases, and those whose results showed an absence of DVT were designated as negative cases. The DVT we referred in this study included intermuscular DVT, although intermuscular DVT was not as dangerous as proximal DVT, treatments need to be adjusted.
Unstructured Data Processing
EHRs contain patients’ comprehensive, detailed and accurate personal health information, which can be used in depth. A large number of patient-related potential information can be obtained through deeply analyzing and exploring the information in EHRs. However, in addition to structured data such as blood test results, unstructured free-text data occupies a very large proportion, which can have various ambiguities or ambiguities. Generally speaking, it is difficult for model training to understand and utilise such unstructured data.
Therefore, we used a multi-level entity relation extraction scheme to process free-text data by natural language processing (NLP) techniques in EHRs. First, the text and section contents of different EHRs were distinguished using “free-text class prediction” and “free-text section prediction.” Therefore, extraction of clinical data was performed through the utilisation of a combined bidirectional long short-term memory-conditional random fields (BiLSTM-CRF) approach. 16 A model case is presented in Figure 1.

Free-text extraction and labelling.
From the aforementioned free-text data, we extracted all entities and the corresponding entity labels, such as the time entity “more than 10 years ago,” symptom entity “tingling pain,” and body part entity “medial side of the right knee joint.” The semantic relationships between different entities were also determined and extracted. For instance, the semantic relationship between “more than 10 years ago” and “tingling pain” was the time of symptom onset, and the semantic relationship between “medial side of the right knee” and “tingling pain” was the body part where symptom onset occurred. “Knee joint redness and swelling, morning stiffness, joint locking” were designated as non-accompanying symptoms.
Then, the extracted results of BiLSTM-CRF approach were stored in the database. Now, data of EHRs were transformed from free-text data to structured data, and it had to be further processed for machine learning model. For temperature, blood pressure, and other continuous numerical characteristics, outliers were deleted. In order to eliminate the adverse effects of different dimensions between different features on model training, the continuous features are normalised to the range of [0,1].
To address differences in the descriptions of entities, such as symptoms, vital signs, and disease names, among different doctors, we performed normalisation of identical entities with different descriptions by using standard names from the BMJ Best Practice database. For instance, “joint disease of the left knee,” “osteoarthritis of the left knee,” and “left knee osteoarthritis” were normalised as “osteoarthritis of the left knee”. 17 Information on symptoms, diseases, and drugs in the EHRs were also normalised based on hierarchical relationships. For instance, “enoxaparin sodium injection,” “nadroparin calcium injection,” “fondaparinux sodium injection,” “low-molecular-weight heparin calcium injection,” and “dalteparin sodium injection” were normalised as “low-molecular-weight heparins.”
Identical entity information in different sections of an EHR may be of different clinical significance. For instance, although “femoral neck fracture” in the “history of present illness” section and “femoral neck fracture” in the “past medical history” section belong to the same disease entity, they are indicative of the patient's present and past illnesses, respectively, which affect the risk of DVT onset to different extents. Therefore, feature concatenation based on relationships between sections and entities was performed to differentiate between identical entities in different sections. Finally, one-hot encoding was performed as 0/1 to represent the original feature. A value of 1 indicates that there was this feature, and 0 indicates that there was no such feature.
Statistical Analysis
Patient data were randomly assigned to two datasets: (1) training dataset (80% of patients) for model training; and (2) test dataset (20% of patients) for model performance evaluation. The proportions of positive cases in the training and test datasets were identical. Each model was subjected to 5-fold cross-validation and GridSearchCV for the iterative selection of the best hyperparameter combinations from the candidate stochastic pools to obtain reliable and stable models. The 5-fold cross-validation involved the random division of experimental data into five groups, with four groups used for model training and one group used for model testing. After the cross-validation process had been repeated five times, we obtained five models and their corresponding evaluation results. The final model performance was determined by calculating the average values of the performance metrics of the five models.
A comparative experiment was performed with the following models: eXtreme gradient boosting (XGBoost) model, 18 random forest (RF) model, 19 support vector machines (SVM) model, 20 logistic regression (LR) model, 21 and backpropagation neural network (BPNN) model. 22 In addition, each machine learning algorithm solve the problems in a slightly different way, and different algorithms may give different answers to the same problem, therefore, we adopted ensemble model by weighted voting (an ensemble of XGBoost, RF, SVM, and LR models), 23 and the highest probability among the four model predictions was defined as the final prediction result.
Model performance was evaluated using the following metrics: area under the receiver operating characteristic (ROC) curve (AUC) with 95% confidence interval (CI), sensitivity, specificity, positive predictive value (PPV), negative predictive value (NPV) and, F1 score.
Caprini score, as a baseline prediction tool, was used to comparison with other machine learning models. The Caprini score was all scored in electronic health records by nurses when every patient was admitted to our ward. The Caprini scores were calculated according to the Caprini score measurement scales (2013 version), 13 and the corresponding optimal cut-off Caprini scores according to the largest Youden index were also calculated to determine the AUC with 95% CI, sensitivity, specificity, PPV, NPV, and F1 score.
Machine learning models were created in the Python environment (version 3.6.2, https://www.python.org/) using the scikit-learn package. BPNN models were constructed using the Keras deep learning framework (version 2.2.4, https://keras.io/) with Tensorflow (version 1.10.0, https://www.tensorflow.org/) used as the backend.
Results
Patient Characteristics
The cohort was composed of 6897 knee/hip arthroplasty (5214 knee arthroplasties and 1683 hip arthroplasties) cases, among which 1161 (16.8%) were positive cases (DVT group) and 5736 (83.2%) were negative cases (No DVT group). Among the 5214 cases of knee arthroplasty, 984 (18.9%) were positive cases and 4230 (81.1%) were negative cases. Among the 1683 cases of hip arthroplasty, 177 (10.5%) were positive cases and 1506 (89.5%) were negative cases. Table 3 shows the epidemiological data of the included patients.
Epidemiological Data of the Included Patients.

Abbreviation: BMI, body mass index.
Data are presented as mean ± standard deviation, unless indicated otherwise.
Cut-off Caprini Score
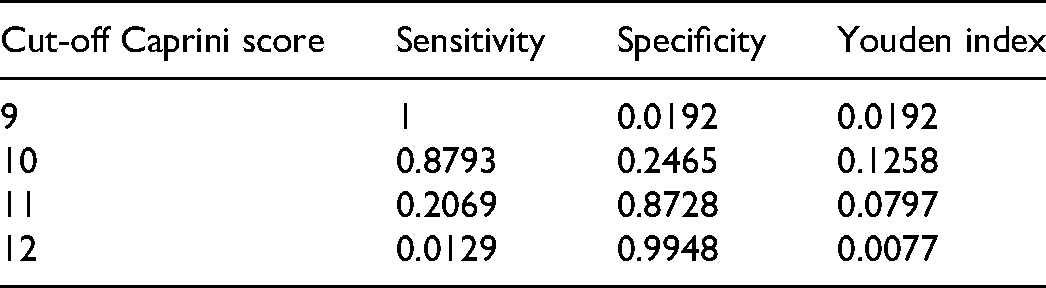
In this experiment, we calculated the sensitivity, specificity and Youden index of different cut-off caprini score based on training dataset. From the following Table 4, we can see that when caprini score was 10 points, the Youden index reached a maximum of 0.1258, with a sensitivity of 0.8793, and a specificity of 0.2465. Therefore, we can get that the cut-off caprini score was 10 points, which means that it is considered that the risk of DVT is very high when then caprini score was greater than or equal to 10.
Sensitivity, Specificity and Youden Index of Different Cut-Off Caprini Score.
Model Prediction Performance
Table 5 shows the comparison of the prediction performance of the various models. Figure 2 is the ROC curve of each model. As shown in Table 5 and Figure 2, all models had an AUC > 0.88, except for the Caprini score, with the highest AUC value of 0.9206 (0.8956, 0.9364) achieved by the Ensembled model.
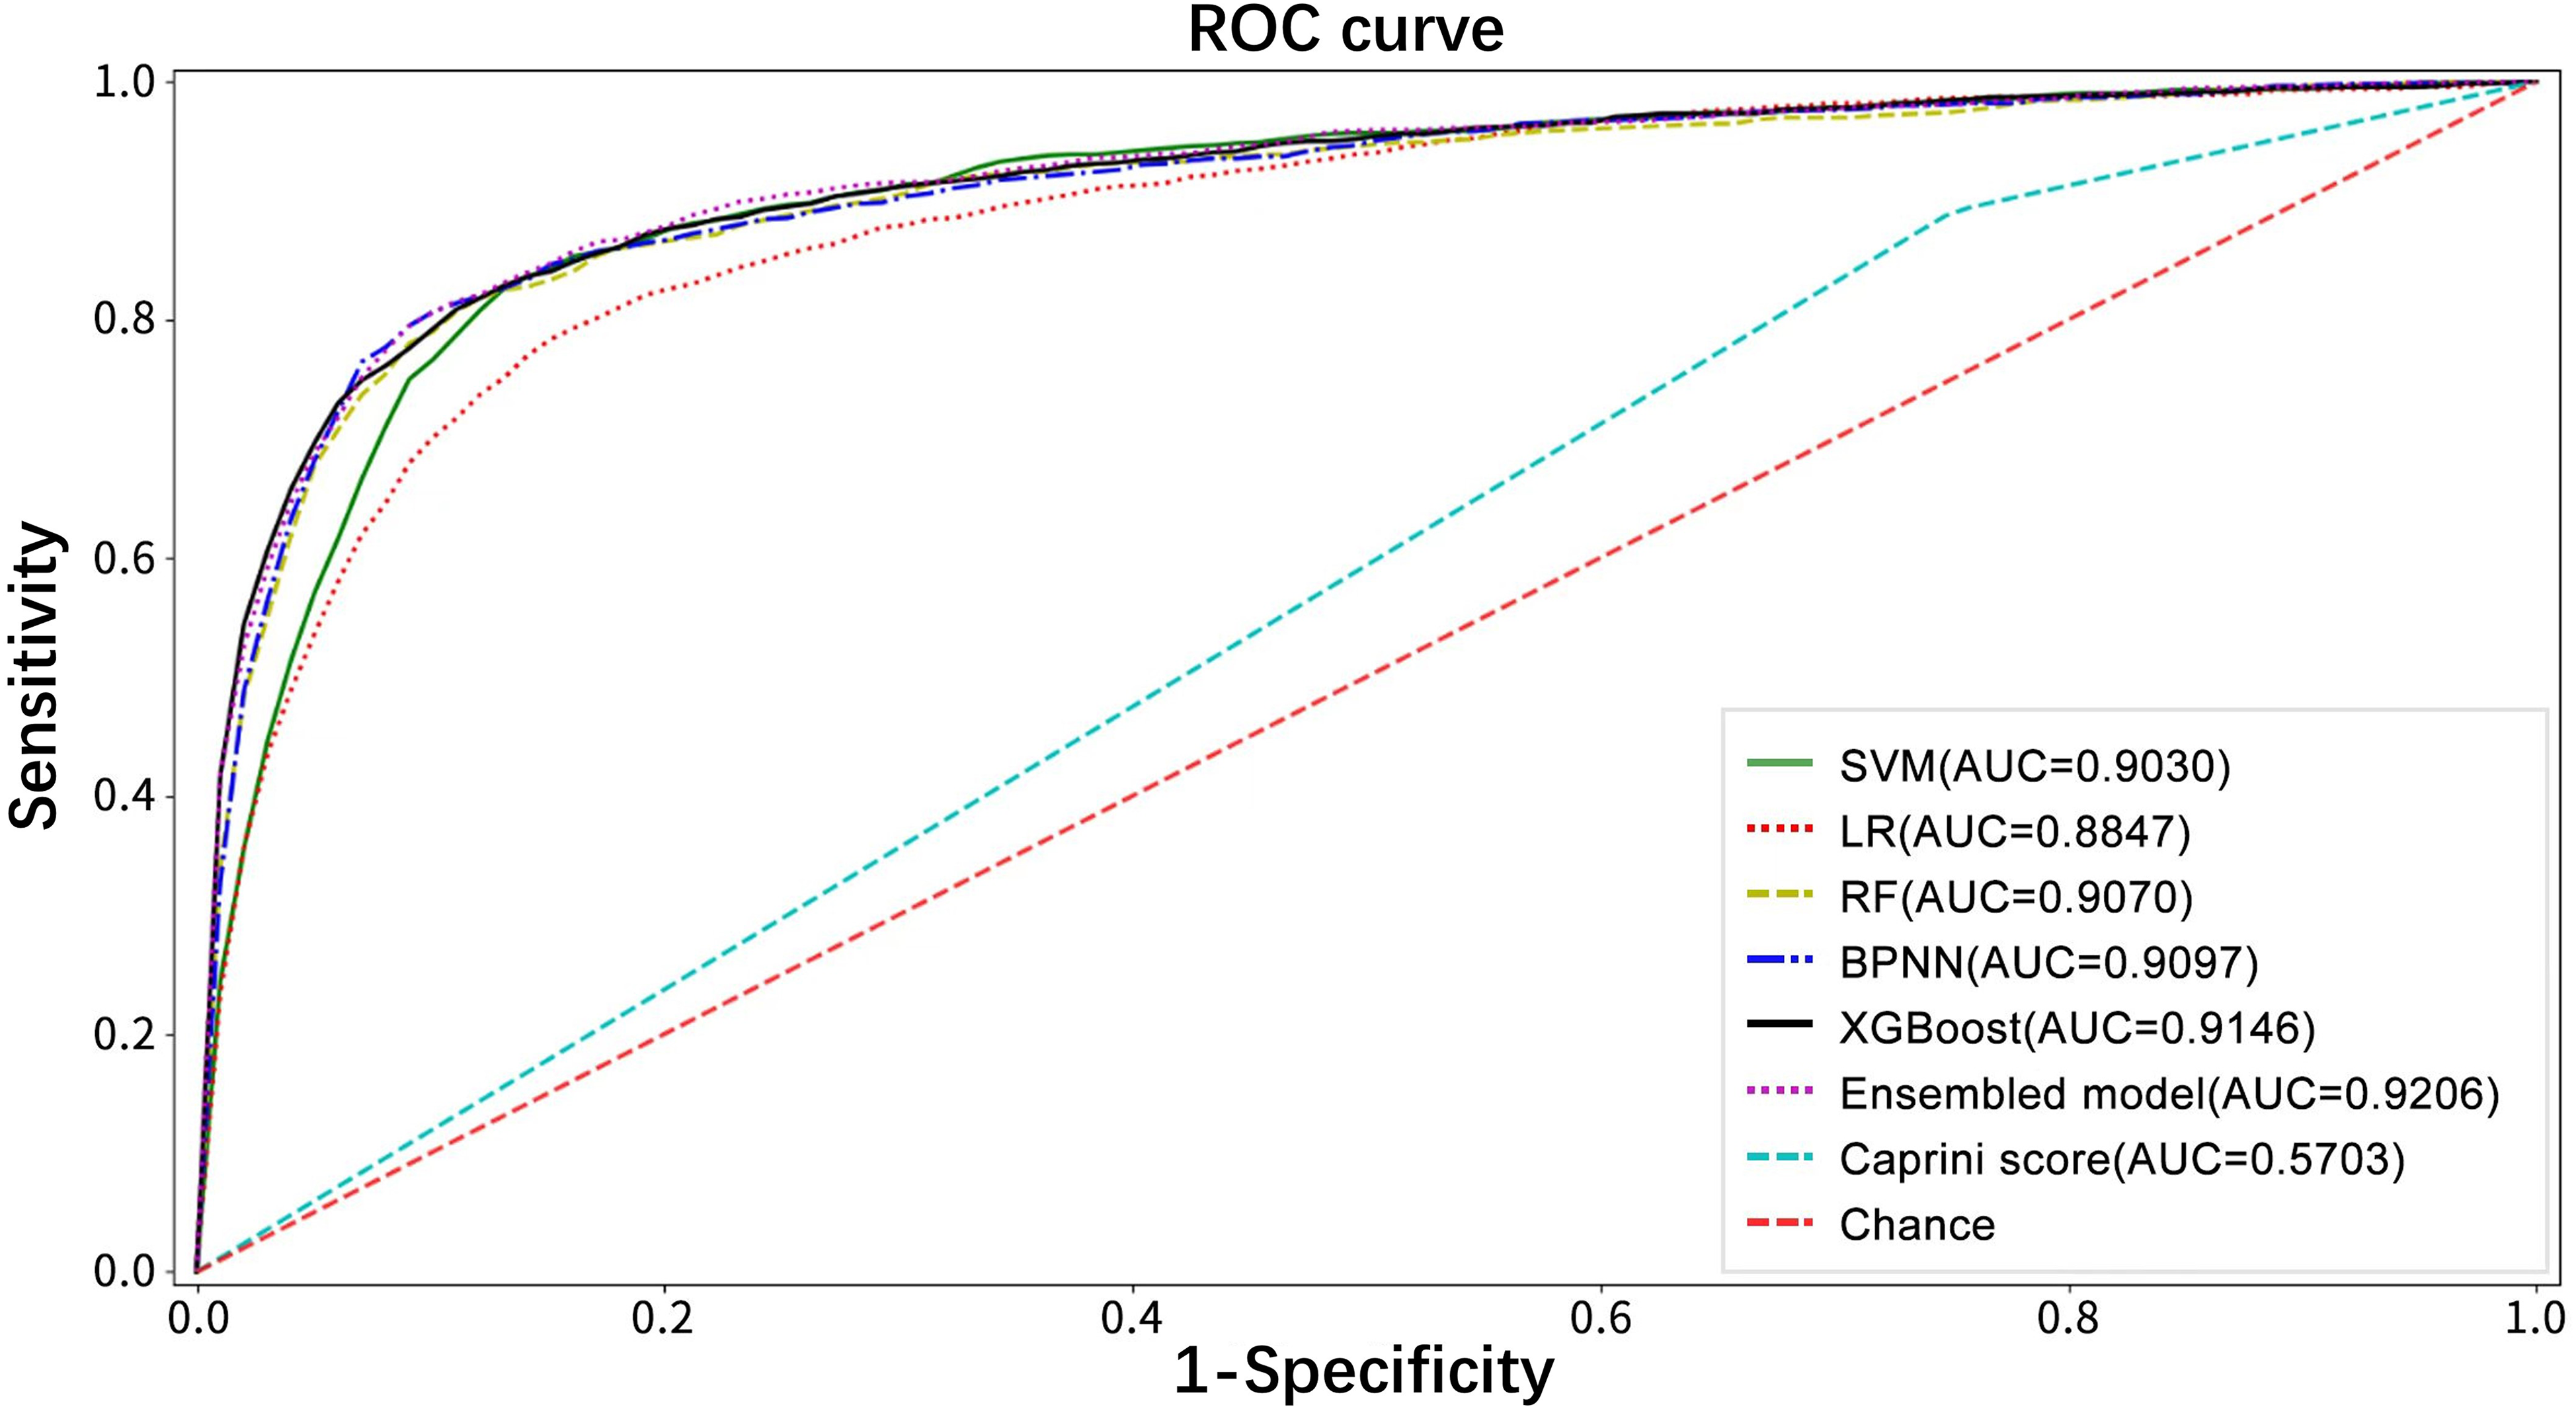
Receiver operating characteristic curves of the six models and Caprini score. Abbreviations: ROC, receiver operating characteristic curve; AUC, area under the receiver operating characteristic curve; SVM, support vector machines; LR, logistic regression; RF, random forest; BPNN, backpropagation neural network; XGBoost, eXtreme gradient boosting.
Comparison of the Prediction Performance of the Six Models and Caprini Score.

Abbreviations: AUC, area under the receiver operating characteristic curve; BPNN, backpropagation neural network; CI, confidence interval; LR, logistic regression; NPV, negative predictive value; PPV, positive predictive value; RF, random forest (RF); SVM, support vector machines; XGBoost, eXtreme gradient boosting (XGBoost).
Sensitivity was the highest for the Caprini score (0.8915), followed by the SVM model (0.8424). All models had a specificity > 0.80, except for the Caprini score, with the BPNN model having the highest specificity (0.9423), followed by the XGBoost model (0.9146). The PPV had the highest for the BPNN model (0.7198), followed by the XGBoost model (0.6452). The NPV had the highest for the SVM model (0.9639), followed by the RF model (0.9578). The F1 score had the highest for the BPNN model (0.7197), followed by the ensemble model (0.7003).
The Caprini score had the lowest AUC (0.5703), with a sensitivity of 0.8915, specificity of 0.2491, PPV of 0.1937, NPV of 0.9191 and F1 score of 0.3183.
Hyperparameters are adjustable parameters that can control the process of model training optimisation. Different hyperparameter values may affect the model training and convergence speed. In this paper, the optimal hyperparameter combination of each model is obtained by adjusting the parameters through GridSearchCV, as shown in Table 6.
The Optimal Hyperparalmeter Combination of Each Model.

Abbreviations: XGBoost, eXtreme gradient boosting (XGBoost); RF, random forest (RF); SVM, support vector machines; LR, logistic regression; BPNN, backpropagation neural network.
Discussion
In this study, we found that machine learning models based on EHRs can predict the risk of DVT after knee/hip arthroplasty, and the prediction accuracy was better than the traditional Caprini score. Besides, high prediction accuracy can be achieved despite the lack of prior knowledge about relevant risk factors by including all variables of the EHRs into model training.
At present, methods commonly used in clinical practice for predicting DVT are measurement scales. A commonly used scale is the Caprini Score for Venous Thromboembolism proposed by Caprini et al 24 in 1991, which was first used in general surgical patients. After several revisions, the Caprini score has been successfully applied for the assessment of the risk of DVT after knee/hip arthroplasty.13,25 However, in an analysis of 376 knee/hip arthroplasties by Bateman et al, 26 no significant difference was observed between the Caprini scores of patients with and without postoperative DVT. Bateman et al 27 had not recognised the importance of the risk of joint arthroplasty, as all patients had been categorised as high risk, with Caprini scores ≥ 5 points. Krauss found that patients with a Caprini score ≥ 10 points had a high risk, with the highest Youden index. In this study, the sensitivity and specificity for diagnosing symptomatic DVT and PTE were 83% and 80%, respectively. 13 In our study, we also found an optimal cut-off Caprini score of 10 points, with the highest Youden index, but the sensitivity and specificity of the Caprini score when using ultrasonography for the diagnosis of DVT in Chinese people was only 89% and 25%, respectively.
With rapid developments in AI technology, risk prediction for diseases such as thrombosis has also entered a new era. 28 Liu et al 14 used machine learning approaches to predict the risk of PICC-related thrombosis in cancer patients and achieved AUC values of 0.78, which was higher than that obtained with the prediction tool developed by Seeley et al Gowd et al 15 adopted machine learning methods to predict postoperative complications after total shoulder arthroplasty in 17 119 patients and achieved a PPV of 0.625, which was substantially higher than that obtained with the American Society of Anaesthesiologists Classification.
The developments and applications of NLP techniques have also provided new opportunities for EHR-based disease prediction. Liang et al 29 used deep learning-based NLP techniques to extract EHR data from 1,362,559 paediatric patient visits to establish a prediction model for the diagnosis of paediatric diseases. The model demonstrated high diagnostic accuracy across multiple organ systems and was comparable to experienced paediatricians in diagnosing common childhood diseases. Kawaler et al 22 used information automatically elicited from EHRs in combination with the genetic data of patients to predict the post-hospitalisation risk of DVT and PTE among 720 patients from different inpatient departments. Their results indicated that the learned models had higher AUC values than the conventional Sanofi 30 and Chicago 31 risk assessment questionnaires and achieved a high prediction accuracy despite the lack of prior knowledge about relevant risk factors.
The EHR system of our hospital was implemented in 2012. Subsequently, EHRs were gradually structured, and non-structured EHRs could be processed using mature NLP techniques. In a previous study, we developed a clinical decision support system (CDSS) by integrating EHRs with the BMJ Best Practice and achieved accuracy rates of 75.46% and 87.53% in the first-rank diagnosis and top-3 diagnosis, respectively. These results demonstrate the huge clinical application potential of CDSSs in EHRs. 17
In our study, all variables of the EHRs from hospital admission to the time of postoperative bilateral lower extremity venous ultrasonography examination were extracted to form the feature dataset. The number of features included in our analysis was much higher than that of conventional risk assessment scales. NLP techniques were applied for the extraction of information from free-text data in the EHRs. First, the text and section contents of different EHRs were distinguished using “free-text class prediction” and “free-text section prediction.” Then, the extraction of information from the free-text data was realised through utilisation of the BiLSTM-CRF approach, a combined network and rule-matching method. Compared with the dictionary matching and regular expression methods, this enabled the extraction of complex logical forms of medical expression and the resolution of issues related to the classification of word attributes, thereby achieving information extraction results with high accuracy. 16 In addition to the commonly used pre-processing methods of feature cleaning and feature selection, we also performed feature concatenation based on section-entity relationships and entity normalisation based on standard names from the BMJ Best Practice and hierarchical relationships to further optimise the feature dataset. This enabled the accurate and comprehensive extraction of information from complex medical records, reduction of the number of redundant features, and further enhancement of model prediction accuracy. In this study, we found that high prediction accuracy can be achieved despite the lack of prior knowledge about relevant risk factors by including all variables of the EHRs into model training.
In the current study, we utilised four machine learning models, namely XGBoost, RF, SVM, and LR, which were combined into an ensemble model to predict the risk of lower extremity DVT. Our results indicated that the ensemble model had the highest AUC and F1 score. Although specificity, sensitivity, PPV, and NPV were not highest among the six models, but they were still indicative of outstanding model performance. This may be attributed to the high tendency of underfitting or overfitting and the presence of sample biases in the prediction results obtained with a single model. Consequently, better prediction was achieved in a certain portion of EHRs, while the prediction performance was poorer for the remaining EHRs. By combining the results of multiple machine learning models, a model with better generalised performance and prediction effects can be obtained. 23 The BPNN model exhibited poorer performance in the various performance metrics as its strong learning ability may not have been fully manifested with the small sample size of the training dataset. Nevertheless, the diagnostic efficiency of the abovementioned models was better than that of the traditional Caprini score.
The use of AI-based methods for predicting the risk of lower extremity DVT after knee/hip arthroplasty has not yet been reported. Through our research, it is evident that EHR-based machine learning models can provide a good prediction for the risk of DVT after knee/hip arthroplasty. Therefore, they are beneficial for the early identification of high-risk populations and subsequent adoption of effective preventive measures. This reduces the risk of postoperative complications, such as PTE. Meanwhile, we could choose to use pharmacologic thromboprophylaxis dose-adjusted based on the invidivual risk factors and the risk of bleeding diatheses. This can accelerate patient recovery and promote the reasonable utilisation of healthcare resources. Additionally, machine learning-based prediction tools can be embedded in CDSSs within EHRs for the realisation of automatic hospitalisation information extraction and real-time early warnings of DVT, which cannot be achieved with conventional risk assessment scales.
This study has certain limitations. First, as the DVT diagnoses at our hospital were based on ultrasonographic findings, diagnostic accuracy was heavily dependent on technician and clinician experience. Ultrasonography also has slightly lower PPV and NPV than venous angiography, but it remains the most used diagnostic method in clinical practice because of its non-invasiveness. 32 Second, patients diagnosed with DVT based on findings of ultrasonography examinations are usually asymptomatic. Although the risk for PTE is relatively low, it is currently one of the most common clinical complications, and diagnosis has a significant impact on determining the appropriate antithrombotic drugs, rehabilitation programmes, etc Third, as the study was conducted with a small sample size, further studies with larger sample sizes will be required to increase diagnostic accuracy. Finally, this study was a retrospective analysis of past clinical data. In our future research work, model accuracy will be further evaluated by performing prospective and real-time predictions of DVT using the CDSS embedded in EHRs.
Conclusion
Machine learning models developed based on EHRs provides a valid tool for predicting the risk of DVT after knee/hip arthroplasty. The diagnostic efficiency of AI-based prediction appeared to be better than the traditional Caprini scoring. Therefore, these EHR-based machine learning models are beneficial for the early identification of high-risk populations and subsequent adoption of effective preventive measures.
Footnotes
Authors’ Note
Xinguang Wang and Hanxu Xi are joint first authors. Hua Tian and Hong Ji are co-corresponding authors. Xinguang Wang, Hanxu Xi, Hong Ji and Hua Tian designed the study. Xinguang Wang, Hanxu Xi, Xiao Geng, Yang Li, Feng Li, Zijiang Li, Minwei Zhao were involved in data collecting and statistical analysis. Xinguang Wang and Hanxu Xi drafted the manuscript. Hong Ji and Hua Tian contributed to critical revision of the manuscript.
Declaration of Conflicting Interests
The author(s) declared no potential conflicts of interest with respect to the research, authorship, and/or publication of this article.
Funding
The author(s) disclosed receipt of the following financial support for the research, authorship, and/or publication of this article: This work was supported by the Natural Science Foundation of Beijing Municipality, (grant number 19L2160).
Ethics Approval and Consent to Participate
This study was approved by the Ethics Committee of Peking University Third Hospital (IRB00006761-M202004).