
Abstract
Thromboelastography (TEG) is used for monitoring abnormal blood coagulation in critically ill patients. However, the correlation between TEG parameters and long-term survival in these patients is unknown. We aimed to quantify the effect of TEG on long-term survival of critically ill patients. Critically ill patients undergoing TEG were retrospectively examined. Baseline patient characteristics and coagulation function indexes were compared. Cox regression, receiver–operating characteristic curve analysis, and Kaplan-Meier survival estimate curve were performed. We included 167 critically ill patients. Clot formation speed (K) and reaction time (R) were higher, whereas maximum amplitude (MA) and angle were lower in the mortality group than in the survival group (P < .01). All TEG parameters were risk factors for 2-year survival in critically ill patients (P < .01). The area under the curve of MA for predicting 2-year survival was 0.756 (95% confidence interval: 0.670-0.841). The Kaplan-Meier survival estimate curve analysis showed that MA predicted 2-year survival of critically ill patients(P < .01). Maximum amplitude can effectively predict 2-year survival of critically ill patients, indicating the influence of the coagulation system on these patients.
Introduction
With the progress of aging and the increasing number of critically ill patients in society, the attention on quality of life and long-term survival has increased. 1 –3 Sepsis and septic encephalopathy are important causes of critical illness. 4,5 Sepsis, which causes millions of deaths every year worldwide, is defined as life-threatening organ dysfunction caused by a dysregulated host response to infection. 6 Hemostatic abnormalities, which occur in 50% to 70% of patients with sepsis, may lead to disseminated intravascular coagulation (DIC) and result in microvascular thrombosis, hypoperfusion, multiple organ disfunction syndrome, and death. 7 –9
Traditional coagulation tests such as activated partial thromboplastin time (APTT), prothrombin time (PT), international normalized ratio, and measurement of platelet counts, plasma fibrinogen levels, and
Thromboelastography (TEG), a new method for measurement of hemostatic abnormalities, has induced widespread interest. Thromboelastography was introduced by Hartert in 1948 and is capable of measuring the viscoelastic properties of hemostasis. Thromboelastography evaluates initiation of clot formation, the kinetics of clot build up and firmness, and subsequent fibrinolysis. In recent years, TEG has already been used to evaluate characteristics of hemostatic disturbances in critically ill patients with sepsis, 9,10 trauma, 11,12 and cardiac surgery. 13
To date, studies have confirmed that coagulation disorders are associated with the severity of sepsis 9 and are risk factors for 28-day mortality in sepsis. 14 However, it is still unknown whether coagulation abnormalities affect the long-term survival of critically ill patients. Thus, we designed this study to assess whether coagulation disorders measured by TEG were associated with 2-year survival of critically ill patients.
Method
Study Design and Patients
We conducted a retrospective study that included all consecutive patients who underwent TEG in Nanfang Hospital, Guangzhou Province, China, from January 2016 to December 2016. Patients aged ≥18 years who met the definition of critically ill patients and had undergone TEG were included in the cohort. The exclusion criteria included unavailability of clinical data and patient’s refusal for providing information. Critically ill patients were defined as those with combined organ dysfunction or as long-term bedridden patients (time in bed >1 month). We interviewed the patient or the patient’s family member via phone to enquire about the patient’s status 2 years later and to obtain consent. This study was performed in accordance with the ethical standards of the Helsinki Declaration.
Clinical Data and Thromboelastography
Clinical data were retrospectively recorded for each patient using a standardized form. The form included questions for the following information: ID, gender, age, date and results of TEG, diagnosis, blood biochemical test results, and infection parameters (white blood cell count, procalcitonin level, and C-reactive protein level), organ failure and disease severity scores (Sepsis-related Organ Failure Assessment [SOFA] score), Acute Physiology and Chronic Health Evaluation (APACHE) II score, and DIC score. The TEG examination was prescribed by the clinician according to the condition of the illness. The timing of all other parameters was no more than 24 hours from the timing of the TEG examination. Follow-up data included the date and cause of death censored at 2 years. The recorded TEG variables included reaction time (R), clot formation speed (K), angle (A), and maximum amplitude (MA). All patients were classified into 2 groups: the survival group and mortality group based on 2-year survival. Baseline patient characteristics and coagulation function indexes were compared. Sepsis was defined according to the sepsis 3.0 definition 6 .
Statistical Analysis
Continuous variables were presented as median (25th-75th percentiles) or mean (±standard error) and compared as appropriate. Categorical variables were presented as number with percentages (95% confidence interval [CI]) and compared as appropriate. The factors associated with 2-year mortality were determined using Cox regression analyses, performed within the whole patient cohort. The value of TEG parameters in evaluating the prognoses of critically ill patients was analyzed using receiver–operating characteristic (ROC) curve analysis and the Kaplan-Meier survival estimate curve analysis. The analyses were performed using the SPSS Base 19.0 statistical software package (SPSS Inc, Chicago, Illinois).
Result
Clinical Baseline Data
We enrolled 167 patients, of which 98 were male and 69 were female. Patient age ranged from 18 to 93 years, and the average age was 53.5 years. Of the 167 patients, 84 had sepsis. Clinical baseline data are shown in Table 1.
Clinical Baseline Characteristics.a

a Percentage = (item cases)/(total cases) ×100%.
Comparison of Clinical Indicators Between Survival Group and Mortality Group
The patients were significantly aged in the mortality group (P < .01). In comparation with the survival group, inflammatory markers such as white blood cell count and neutrophil percentage, SOFA score, and APACHE II score were significantly higher (P < .01). Platelet was significantly lower in the mortality group compared to the survival group (P < .01). Comparison of clinical indicators between the 2 groups is shown in Table 2.
Clinical Indicators Between the Survival Group and the Mortality Group.
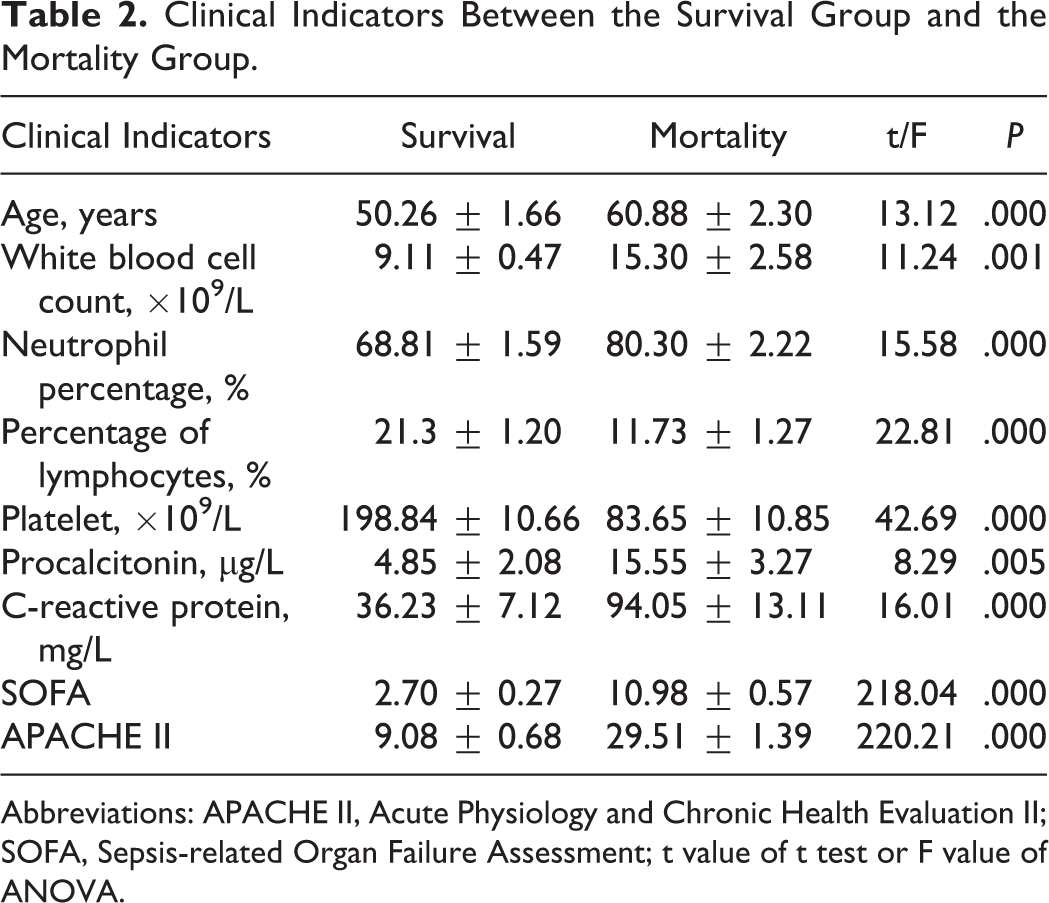
Abbreviations: APACHE II, Acute Physiology and Chronic Health Evaluation II; SOFA, Sepsis-related Organ Failure Assessment; t value of t test or F value of ANOVA.
Comparison of Coagulation Function Indexes Between Survival Group and Mortality Group
Compared to that in survival group, PT and APTT were significantly prolonged in the mortality group (P < .05), Fibrinogen was significantly lower in the mortality group (P < .05). In the mortality group, R and K was higher, MA and angle were lower, and the difference was statistically significant (P < .01). In the mortality group, DIC score was significantly higher (P < .01). Comparison of coagulation function indexes between the 2 groups is shown in Table 3.
Comparison of Coagulation Function Indexes Between the Survival Group and the Mortality Group.

Abbreviations: APTT, activated partial thromboplastin time; DIC, disseminated intravascular coagulation; FIB, Fibrinogen; K, clot formation speed; MA, maximum amplitude; PT, prothrombin time; R, reaction time; t value of t test or F value of ANOVA.
Analysis of Risk Factors Affecting 2-Year Survival in Critically Ill Patients
Cox regression analysis of factors that may affect 2-year survival in critically ill patients showed that R, K, Angle, and MA were risk factors for 2-year survival in critically ill patients (P < .01). The results of COX regression are shown in Table 4.
The Results of Cox Regression.

Abbreviations: APACHE II, Acute Physiology and Chronic Health Evaluation II; DIC, disseminated intravascular coagulation; K, clot formation speed; MA, maximum amplitude; R, reaction time; SE, standard error; SOFA, Sepsis-related Organ Failure Assessment.
Receiver–Operating Characteristic Curve Analysis of Angle and MA for Predicting 2-Year Survival of Critically Ill Patients
The area under the curve of angle and MA for predicting 2-year survival of critically ill patients was 0.791 and 0.756 (95% CI: 0.716-0.866 and 0.670-0.841), respectively; the diagnostic threshold was 53.25 and 54.2, respectively. The diagnostic sensitivity for angle was 81.0%, specificity was 66.7%, and approximate index was 0.477 (Figure 1). The diagnostic sensitivity for MA was 74.1%, specificity was 72.5%, and approximate index was 0.467 (Figure 2). Both R and K didn’t predict 2-year survival of critically ill patients.

Angle predicts 2-year survival of critically ill patients.

Maximum amplitude (MA) predicts 2-year survival of critically ill patients.
The Kaplan-Meier Survival Estimate Curve Analysis of Angle and MA for Predicting 2-Year Survival of Critically Ill Patients
Of 51 death cases in 2 years, 11 patients died of multiple organ failure, 20 patients died of infection, 8 patients died of cardiac failure, 4 patients died of hemorrhagic shock, and 8 patients died of unknown causes. The Kaplan-Meier survival estimate curve analysis showed that MA predicted 2-year survival of critically ill patients and the difference was significant (P < .01), while the difference between 2 curves of angle wasn’t significant (P > .05). The Kaplan-Meier survival estimate curve for MA is shown in Figure 3.
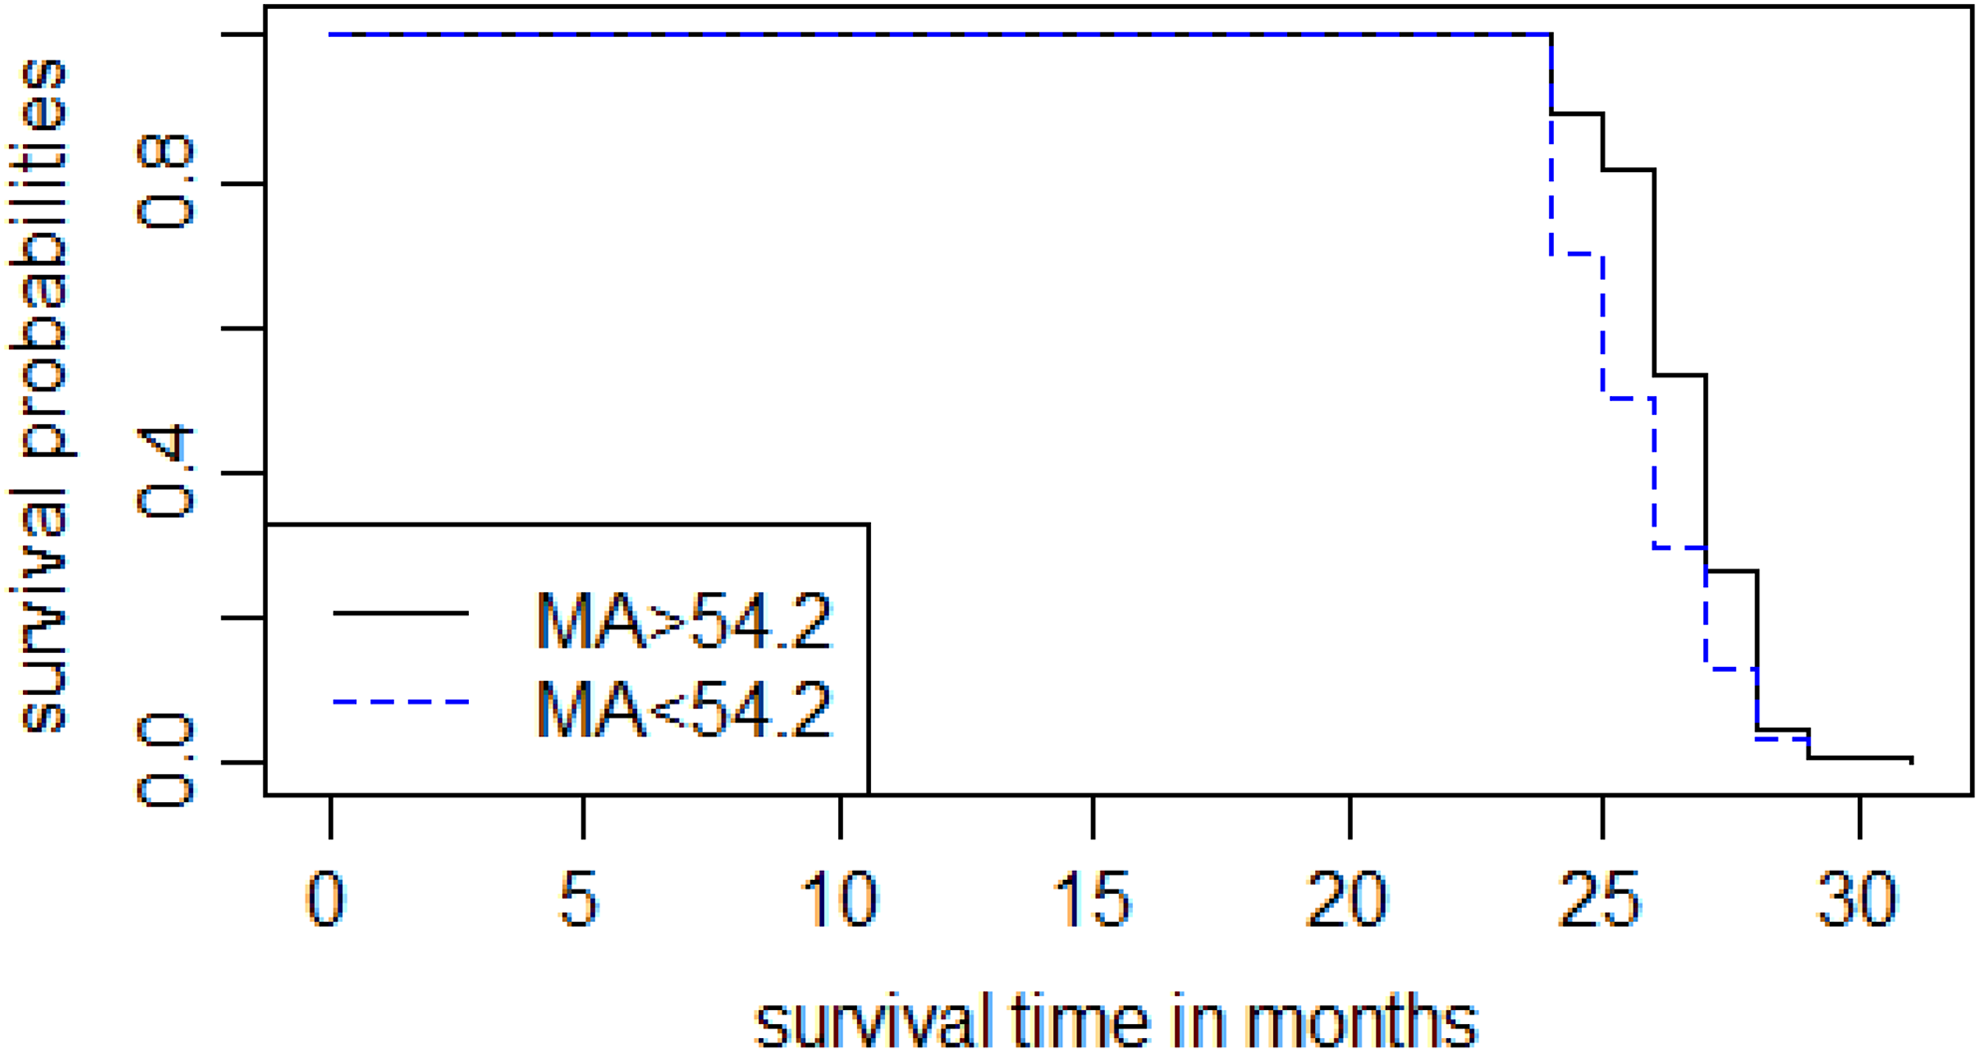
The Kaplan-Meier survival estimate curve for maximum amplitude (MA).
Discussion
The results of our study showed that mortality patients were more prone to abnormal blood coagulation than survival patients, regardless of using TEG or traditional methods. Coagulopathy measured by TEG is one of the hallmarks of sepsis severity, which is consistent with the existing literature. 9 We have found that MA can effectively predict 2-year survival of critically ill patients, suggesting that the coagulation system plays an important role in the prognosis of critically ill patients.
In recent years, increasing attention has been paid to long-term complications and mortality in critically ill patients, mainly those with encephalopathy and disability. 4,15 Abnormal coagulation function is a common manifestation in critically ill patients. 16 Studies have found that microcirculatory disorders caused by low inflammatory response and abnormal blood coagulation are important causes of encephalopathy, including septic encephalopathy. 17,18 Thromboelastography is a novel indicator of coagulation function that provides a more comprehensive picture of coagulation and fibrinolysis than traditional coagulation monitoring. 19,20 We still know very little about the relationship between TEG and long-term survival in critically ill patients. Therefore, we aimed to investigate whether TEG indexes might predict long-term survival in critically ill patients.
In this study, we found that the mortality group had higher inflammatory markers and more severe organ dysfunction. Meanwhile, coagulation system function was more abnormal in the mortality group. Our findings were consistent with the results of previous studies. 16 Maximum amplitude was significantly lower in the mortality group than in the survival group. These results suggest that abnormal MA has a certain reference value for predicting 2-year mortality of patients.
Cox regression analysis showed that all TEG parameters were risk factors for 2-year survival in critically ill patients. To further analyze the risk of 2-year survival associated with MA in critically ill patients, we performed ROC curve analysis and found that the area of MA under the curve for predicting critically ill patients was 0.756. Both diagnostic sensitivity and specificity were high. Interestingly, the Kaplan-Meier survival estimate curve analysis only found that MA predicted 2-year survival in critically ill patients. This indicates that MA has a high reference value for predicting 2-year survival in critically ill patients. Previous studies have shown that thrombocytopenia is an independent predictor of 28-day mortality in sepsis patients. 14 However, few studies have investigated the factors influencing long-term survival of critically ill patients.
Our study found that MA had good predictive value for 2-year survival rate, with high sensitivity and specificity. Maximum amplitude has been known to respond to platelet function. Platelets play a dual role of coagulation cells and immune cells. Platelets play the role of immune cells by sensing external danger signals, 21 interacting with the complement system 22 and neutrophils. 23 This may be an important reason why MA can predict long-term survival.
Our study has several limitations. First, our sample size was small, which may cause statistical errors. Second, we obtained information about patients’ 2-year survival via telephone interviews, which may lead to some errors in assessing the actual situation.
In summary, MA has good clinical value for predicting 2-year survival in critically ill patients. This suggests that coagulation disorders are an important aspect of long-term mortality in critically ill patients. Regular testing of coagulation status may be beneficial for improving long-term survival in critically ill patients. In the future, in-depth analysis and research involving relevant sample sizes will help provide a reference for clinical diagnosis and for predicting the prognoses of critically ill patients.
Footnotes
Authors’ Note
Bingjie Zhuang was joint first author. Our institution does not require ethical approval for reporting individual cases or case series. Verbal informed consent was obtained from the patient or the patient’s family member for their anonymized information to be published in this article.
Declaration of Conflicting Interests
The author(s) declared no potential conflicts of interest with respect to the research, authorship, and/or publication of this article.
Funding
The author(s) received no financial support for the research, authorship, and/or publication of this article.