
Abstract
Hyperbaric and decompression stress from diving impairs blood coagulation and fibrinolysis. We hypothesized that thromboelastography (TEG) and rotational thromboelastometry (ROTEM) were suitable to characterize the effects of stress on global hemostatic profiles. We thus conducted a comparative study of the hyperbaric effects on human coagulation using TEG and ROTEM. Maximum clot strength (maximum amplitude [MA]) and clot lysis (lysis index at time 30 minutes [LI30]) were reduced as indicated by TEG MA and EXTEM LI30, respectively. The relative changes in coagulation and fibrinolysis by the hyperbaric effects of diving were indicated by reduced TEG reaction time R at 5 hours, MA at 24 hours postdive, and reduced EXTEM coagulation time at 15 minutes postdive as well as decreased fibrinolysis (EXTEM LI30) at all postdiving time points investigated. Comparison of the parameter values and the diving-induced changes in each parameter between TEG and ROTEM showed both differences and correlations. The discrepancies between the 2 systems may be due to the different assay reagents used. Future studies will seek to further elucidate the changes in blood coagulation and fibrinolysis following varying levels of hyperbaric and decompression stress.
Introduction
Decompression illness (DCI) following recreational and professional diving has been well documented. 1,2 Increased partial pressure of gases due to increased hydrostatic pressure from human diving resulted in the development of venous gas emboli (VGE) at reduced ambient pressures on the surface following the dive. Alterations of the blood coagulation system following diving may be one of many factors that may contribute to DCI onset as a result of VGE (decompression stress). 3 These alterations include, a reduction in the number of circulating platelets, activation and aggregation of platelets, 4 decreased concentrations of hemostasis markers, such as coagulation factor I (fibrinogen), X, XII, plasminogen activator inhibitor 1, and elevated concentrations of plasmin–antiplasmin complex. 5,6 These changes may also exert mutually opposed effects on blood extrinsic and intrinsic coagulation pathways and fibrinolysis pathways. As a result, the clinical implication of the altered coagulation system may be either bleeding risk or thrombosis. In contrast, other studies showed no changes in the concentration and activity of hemostasis markers, such as thrombin activatable fibrinolysis inhibitor. 7
Previous diving studies examining the effects of decompression stress tended to focus on different parts of the coagulation system, such as platelet counts and functions. Little information exists about the interactions between the different coagulation and fibrinolytic pathways, clotting cascades, and platelets in whole blood. As a result, it is difficult to relate the findings from those earlier studies to the global effects on whole blood in the clinical setting.
Thromboelastography (TEG) is a global measure of blood coagulation that quantitatively measures the elasticity of the clot, from the beginning of coagulation to end point of fibrinolysis. This includes the progress of clot formation from its onset, maximum clot strength, and clot stability, which provides important information about coagulation, fibrinolysis, and platelet functions. 8 –10 It provides additional information compared to the standard laboratory tests (eg, prothrombin time and thrombin clotting time), which focus only on the initiation of the coagulation cascade. 11 Recent studies have shown that TEG is a better indicator of coagulation abnormalities and transfusion requirements as compared to activated partial thromboplastin time. 12 Moreover, specific evaluation of a particular coagulation process can also be illustrated by modified TEG methods using partial blood components, for example, plasma or coagulation factor–deficient blood. 13 However, its use as a research tool for evaluating the effects of diving on coagulation and fibrinolytic system has not been widely recognized.
In a TEG system, a cup containing a small amount of blood (≤360 μL) oscillates through an arc of 4.75° every 5 seconds and a pin on a torsion wire is suspended in the blood. As coagulation proceeds, the pin is deflected by the torque pressure of the viscoelastic properties of blood and more rotation is detected by an electromagnetic transducer. The pin/wire transduction methodology provides a tracing representative of clot formation, strength, and breakdown by fibrinolysis. 13 Similar to TEG, rotational thromboelastometry (ROTEM) has also been used as a global measure of blood coagulation and fibrinolysis in various research and clinical settings. 14 It records the viscoelastic changes that occur during the whole coagulation process, but the primary hardware difference from TEG is that ROTEM has an immobile cup, wherein the pin slowly oscillates through an arc of 4.75°. In addition, each ROTEM system has 4 channels and a built-in computer to operate as opposed to 2 channels in the TEG system that requires a separate computer to operate. It is argued that the ROTEM system uses a ball-bearing system for power transduction, which makes it less susceptible to movement and vibration. 15 Different assay reagents were used for each system. Studies have showed that the 2 tests provided different results for diagnosing coagulopathy and guiding transfusion. 16 On the other hand, some comparative studies indicated certain similarities in the results provided by the 2 systems depending on the measurement parameters, 17,18 activation reagents, 19 specific assays, 20,21 and study population. 22,23
The objectives of this study were to understand the effects of exposure to decompression stress on blood coagulation and fibrinolysis in trained divers using both TEG and ROTEM methods as global measures of hemostasis and compare the results obtained by the 2 methods.
Materials and Methods
Participants
Following approval by the Human Research Ethics Committee of Defence Research and Development Canada Toronto, 7 naval trained male divers between the ages of 18 and 50 years were recruited and written informed consent was obtained. Respective mean ± SD values for age and weight were 41 ± 7 years and 86.8 ± 5.6 kg.
Hyperbaric and decompression stress
The divers were pressurized (182.34 kPa·min−1) to 557.15 kPa for 20 minutes while breathing air in the dry living chamber of the decompression research facility followed by air decompression using Canadian Forces Dive Table. 24
Blood Sampling
Whole-blood samples were withdrawn from the antecubital vein into Vacutainers (Fisher Scientific, Nepean, Ontario) containing 0.109 mol/L sodium citrate solution (citrate–blood volume = 1:9) 30 minutes before the dive (pre) and (post) 15 minutes; 75 minutes, 5 hours, and 24 hours following decompression to the surface; and gently inverted 3 times. All blood samples were analyzed within 4 hours after the collection, which has been documented to yield stable results for both TEG 25 and ROTEM. 26
Principles of TEG and ROTEM
Figure 1a shows the TEG 5000 hemostasis analyzer (Haemonetics Corporation, Haemoscope Division, Niles, Illinois) and schematic principles of TEG 2-channel measurement of the viscoelastic properties of blood as it clots under low shear stress. For each channel, a pin suspended by a torsion wire is immersed in 360 μL whole blood or plasma in a plastic cup made of acrylic polymer with a smooth interior surface. The cup transversely oscillates back and forth through an arc of 4.75° every 5 seconds, while the pin is deflected by the torque pressure of the viscoelastic properties of blood during modifications of fibrin strands and platelet aggregates as coagulation proceeds. Torque pressure is transmitted to the torsion wire, which is converted by a mechanical–electrical transducer to an electrical signal monitored by computer. 9 Figure 1b shows the ROTEM delta system (Tem Innovations GmbH, Munich, Germany) and schematic principles of ROTEM 4-channel measurement of the viscoelastic properties of blood as it clots under low shear stress. For each channel, a pin suspended on a ball-bearing mechanism transversely oscillates back and forth through 4.75° every 6 seconds with a constant force in a fixed cup made of polymethylmethacrylate with a ridged interior surface into which a 340-μL sample of whole blood is electronically pipetted. As the blood clots, the impedance to pin rotation is transmitted via an optical detector system and recorded by computer. 14 The measurement of both instruments is graphically represented as a characteristic shape profile over time (Figure 1c), from which the following parameters can be derived for TEG: (1) reaction time R, which is related to plasma clotting factors and circulating inhibitory activity; (2) kinetics time K, which is associated with the activity of the clotting factors, fibrinogen, and platelets; (3) the rate of clot polymerization, α angle, which is a main function of platelets, fibrinogen, and plasma components residing on the platelet surface; (4) maximum amplitude or maximum clot strength, MA, which is a direct function of the maximum dynamic properties of fibrin and platelet number and functions; and (5) fibrinolysis at 30 minutes or the rate of amplitude reduction 30 minutes after MA, percent lysis at 30 minutes (LY30) and clot lysis index at 30 minutes (CL30), which is related to plasma levels and activities of tissue plasminogen activator. Parameters similar to TEG as shown in Figure 1c; eg, coagulation time [CT], clot formation time [CFT], α angle, maximum clot firmness [MCF], clot lysis index LI30) can be derived from ROTEM, which are commonly used in Europe. 27
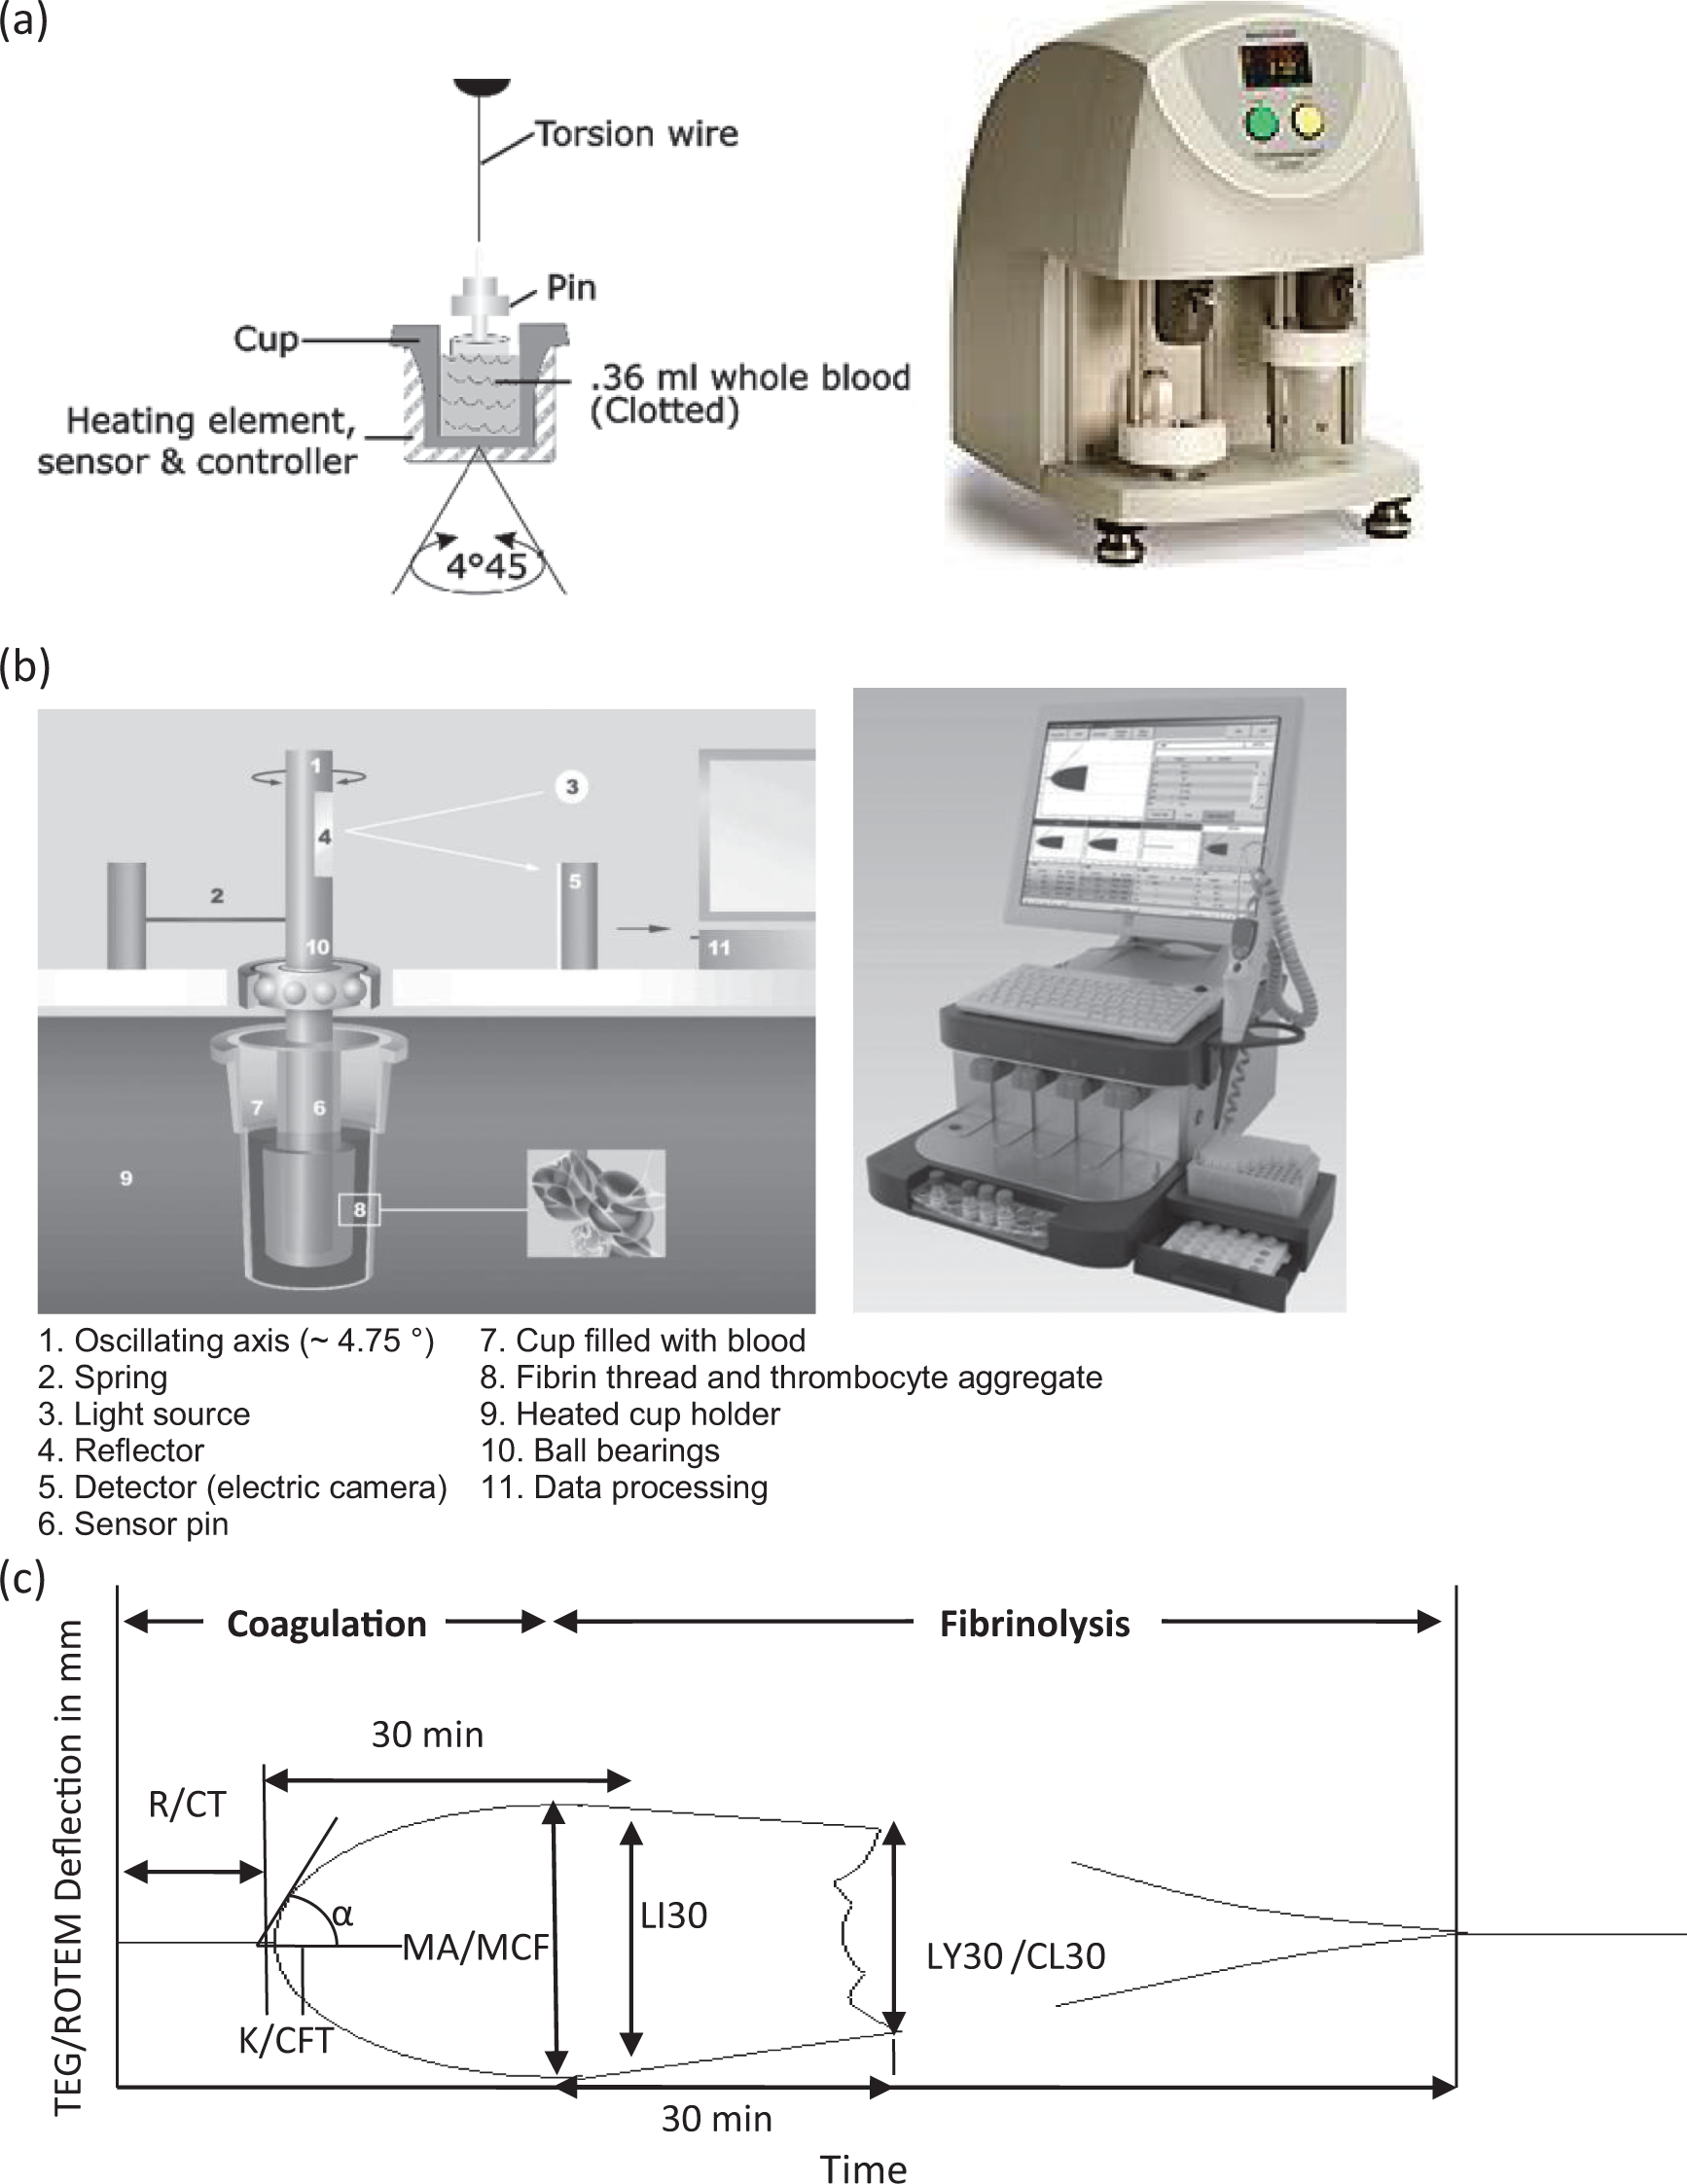
Schematic illustration of (a) thromboelastography (TEG) mechanism and machine, (b) rotational thromboelastometry (ROTEM) mechanism and machine, and (c) a representative TEG/ROTEM tracing showing the relationship between the qualitative tracing and the quantitative parameters. Courtesy of Haemonetics Corporation and TEM Systems, Inc.
Thromboelastography Analysis
Thromboelastographic measurements were carried out using a computerized TEG Hemostasis System 5000 (Haemoscope Corporation). After system calibration according to manufacturer’s protocol, 1 mL of citrated blood was transferred to a vial containing buffered stabilizers and Kaolin (Haemoscope Corporation) and gently mixed by inversion 5 times. Measurement of R, K, α, MA, and LY30/CL30 was carried out on a 340-μL aliquot in a disposable cup prewarmed to 37°C containing 20 μL of 0.2 mol/L calcium chloride.
Rotational Thromboelastometry Analysis
Citrated whole blood was analyzed using the ROTEM delta system and reagents (Tem Innovations GmbH, Munich, Germany). Instrument quality control was periodically carried out using ROTROL N and ROTROL P. A 300-μL citrated blood sample was added and mixed by pipetting into an ROTEM cup prewarmed to 37°C containing 20 μL of CaCl2 (star-tem, Tem Innovations GmbH, Munich, Germany) and 20 μL of partial thromboplastin phospholipid and ellagic acid activator (in-tem, Tem Innovations GmbH, Munich, Germany). Measurement of CT, CFT, α, MCF, and LI30, designated INTEM, was carried out simultaneously with measurement of the extrinsic coagulation pathway in another prewarmed ROTEM cup containing 20 μL of star-tem, 20 μL of recombinant tissue factor and phospholipids, designated EXTEM.
Statistical Analysis
Results are presented as mean ± standard deviation (SD). The data were analyzed using 1-way repeated measures analysis of variance (ANOVA), with pre- and postdiving sessions as the factor and significant differences were analyzed using post hoc pairwise Bonferroni procedures.
Calculation of percentage difference between post- and presamples in individuals was used to account for intrinsic differences in different divers and inherent extraneous factors during coagulation and fibrinolysis measurements. As a result, each individual acted as his or her own control. The +/− symbol was used to denote either positive or negative effects on blood coagulation. For example, negative changes in R and positive changes in MA indicate an enhancement of clot formation and strength. The magnitude suggests the extent of the effects.
One-sample t test was used to examine the significance of changes, and paired t test was used to compare the means of the corresponding parameters and their diving-induced percentage changes between TEG and ROTEM. The data from all participants at each time point were pooled together for correlation analysis between TEM and ROTEM measurements using Pearson method. The data were also analyzed for correlations between TEG and ROTEM at specific sampling time points. Cohen criteria were used for the strength of the correlations: r = .1 to 0.3 (low), r = .3 to 0.5 (moderate), and r = .5 to 1.0 (high). IBM SPSS Statistics 20 was used to perform all statistical analyses (P < .05).
Results
Seven participants were recruited and completed the study. Figure 2 shows the TEG tracings of an individual diver predive, 15 minutes, 75 minutes, 5 hours, and 24 hours after diving. It indicates that the diving stress led to an earlier onset of clot formation (ie, R time) at 75 minutes and 5 hours postdive. The hypercoagulable state was continuous until 5 hours after the dive and returned to the prediving state at 24-hour postdive with a slightly longer R and smaller MA.
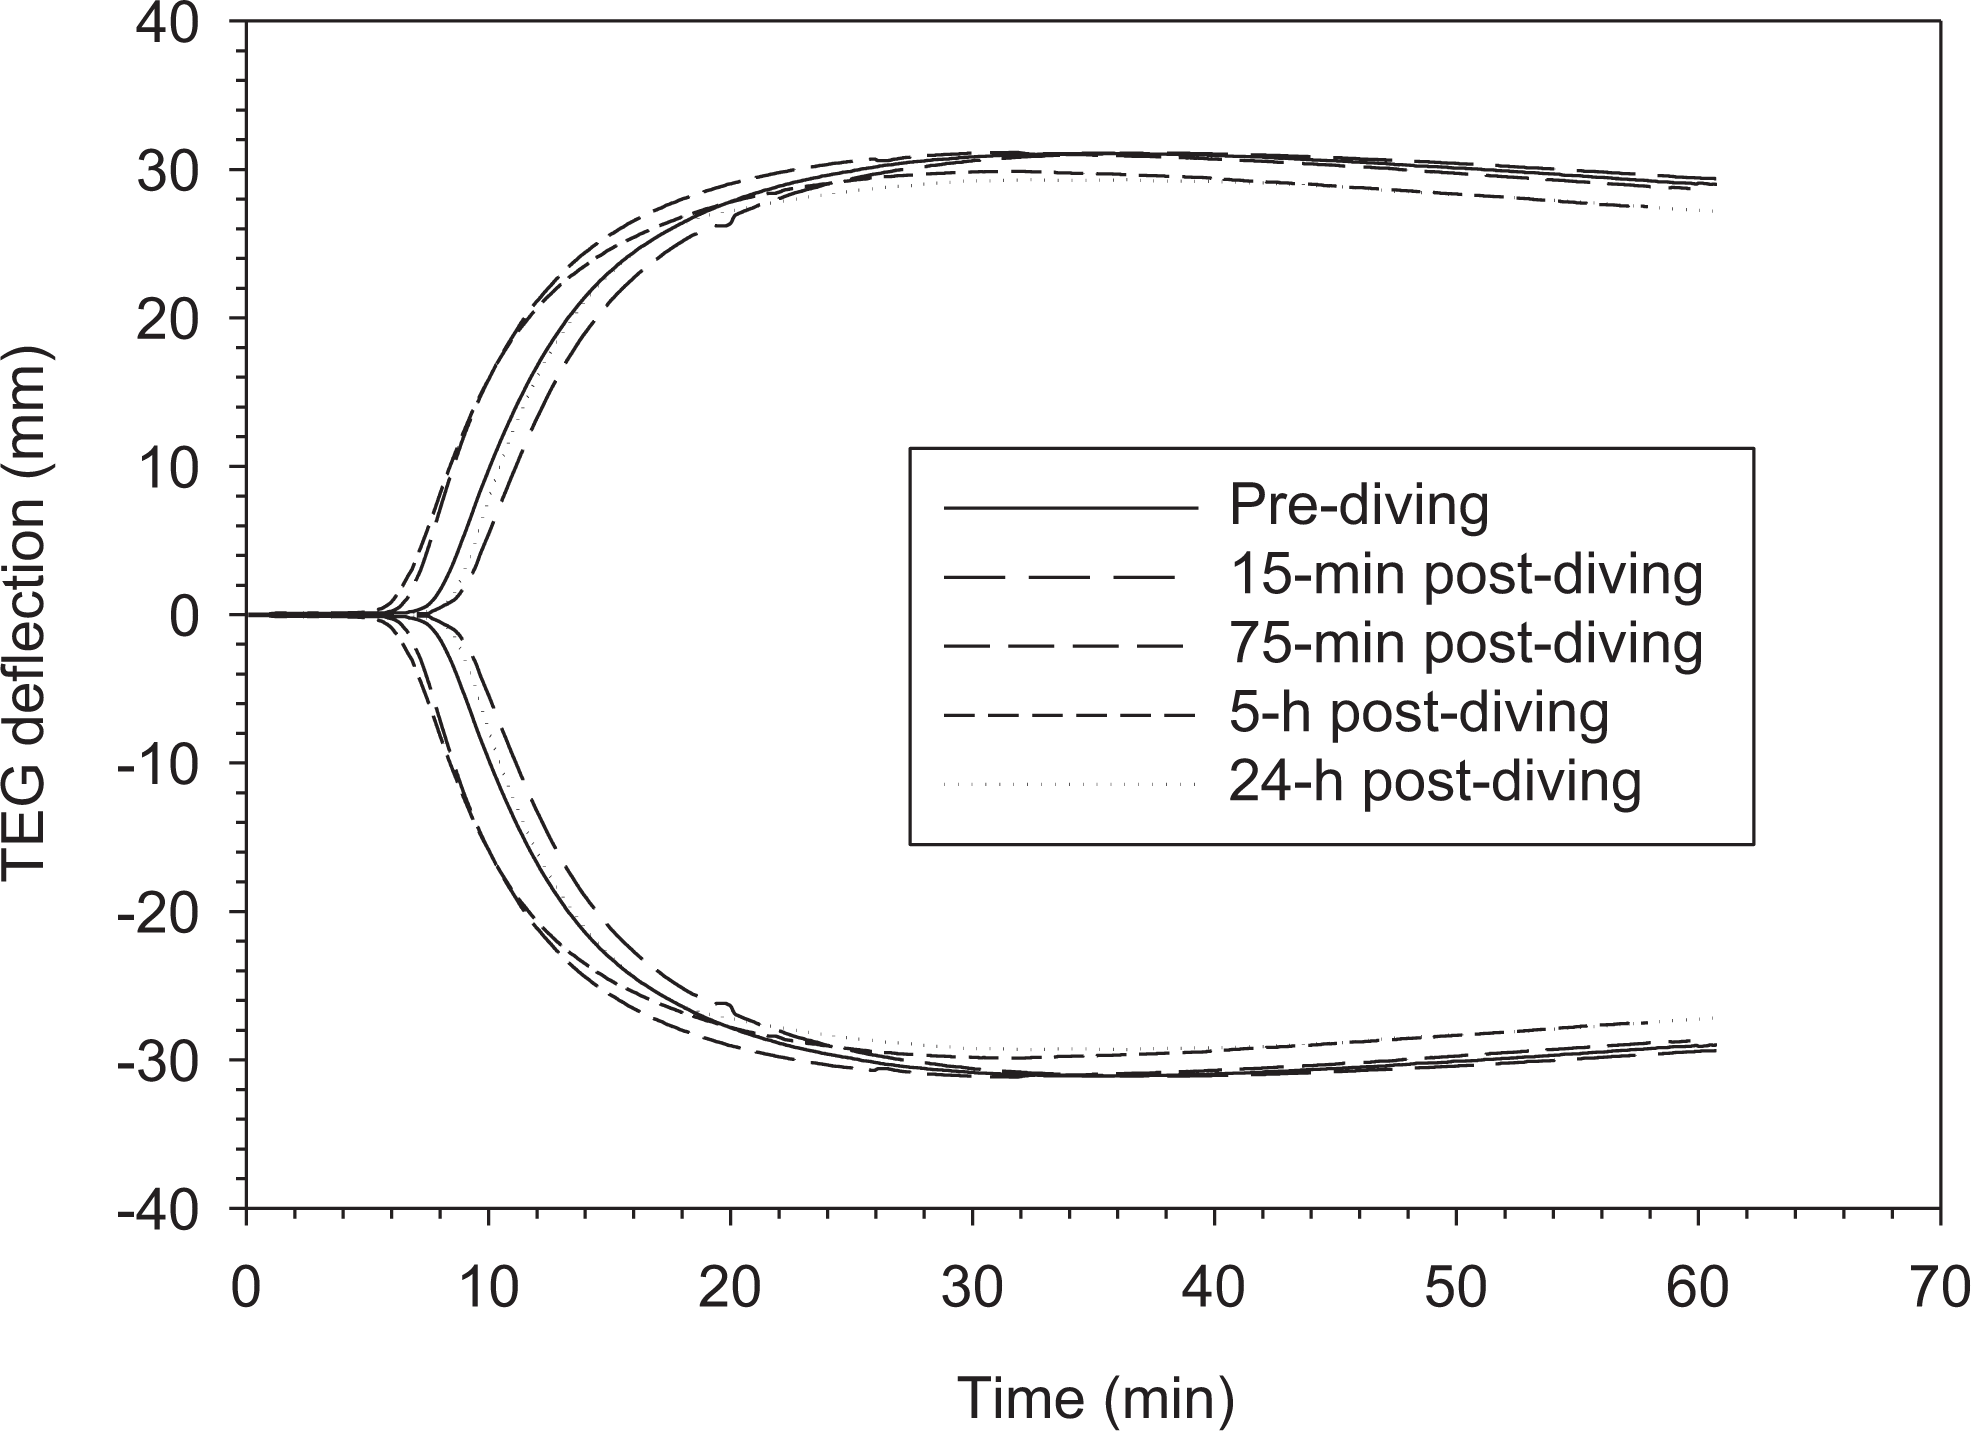
Thromboelastography tracings of whole blood from the same diver before and after diving.
Table 1 summarizes the key parameter values for both TEG and ROTEM at pre- and postdive until 24 hours following the dive. There were no significant changes in coagulation and fibrinolysis before and after the diving as measured by absolute values of both TEG and ROTEM parameters except for TEG MA and EXTEM LI30. On the other hand, TEG K and EXTEM CFT exhibited a trend toward higher values at all postdive time points, while TEG MA, EXTEM CT, and α tended to decrease. Although not reaching significance, EXTEM CT values showed the most pronounced decreases. In addition, we found TEG α, INTEM CFT, and EXTEM MCF were similar at pre- and postdiving time points and thus least affected by the dive. Finally, LY30 showed larger variations than CL30 and LI30.
Descriptive Data of TEG and ROTEM Measurements of Blood Samples From 7 Participants Before and After Diving.a
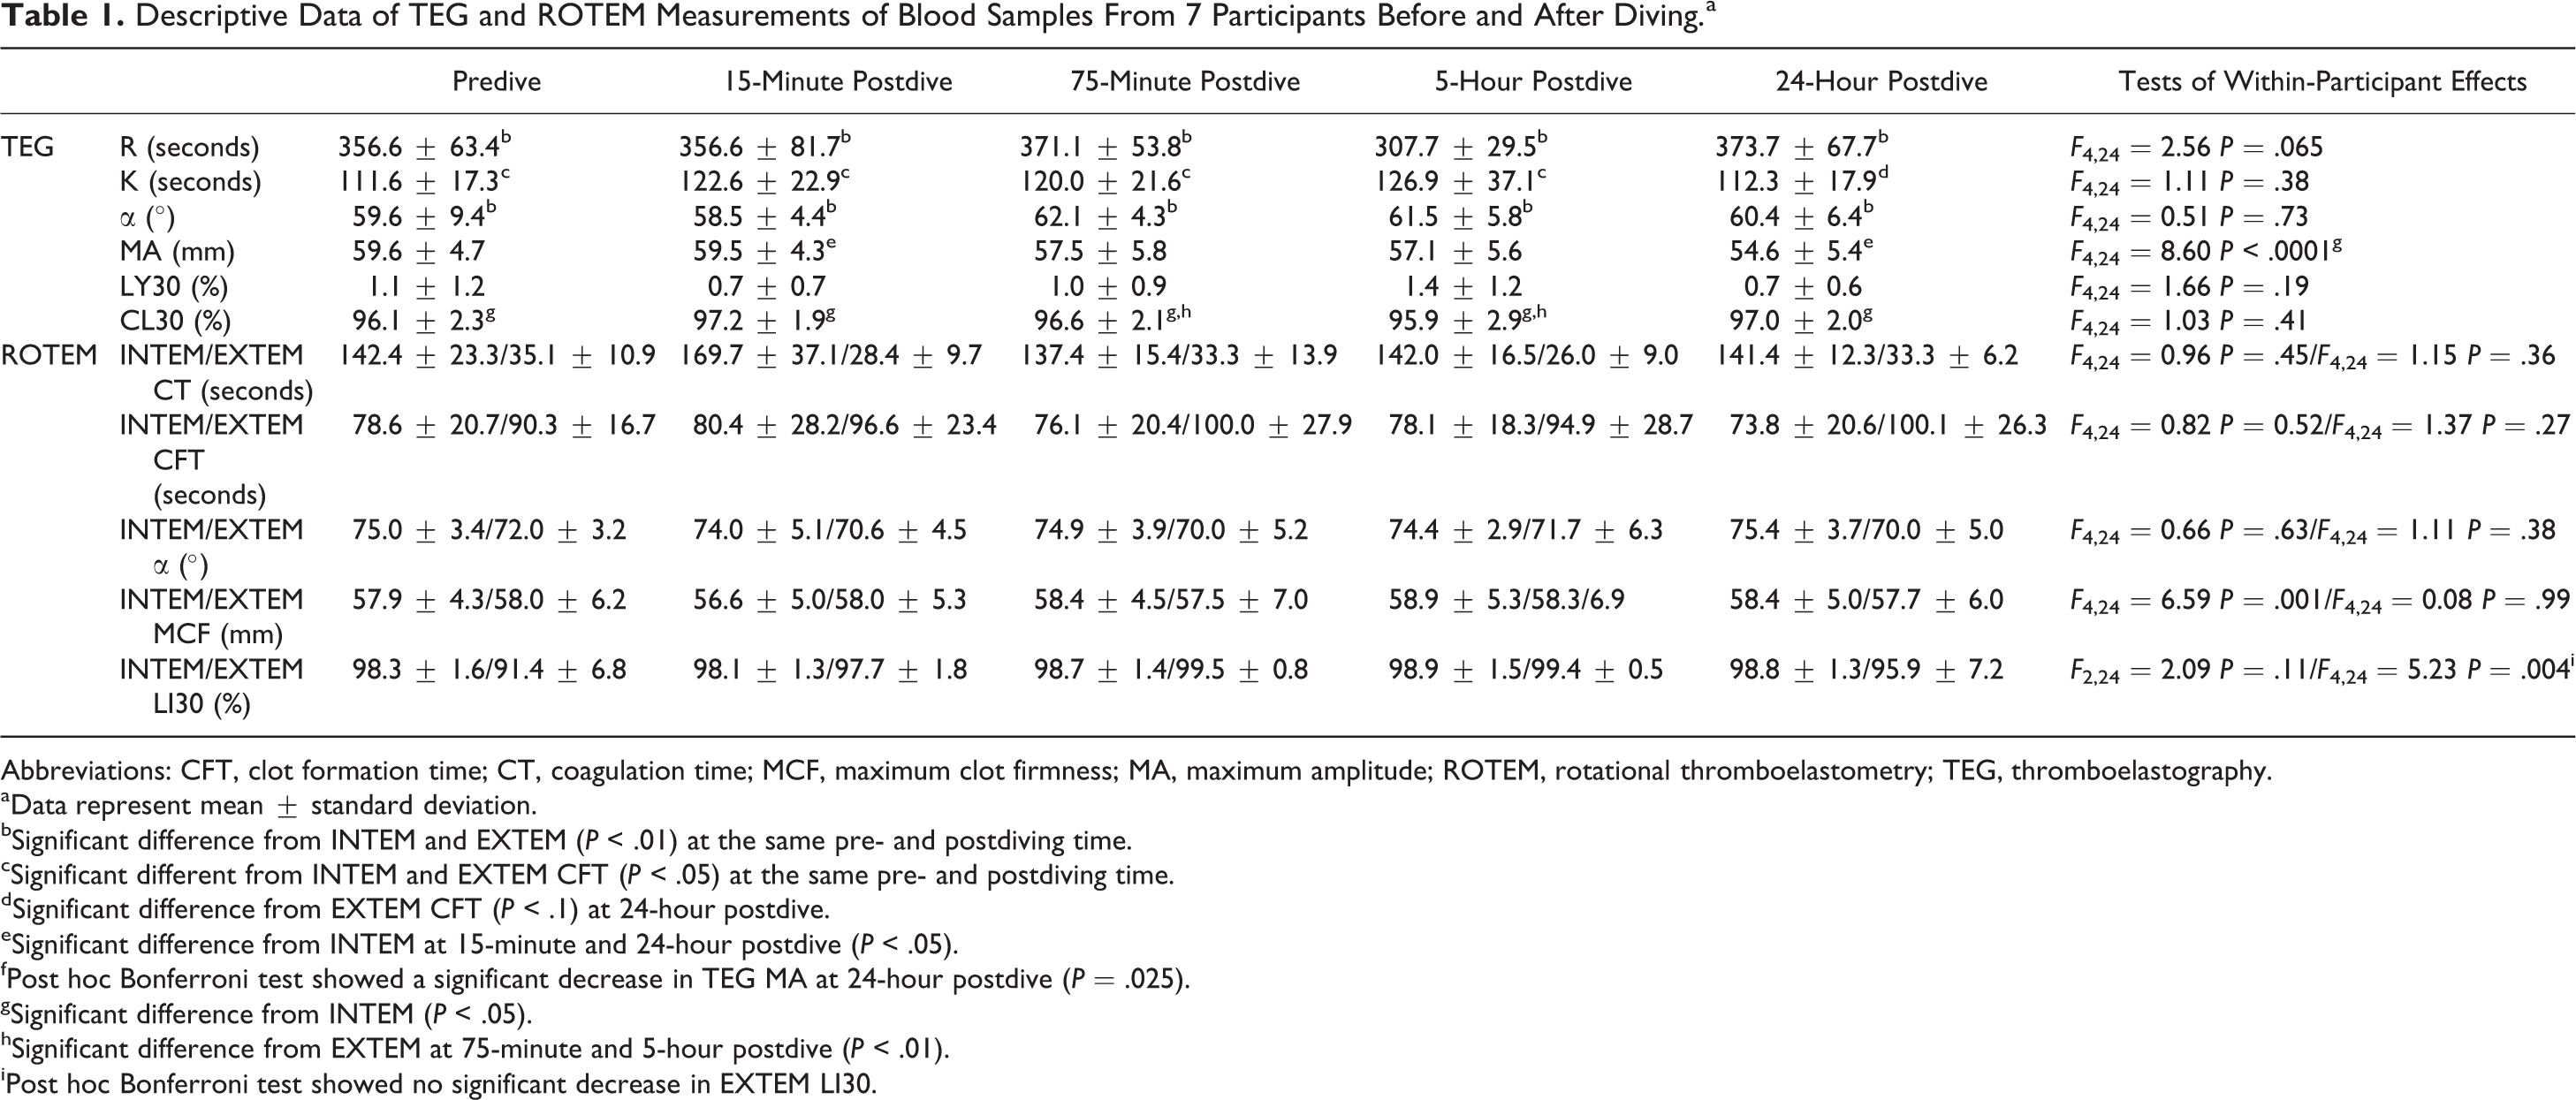
Abbreviations: CFT, clot formation time; CT, coagulation time; MCF, maximum clot firmness; MA, maximum amplitude; ROTEM, rotational thromboelastometry; TEG, thromboelastography.
aData represent mean ± standard deviation.
bSignificant difference from INTEM and EXTEM (P < .01) at the same pre- and postdiving time.
cSignificant different from INTEM and EXTEM CFT (P < .05) at the same pre- and postdiving time.
dSignificant difference from EXTEM CFT (P < .1) at 24-hour postdive.
eSignificant difference from INTEM at 15-minute and 24-hour postdive (P < .05).
fPost hoc Bonferroni test showed a significant decrease in TEG MA at 24-hour postdive (P = .025).
gSignificant difference from INTEM (P < .05).
hSignificant difference from EXTEM at 75-minute and 5-hour postdive (P < .01).
iPost hoc Bonferroni test showed no significant decrease in EXTEM LI30.
Figures 3 and 4 show relative changes in participants’ hemostatic profiles between pre- and postdive with a statistical significance determined using a series of 1-sample t test. Mean clot time reduction with TEG R was significant at 5-hour postdive (P = .050). A significant reduction in TEG MA was found at 24-hour postdive. Thromboelastography also showed a trend of increased change approaching significance in CL30 at 15-minute postdive (P = .080), but not at any other postdive sampling times. INTEM did not show significant changes in coagulation and fibrinolysis parameters at all postdive time points (Figure 4a). EXTEM showed a significantly decreased clot time at 15-minute postdive (P = .043) and a reduction that approached significance at 5-hour postdive (P = .056).
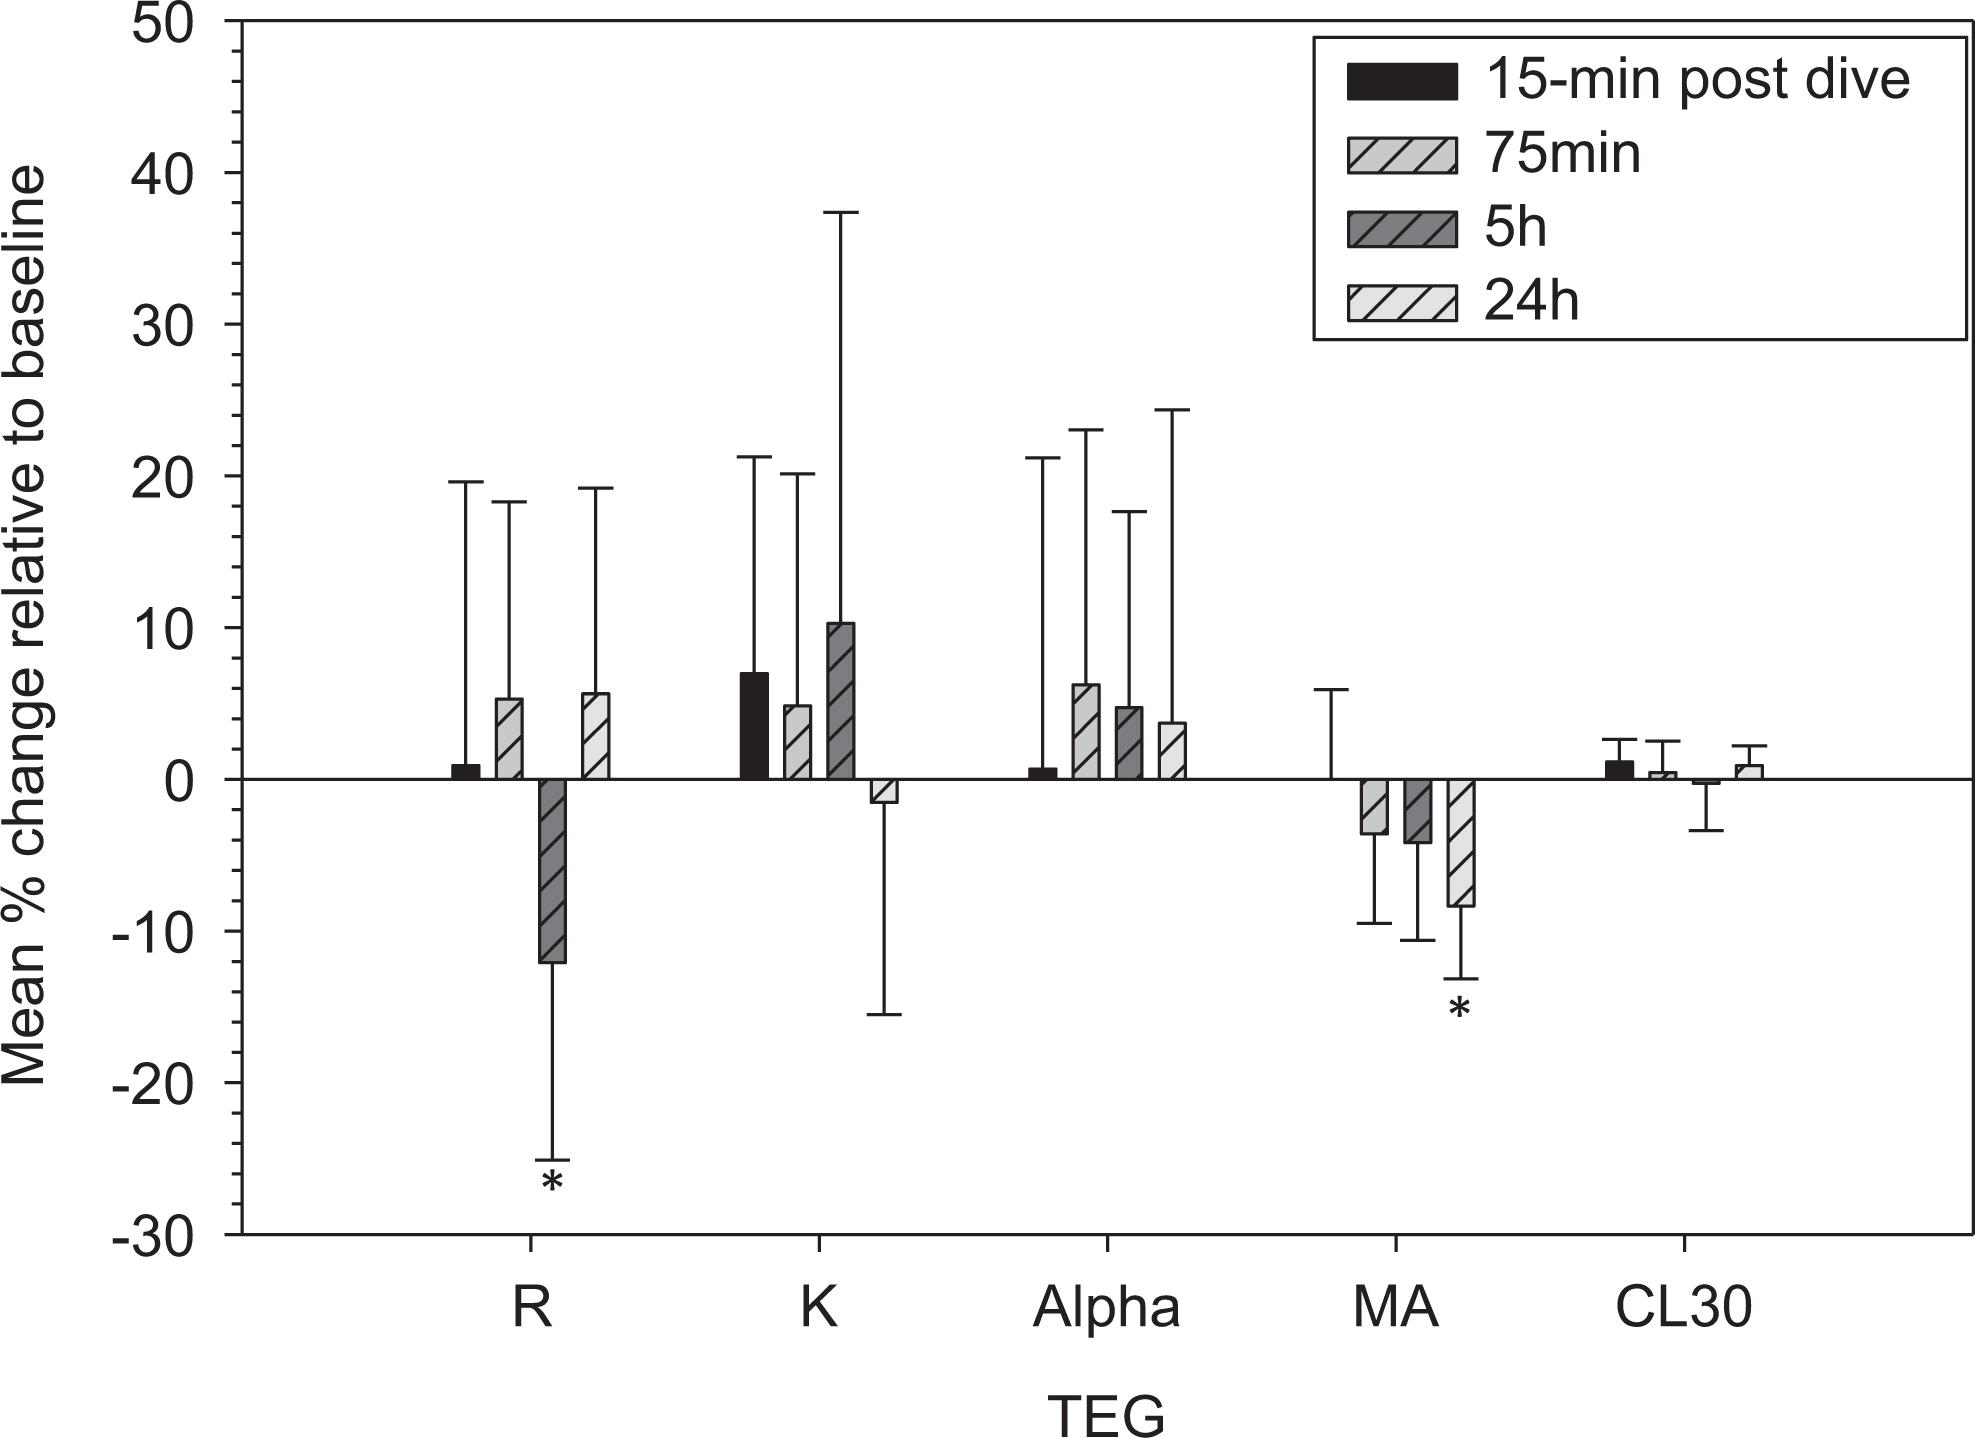
Coagulation and fibrinolysis changes in trained divers (n = 7) at different times after diving. Data are expressed as mean ± standard deviation (SD). *Significant difference from baseline (P ≤ .05). Coagulation and fibrinolysis parameters were measured by thromboelastography. The percentage change relative to baseline for each parameter was calculated as follows: (Pd − P0)/P0 × 100, where P0 and Pd are the parameters measured before and after the diving, respectively.
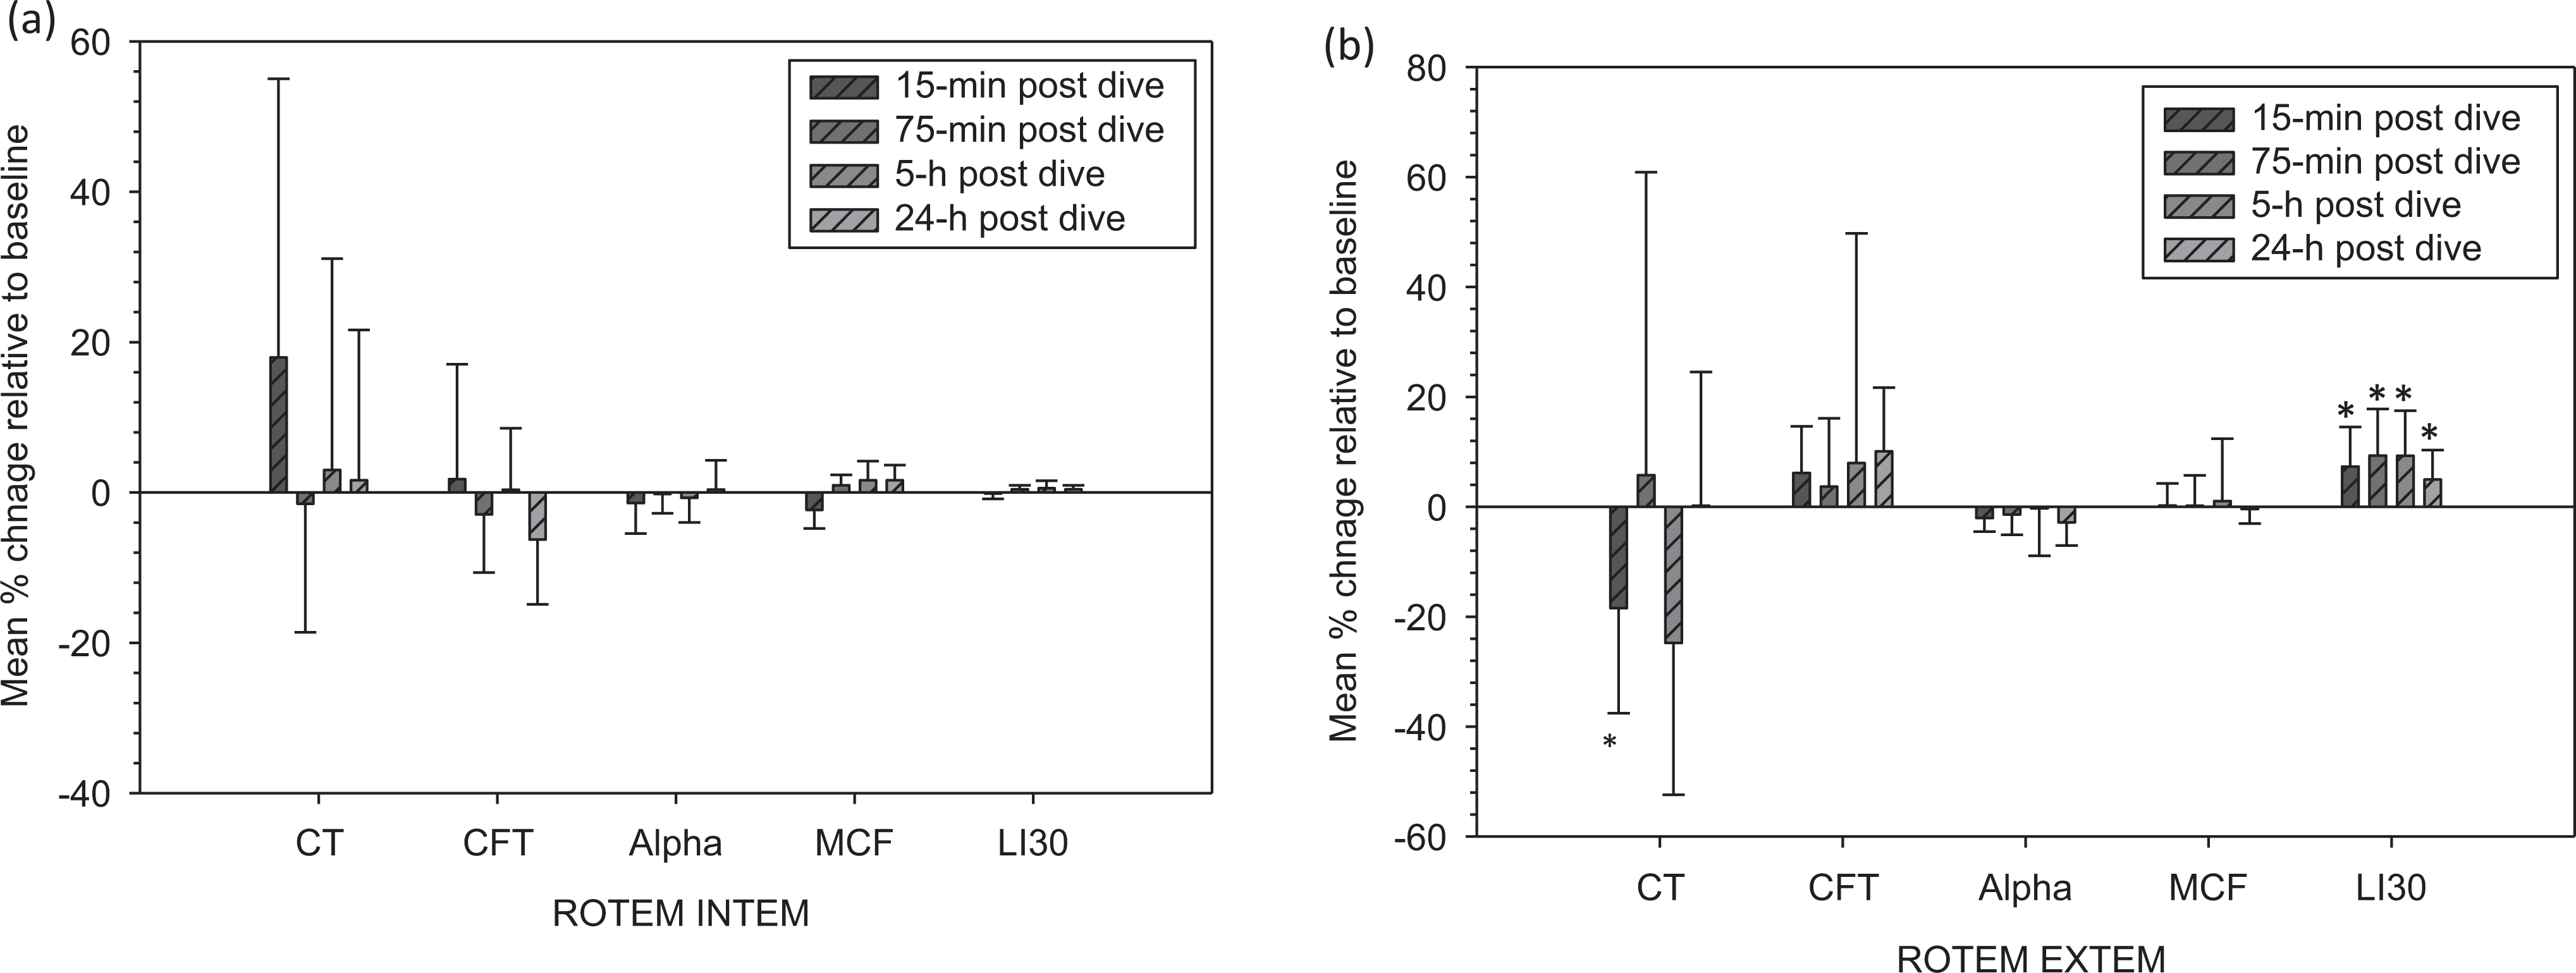
Coagulation and fibrinolysis changes in trained divers (n = 7) at different times after diving. Data are expressed as mean ± standard deviation (SD). Coagulation and fibrinolysis parameters were measured by rotational thromboelastometry (ROTEM) INTEM (a) and EXTEM assay (b). *Significant difference from baseline (P < .05). There were no significant differences from baseline for all parameters measured by ROTEM INTEM assay. The percentage change relative to baseline for each parameter was calculated as follows: (Pd − P0)/P0 × 100, where P0 and Pd are the parameters measured before and after the diving, respectively.
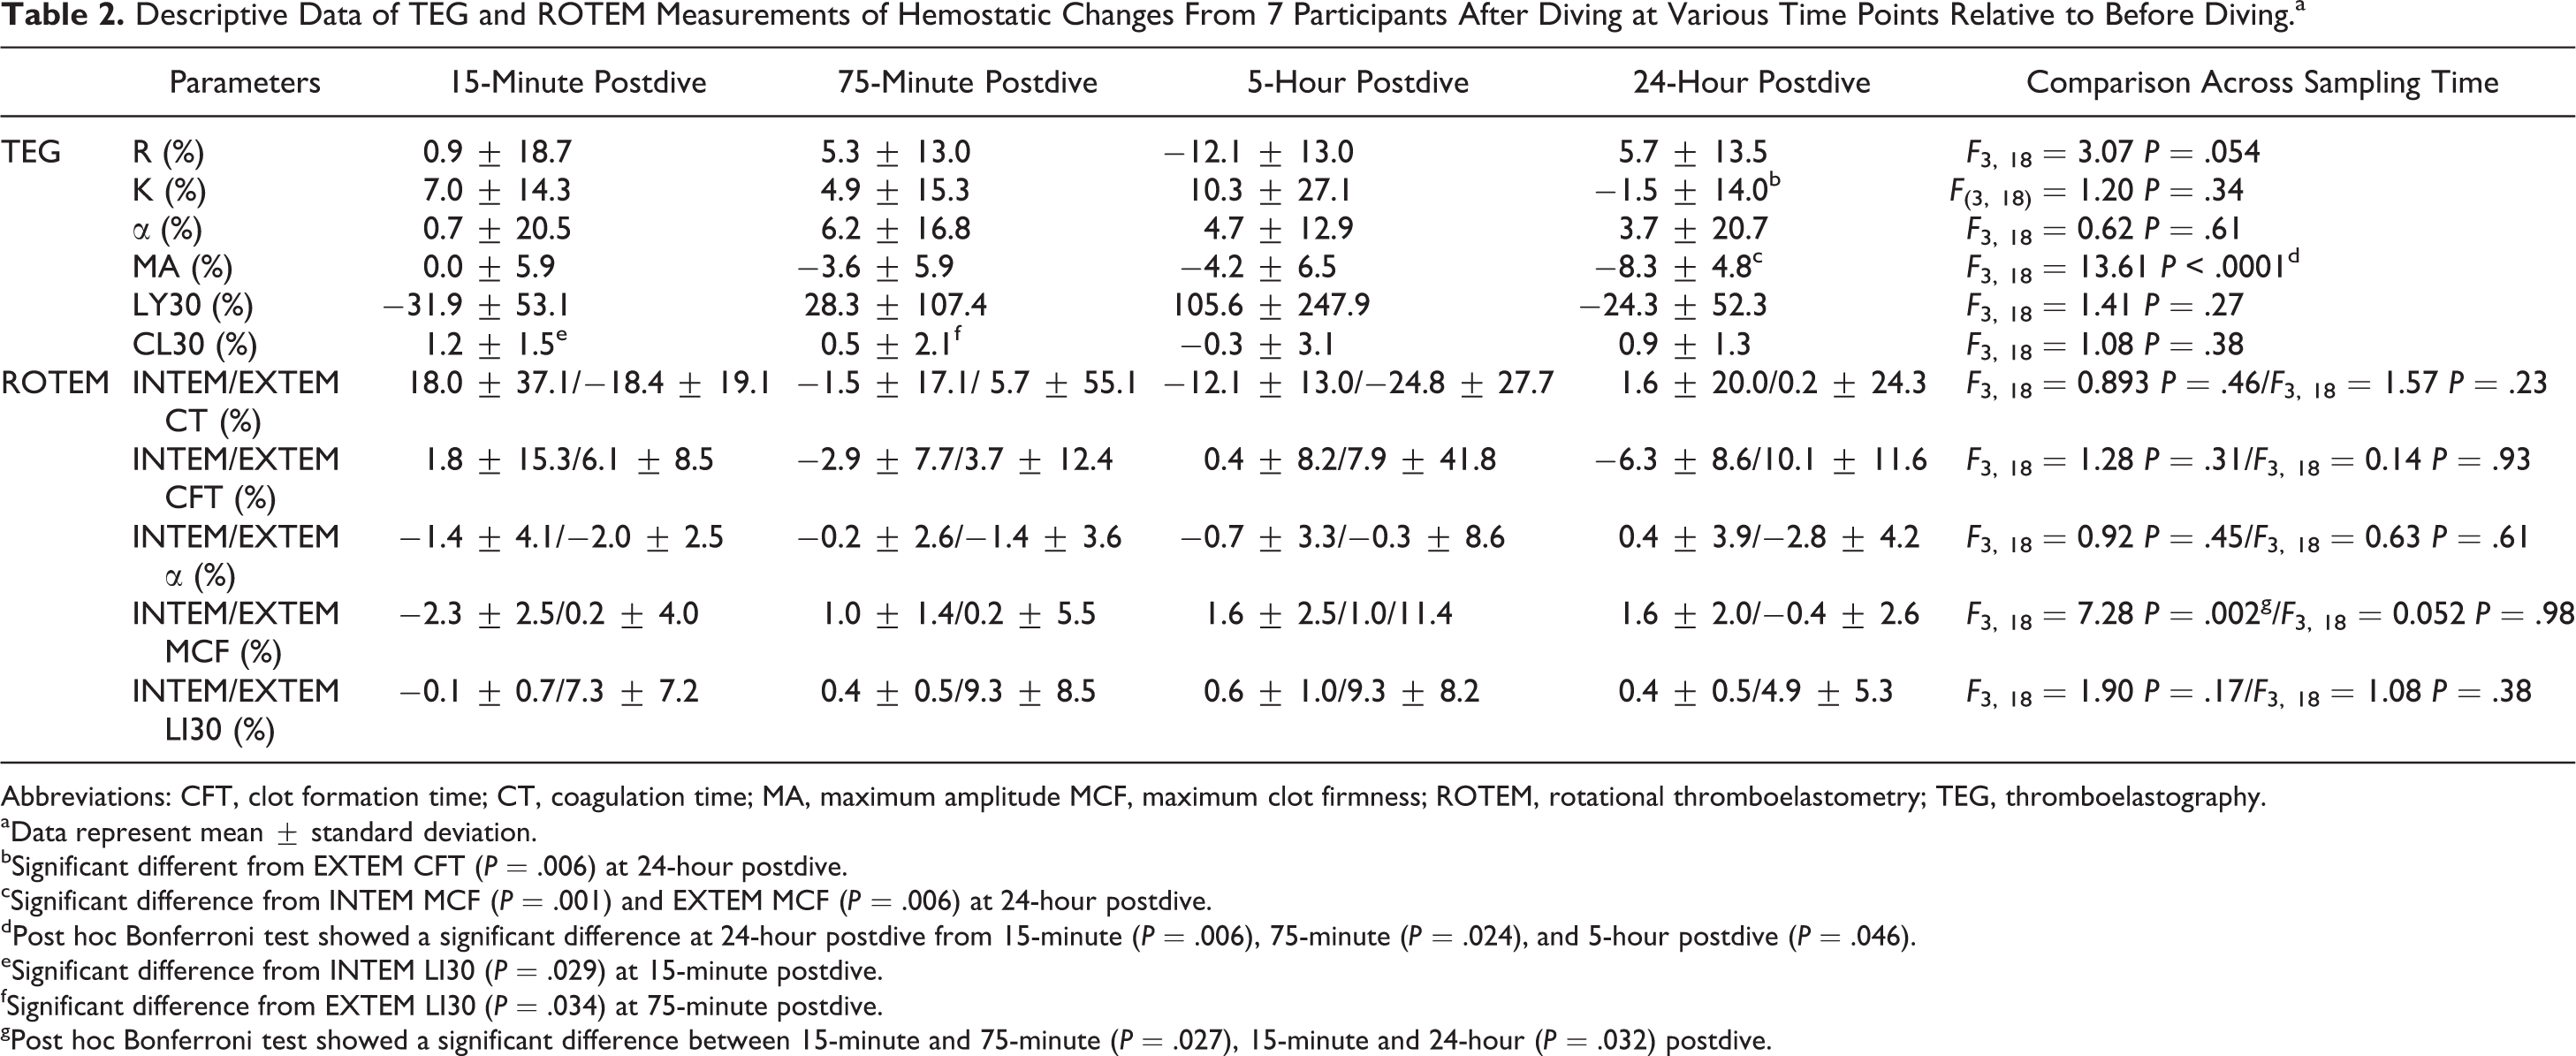
Table 2 summarizes the changes in TEG and ROTEM variables at each postdive time relative to the predive. A significant difference among the postdive changes was observed for TEG MA (P < .0001) and INTEM MCF (P = .002), and a close to significant difference for TEG R (P = .054). There were significant differences in the changes between TEG K and EXTEM CFT (P = .006) at 24-hour post dive, TEG MA and INTEM MCF (P = .001) at 24-hour postdive, TEG MA and EXTEM MCF (P = .006) at 24-hour post dive, TEG CL30 and INTEM LI30 (P = .029) at 15-minute postdive, and TEG CL30 and EXTEM LI30 (P = .034) at 75-minute postdive. There were large standard deviations implying variable individual response to the hyperbaric decompression stress (HDS).
Descriptive Data of TEG and ROTEM Measurements of Hemostatic Changes From 7 Participants After Diving at Various Time Points Relative to Before Diving.a
Abbreviations: CFT, clot formation time; CT, coagulation time; MA, maximum amplitude MCF, maximum clot firmness; ROTEM, rotational thromboelastometry; TEG, thromboelastography.
aData represent mean ± standard deviation.
bSignificant different from EXTEM CFT (P = .006) at 24-hour postdive.
cSignificant difference from INTEM MCF (P = .001) and EXTEM MCF (P = .006) at 24-hour postdive.
dPost hoc Bonferroni test showed a significant difference at 24-hour postdive from 15-minute (P = .006), 75-minute (P = .024), and 5-hour postdive (P = .046).
eSignificant difference from INTEM LI30 (P = .029) at 15-minute postdive.
fSignificant difference from EXTEM LI30 (P = .034) at 75-minute postdive.
gPost hoc Bonferroni test showed a significant difference between 15-minute and 75-minute (P = .027), 15-minute and 24-hour (P = .032) postdive.
Comparison Between TEG and ROTEM
First, we compared the absolute values of corresponding parameters between TEG and ROTEM summarized in Table 1. Their correlations were analyzed using all data from pre- and postdive times as presented in Figure 5 as well as specifically at pre- and postdive times. There was, however, no correlation between INTEM or EXTEM CT versus TEG R (Figure 5a). Interestingly, a correlation existed between TEG R and INTEM CT (r = .881, P = .009) at 75-minute postdive. In contrast, a correlation existed in CTs between TEG K and INTEM CFT (r = .588, P < .001) and TEG K and EXTEM CFT (r = .616, P < .001; Figure 5b). When relationships were examined between TEG K and INTEM and EXTEM CFT at single time point, correlations existed between TEG and INTEM at 75 minutes (r = .753, P = .051), 5 hours (r = .783, P = .037), and 24 hours (r = .836, P = .019) as well as between TEG and EXTEM at 75 minutes (r = .823, P = .023), 5 hours (r = .837; P = .019), and 24 hours postdive (r = .834, P = .020). A correlation existed between TEG and INTEM α angle (r = .470, P = .004) but not between TEG and EXTEM α angle (Figure 5c). However, single time point correlations existed between TEG and INTEM α at 75-minute (r = .733, P = .061) and 5-hour postdive (r = .728, P = .064), and TEG and EXTEM α at 75 minutes (r = .856, P = .014) and 5 hours postdive (r = .795, P = .033). With regard to maximum clot strength, correlations existed between TEG MA versus INTEM MCF (r = .697, P < .001) and TEG MA versus EXTEM MCF (r = .647, P < .001; Figure 5d). As well, single time point correlations existed between TEG MA versus INTEM MCF at predive (r = .913, P = .004), 15-minute (r = .784, P = .037), 5-hour (r = .796, P = .032), and 24-hour (r = .914; r = .004) postdive, and TEG MA versus EXTEM MCF at predive (r = .924, P = .003) and 24-hour postdive (r = .829, P = .021). Finally, it may be important to remember that the 2 systems used slightly different techniques to measure fibrinolysis. Nevertheless, a correlation existed between TEG CL30 and INTEM LI30 (r = .594, P < .001; Figure 5e). Single time point correlations existed between TEG CL30 and INTEM L30 at predive (r = .833, P = .02), 15-minute (r = .841, P = .018), and 24-hour postdive (r = .700, P = .080), and TEG CL30 versus EXTEM LI30 at 15-minute (r = .853, P = .015) and 5-hour postdive (r = .998, P < .001).
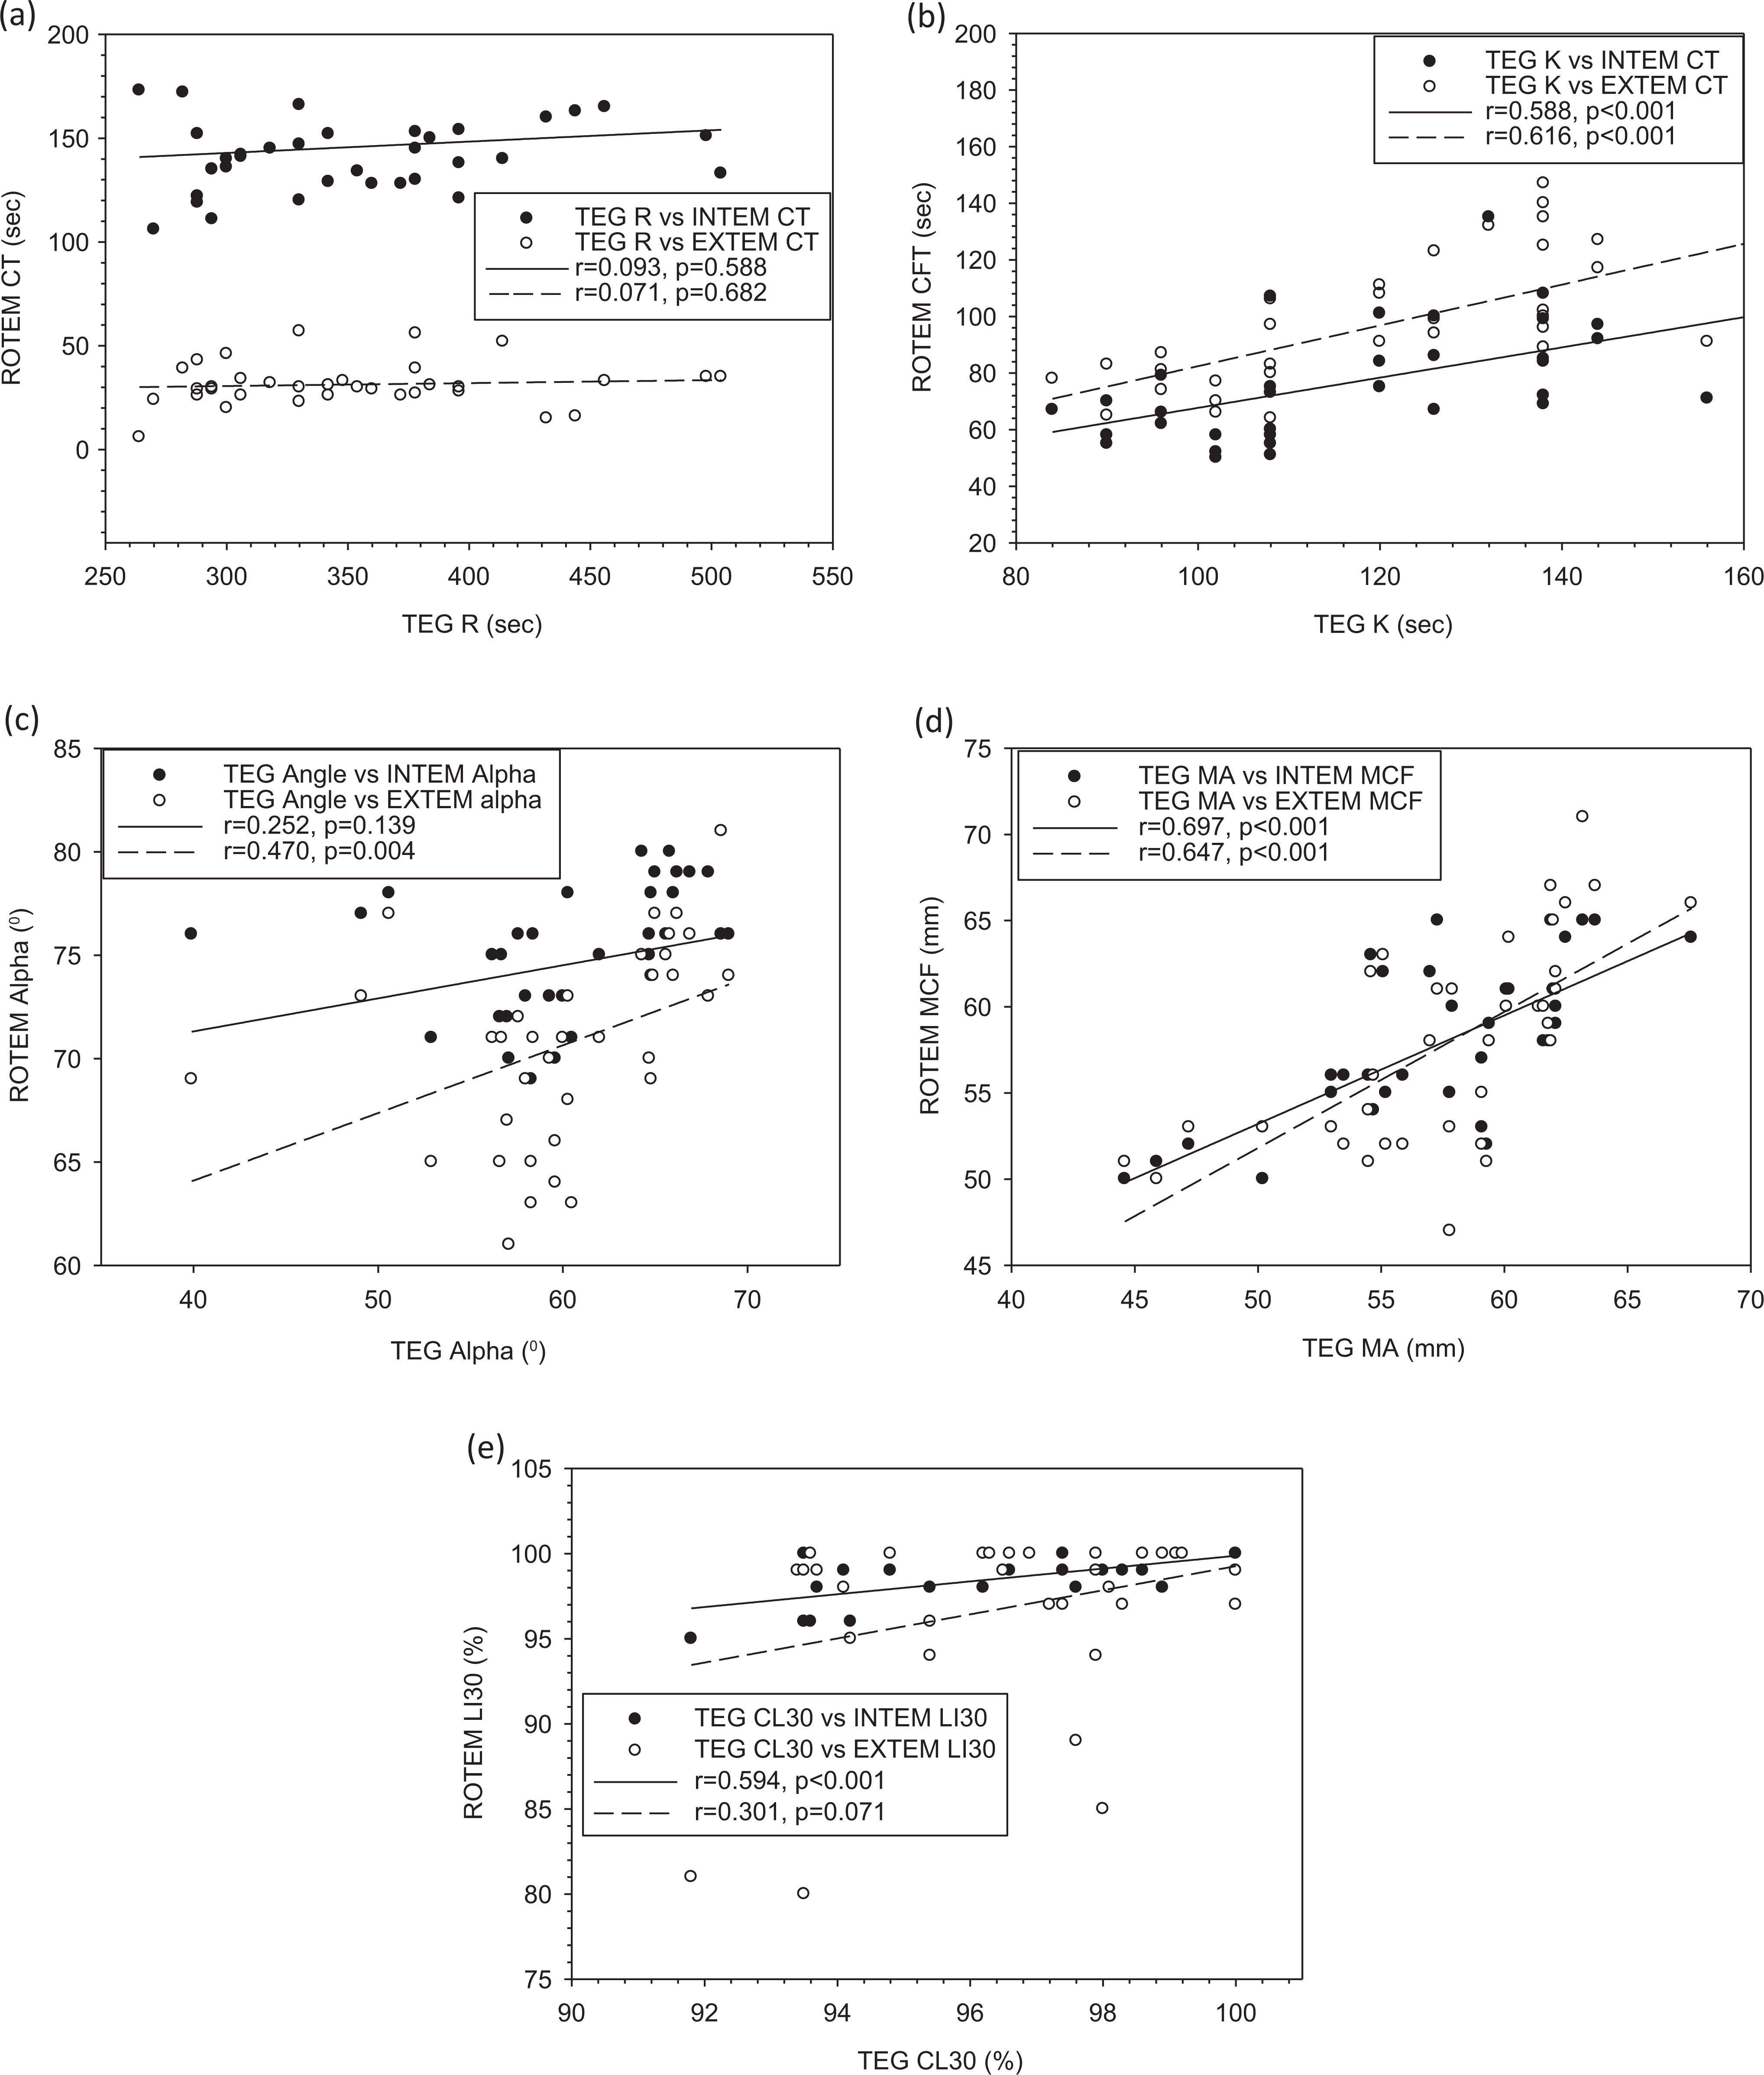
Comparison in key measurement parameters between TEG and ROTEM. Each point represents one measurement on the same blood sample obtained from each participant at pre- and postdive. TEG was performed using kaolin activator, and ROTEM was performed using in-tem and ex-tem reagents. There are significant correlations between TEG K and INTEM/EXTEM CFT (P < .05), TEG α and EXTEM α (P < .05), TEG MA and INTEM/EXTEM MCF, and TEG CL30 and INTEM LI30.
Figure 6 compares the percentage changes in TEG and ROTEM parameter values of each individual at all postdive time points relative to the baseline at predive and thus indicates their abilities to detect changes in coagulation and fibrinolysis as a result of the dive. In addition, the TEG K correlated with EXTEM CFT at 5-hour postdive (r = .977, P < .001). Single time point negative correlations existed between TEG α and INTEM α at 75-minute (r = −.812, P = .027), 5-hour (r = −.753, P = .051), and 24-hour postdive (r = −.887, P = .008). The TEG CL30 correlated with INTEM LI30 at 24-hour postdive (r = .901, P = .006).
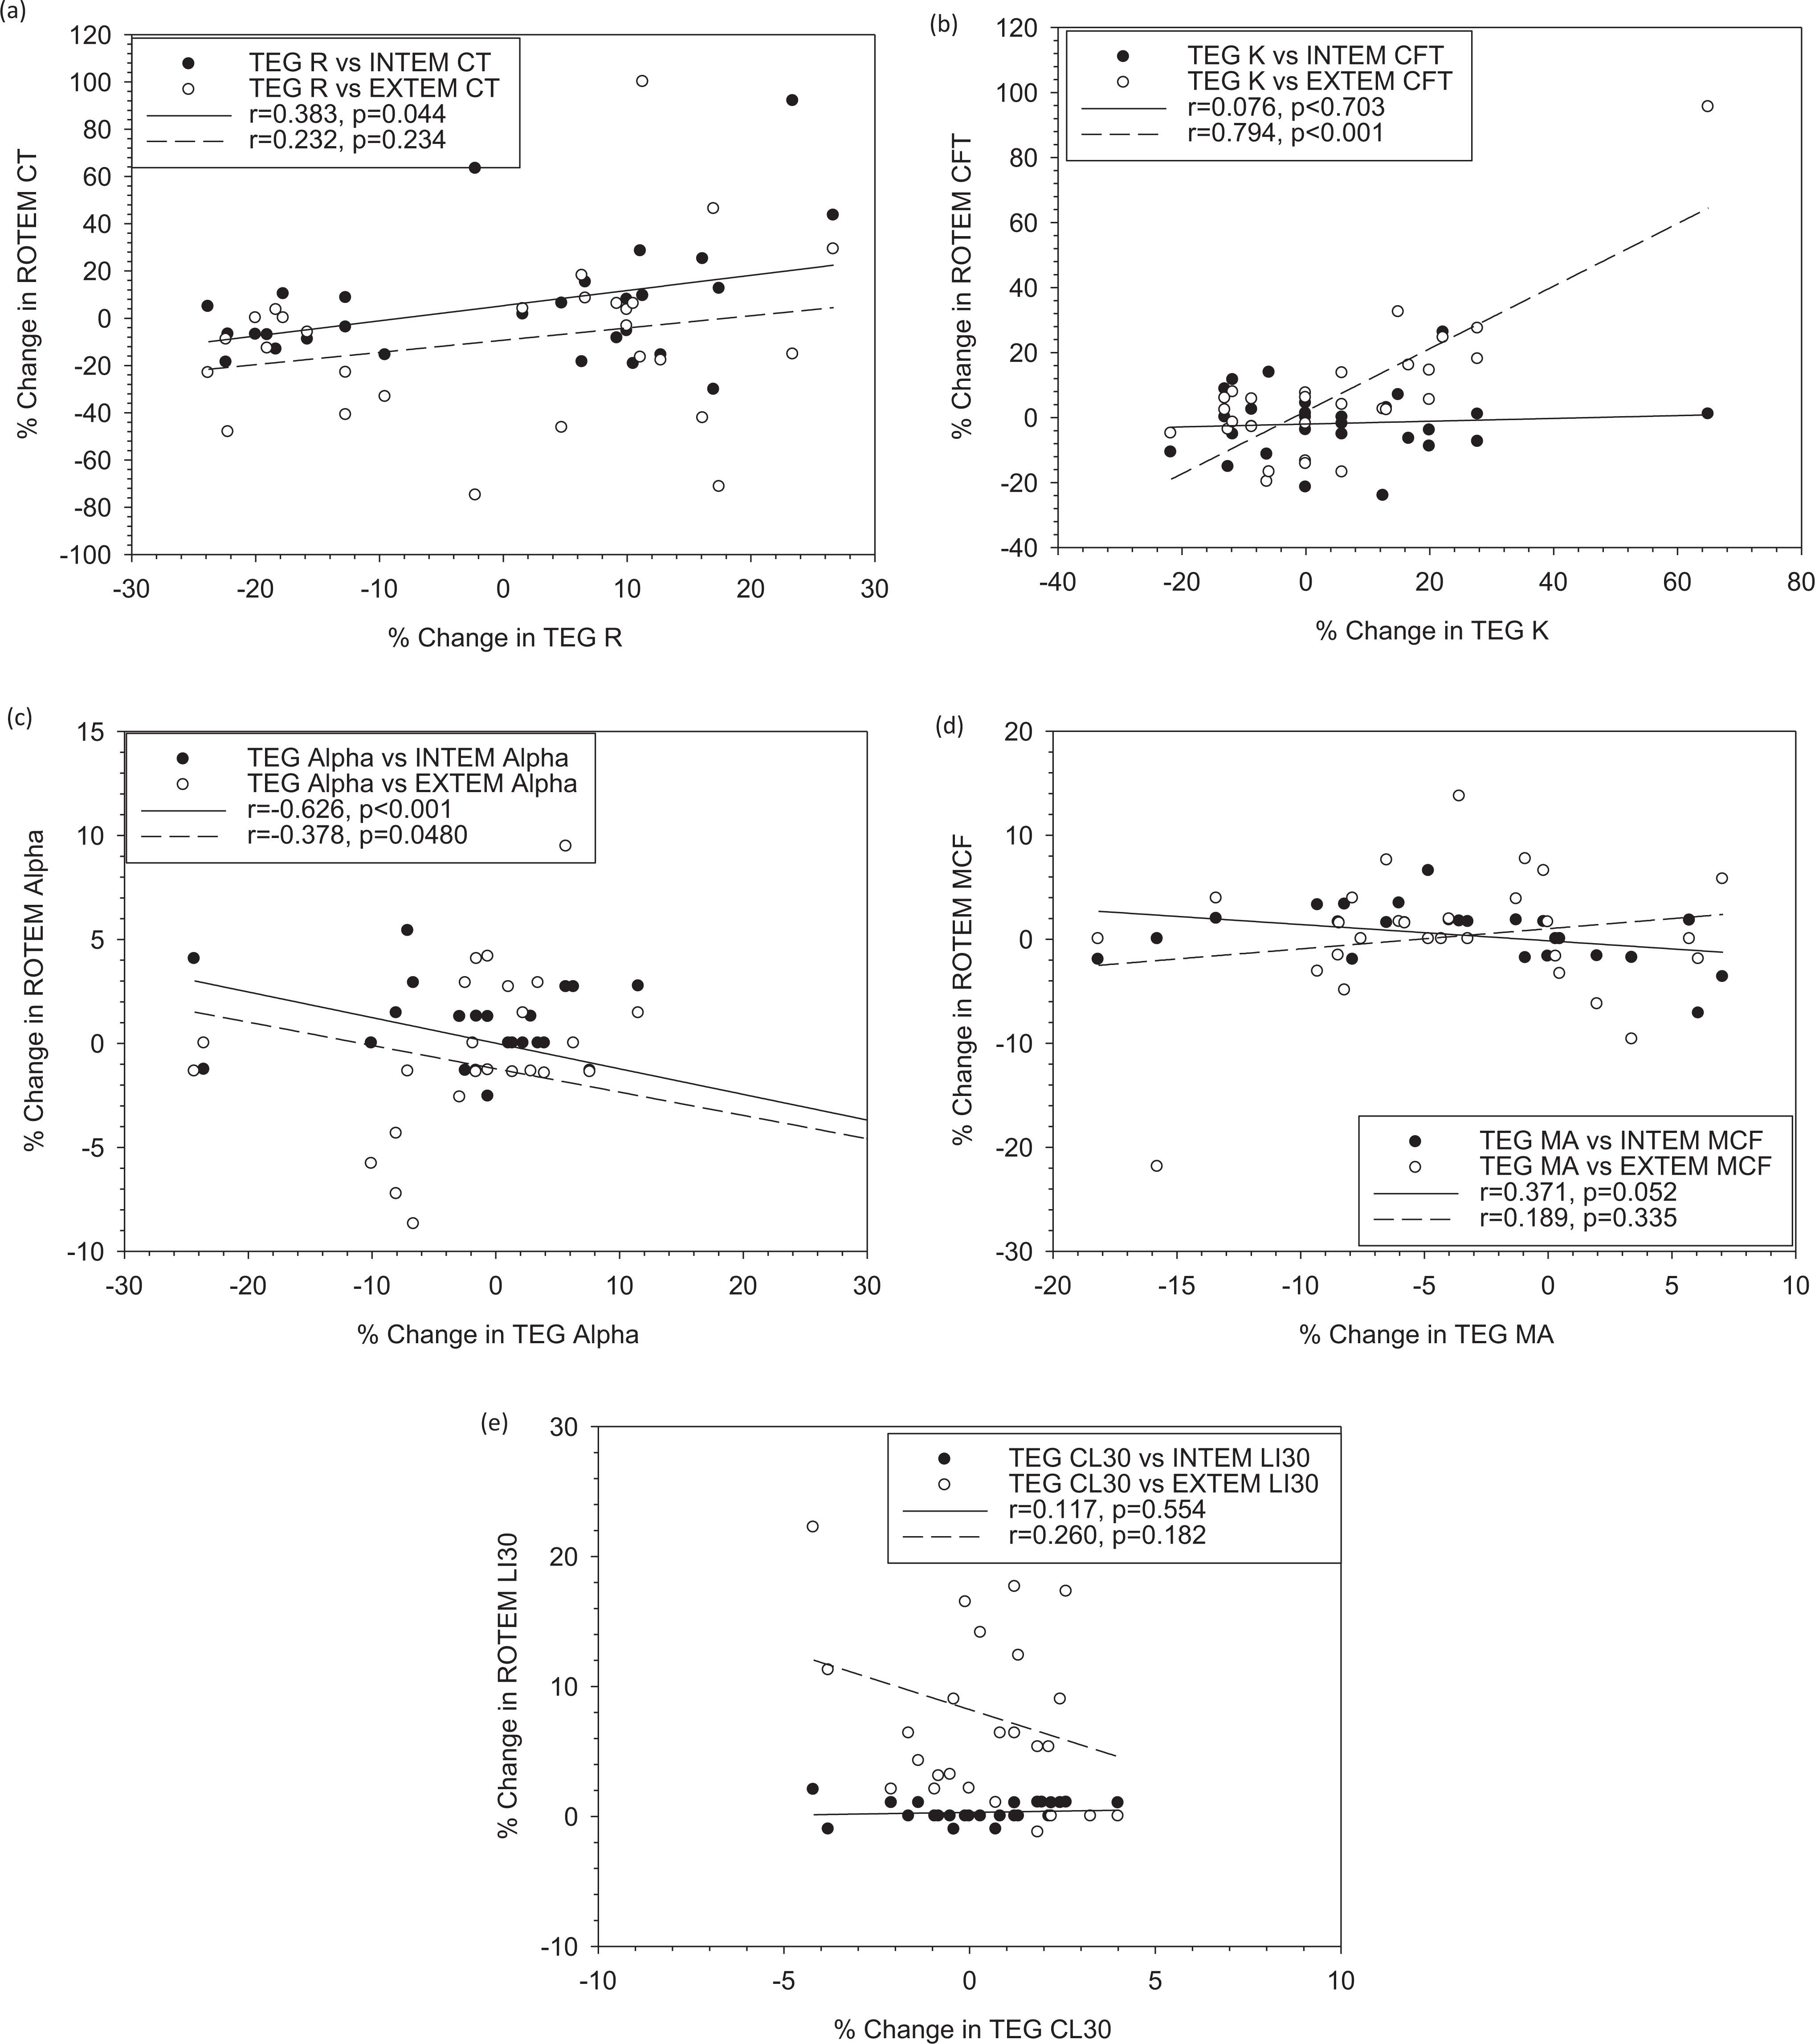
Comparison of the changes in key parameters values from prediving baseline between thromboelastography (TEG) and rotational thromboelastometry (ROTEM). Each point represents percentage change at one postdiving time point for the same blood sample obtained from each participant before and after diving. TEG was performed using kaolin activation, and ROTEM was performed using in-tem and ex-tem reagents. There are significant correlations between TEG R and INTEM CT (r = .383, P = .0440), K and EXTEM CFT (r = .794, P < .001), and TEG α and INTEM (r = −.626, P < .001)/EXTEM α (r = −.378, P = .0476).CT indicates coagulation time; CFT, clot formation time; TEG, thromboelastography; ROTEM, rotational thromboelastometry.
Discussion
This study investigated the effects of diving on blood coagulation and fibrinolysis and compared the 2 systems for global measures of hemostasis in such a context. Both physical activity and psychological stress have been investigated for their effects on blood coagulation and fibrinolysis, 28,29 and both TEG and ROTEM have been used in such studies. 30
Coagulation defect is one of the main causes of decompression sickness. Decompression causes upregulation of both the coagulant and fibrinolysis pathways, however, its overall effects are not well studied. In this study, our TEG and ROTEM global measures indicated that the HDS resulted in overall tending toward hypercoagulability especially for some individuals as shown in Figure 2. As far as we know, we are the first to use the global measure for hyperbaric effects on human hemostasis, and the findings are generally consistent with a procoagulant response to other acute psychophysiological stress, 29 but on average unable to reach statistical significance (P < .05) based on absolute values of most parameters except EXTEM LI30 perhaps due to small sample size (n = 7) and large individual variations. On the other hand, the stress level in our study (557.15 kPa for 20 minutes) may be sufficient compared to that in other studies (280 kPa) where significant activation of platelets and fibrinolysis were noticed. 31
Using the relative changes from baseline at predive, we indeed confirmed hypercoagulable states after diving by both TEG R and EXTEM CT, but at different time points (5 hours postdive vs 15 minutes and 5 hours postdive), with EXTEM also showing reduced fibrinolysis. On the other hand, we noticed a compromised clot formation as indicated by TEG MA at 24-hour postdive. This implied that coagulation factors, platelets, and fibrinolysis markers were altered.
A number of mechanisms have been elucidated and may be used to explain the observed effects. For example, hydrostatic pressure and gas bubbles increased platelet aggregation. 5,7,31 –33 Platelets were more activated in divers as indicated by a marked increase in the percentage of activation marker CD62P molecules, an enhanced number of microplatelets, and a marked drop in the platelets’ count in the blood of divers in the air group. 34 Platelet count has decreased in rats with severe DCS. 35 Hemoconcentration occurred in dogs with severe decompression sickness due to increased permeability of endothelium, which may be caused by substances generated at discrete areas of tissue ischemia or necrosis and by release or generation of substances in the blood. 36 Fibrinolytic activity was enhanced in divers as indicated by decreased levels of plasminogen activator inhibitor 1 and α2-antiplasmin. 6 Hemodynamic changes could be induced by recreational scuba diving. 37
The neuroendocrine effects of stress on hemostasis may be another mechanism. 29 Catecholamine level is known to increase during diving, which may contribute to coagulation changes. 38 However, recent study on hyperbaric stress in trained divers and naive divers did not find any differences in catecholamine levels (norepinephrine and epinephrine) between groups, across time or among levels of diving pressure (180-450 kPa). 39 Plasminogen activator inhibitor could be released from endothelial cells, which might decrease the fibrinolytic activity and thus cause a tendency to thrombosis. 40
The heterogeneity of hemostatic response to HDS could also be recognized using both TEG and ROTEM, which leads us to believe that TEG and ROTEM assessment of the hemostatic patterns in divers may help in predicting the clinical coagulopathy tendency and could be used as one component in the individualization of prevention and prophylactic treatment regimens.
In this study, we also compared the TEG and ROTEM for their key parameter values and sensitivity to detect coagulation and fibrinolysis changes resulting from diving. All the TEG and ROTEM parameters were derived in the same way as each other, except the one for fibrinolysis (Figure 1c). The TEG system provided LY30 and CL30. LY30 is computed as the percentage reduction in the area under a TEG tracing from the time MA is measured until 30 minutes after the MA. CL30 represents the value of the amplitude of a TEG tracing at 30 minutes after the MA relative to MA. The larger the value of LY30 is, the greater is the severity of the fibrinolytic process, which is inverse to CL30. The ROTEM system provided LI30 as a measure of fibrinolysis. It is calculated as the ratio between clot firmness (in mm amplitude) at CT + 30 minutes and MCF. Generally, when LY30 is high (ie, fibrinolytic activity is high), LI30 is low, and vice versa. There are no same fibrinolytic parameters between TEG and ROTEM. CL30 is a fibrinolytic parameter in TEG most similar to LI30 in ROTEM. Therefore, we compared TEG CL30 other than LY30 with ROTEM LI30 for fibrinolysis.
The differences in the parameter values between TEG and ROTEM found in our study were generally consistent with others 17,18 and could be ascribed to the differences in both devices and assay reagents used. 21 The differences related to the equipment functions include the mechanisms for cup/pin rotation, detection of the rotation, cup materials, and interior surface properties. 18,19 In terms of reagents, kaolin is a weaker contact activator than ellagic acid in INTEM and is different from tissue factor activation in EXTEM. 41 The volume ratio between blood and CaCl2 (18 vs 17) may have effects as well. The longer TEG R, K than both INTEM and EXTEM CT, CFT are consistent with the findings reported by Venema et al who used the same activation methods, but different types of blood (native blood for TEG and citrated blood for ROTEM). 17 The larger TEG MA compared to INTEM MCF for some samples is also in agreement with their report. However, the smaller TEG α reached statistical significance in our study (P < .01), not in their study (P = .43 and .17), showing the same trend. The TEG K was longer than both INTEM and EXTEM CFT in our study, while TEG K was only longer than EXTEM CFT reported by Venema et al (P = .003). The discrepancies may be the different blood samples (citrated vs native) and study population (healthy divers vs cardiac surgical patients). Tomori et al reported the same differences as ours when comparing TEG and ROTEM for evaluation of coagulation stages of hemorrhage swine using the same volume ratio of CaCl2 and citrated whole blood and no additional activators. 18 The longer R and smaller α were also found in kaolin activation TEG of normal plasma compared to INTEM CT and α, but there was no difference between TEG MA and INTEM MCF. 19 Since TEG CL30 was calculated from the amplitude 30 minutes after MA, it should be generally smaller than INTEM LI30, which was calculated from the amplitude 30 minutes after CT as elucidated in our study. The most differences in clot initiation (ie, R and CT) and propagation (K, CFT, and α) between TEG and ROTEM in our results were consistent with the different activator types to which these parameters are particularly sensitive. 42
Given the different reagents used in the 2 systems, some discrepancies were expected. However, certain correlations were expected between some TEG and ROTEM parameters. A short time course in a TEG measurement should be accompanied by a short time course in the corresponding ROTEM measurement. Minimal bias in the maximum clot strength and high correlations between TEG and ROTEM imply that this parameter was not profoundly affected by activation methods. The differences between other parameter values and variations were at least partially attributable to the system in addition to the activation reagent. The clinical significances of the differences in hemostatic data generated by the 2 systems need to be determined.
In addition to the comparative studies of the 2 systems focused on the correlations and differences in their parameter values, a few studies were conducted to compare their functions/performance for evaluation of coagulation stages 18 and transfusion requirements 22 as opposed to their capability to detect coagulation and fibrinolysis changes in our study. As different activation reagents were used based on each manufacturer’s instruction, it would be difficult/inappropriate to make a direct comparison of the absolute values of each parameter. 19 Therefore, we examined the relative diving-induced changes and the correlations of their values, as a form to characterize blood coagulation and fibrinolysis response to the stimulus of HDS. There were more differences in diving-induced changes in parameter values between TEG and ROTEM compared to their absolute values, as indicated by negative correlation for TEG and ROTEM α. In addition, TEG K, MA, and CL30 showed different extents of coagulation and fibrinolysis changes from EXTEM CFT at 24 hours postdive, INTEM and EXTEM MCF at 24 hours postdive, INTEM LI30 at 15 minutes and EXTEM LI30 at 75 minutes postdive, respectively (Table 2).
In summary, our study confirmed that TEG R and ROTEM CT were a sensitive parameter to detect a hypercoagulable state, as observed in trauma 18 and healthy populations exposed to stress. 30 The differences between the 2 systems in the postdiving time, when hypercoagulation was observed by the reduced onset time to start coagulation and in the hypofibrinolysis only detected by EXTEM, may be due to activation methods (kaolin/ellagic acid vs tissue factor) leading to different coagulation pathways (intrinsic vs extrinsic). Larsen et al found multiple analyses by INTEM, EXTEM, and FIBTEM, provided more detailed and accurate diagnosis and transfusion guidance with a shorter run time than single analysis by ROTEM with kaolin activation alone. 41 This is consistent with our results showing more changes in diving-induced coagulation and fibrinolysis by INTEM and EXTEM than by kaolin TEG alone. Both compatibility and incompatibility were indicated by the positive correlations between the changes in TEG R and INTEM CT, between TEG K and EXTEM CFT, and negative correlation between TEG and INTEM and EXTEM α.
Conclusion
Diving-induced hypercoagulation was indicated by reduced R time in TEG and CT in EXTEM as well as reduced fibrinolysis in EXTEM. This was in contrast to reduced MA in TEG, implying that different hemostasis elements might be affected. There were differences and correlations in TEG and ROTEM parameter values and their relative changes as a result of HDS. The differences can be ascribed to both hardware and reagents used. Multiple assays through INTEM and EXTEM provided more information than single assay through kaolin TEG. Further studies are warranted to understand the mechanisms underlying diving-induced hemostatic changes and discrepancies observed between TEG and ROTEM.
Footnotes
Acknowledgments
The authors would like to thank Laura Biskey for technical assistance and Defence Research and Development Canada for financial support.
Declaration of Conflicting Interests
The author(s) declared no potential conflicts of interest with respect to the research, authorship, and/or publication of this article.
Funding
The author(s) disclosed receipt of the following financial support for the research, authorship, and/or publication of this article: The author(s) gratefully acknowledge the support of the Defense Research and Development Canada (DRDC) through the Technology Investment Fund (TIF) program.