
Abstract
Increasing number of patients with clinically suspected venous thromboembolism is referred to radiological departments for definitive diagnosis. A simple assay to exclude the diagnosis and avoid radiological examinations is needed. We have reported correlations between D-dimer and prothrombin fragment 1 + 2 measured in plasma and urine. To further develop an analysis based on urine, more understanding of thrombin generation in these patients is needed. The aim of this study was to compare ex vivo thrombin generation with in vivo markers in plasma and urine in patients with and without venous thromboembolism. Urine and blood samples were collected from patients with suspected venous thromboembolism. Commercially available enzyme-linked immunosorbent assay (ELISA) kits were used to analyze the samples for in vivo thrombin generation. The ex vivo thrombogram parameters were measured by the calibrated automated thrombogram assay. Venous thromboembolism was verified with compression ultrasound of the lower extremity deep veins or with computer tomography of the pulmonary arteries. Venous thromboembolism was diagnosed in 117 of 591 patients, and they had significantly higher levels of urine and plasma prothromin fragment 1 + 2, D-dimer, lag time, time to peak, and endogenous thrombin potential when adjusted for covariates. The pattern of ex vivo and in vivo thrombin generation in patients with suspected venous thromboembolism was comparable when adjusted for covariates. Prothrombin fragment 1 + 2 in plasma and urine reflects thrombin generation ex vivo in the same manner. This indicates that urine may be an alternative substrate to quantify a procoagulant state.
Venous thromboembolism (VTE) is a common disease with an estimated incidence of 1:1000 individuals per year in Western countries. 1,2 An increasing number of patients with clinically suspected VTE is daily referred to radiological departments for definitive diagnosis. The imaging verified incidence may, however, be as low as 10%. 3 Thus, a simple assay that allows the exclusion of VTE to avoid unnecessary radiological examinations is needed.
In patients with clinically suspected deep vein thrombosis (DVT) and pulmonary embolism (PE), we have previously reported significant correlations between the prothrombotic markers D-dimer and prothrombin fragment 1 + 2 (F1 + 2) in plasma (pF1 + 2) and spot urine (uF1 + 2). 4 In order to further develop such an analysis, a more comprehensive understanding of individual thrombin propagation and dynamics seems necessary in patients with and without VTE.
For this purpose, we used the thrombin generation assay which is developed to quantify thrombin generation and its kinetics ex vivo on the same population we have previously reported on. 4 –6 The endogenous thrombin potential (ETP), reflects the total enzymatic activity of thrombin and is the parameter most frequently used. 7 In addition, the specific dynamic parameters lag time (LT), reflecting the initiation and amplification phase of coagulation, time to peak (TTP), reflecting the time to maximum thrombin concentration, including the initiation, amplification and propagation phases, and peak thrombin generation (pTG), reflecting the maximum concentration of free thrombin. 8
In the present investigation, we compared ex vivo thrombin generation with the in vivo plasma markers D-dimer and F1 + 2 as well as soluble tissue factor (sTF) and F1 + 2 in urine in patients with suspected VTE in order to achieve a better understanding of the generation of thrombin in patients with and without DVT and PE.
Materials and Methods
The study was conducted in accordance with the Declaration of Helsinki and approved by the Regional Ethics Committee, the Norwegian Social Science Data Services, and the Regional Data Protection Officer. All patients gave written informed consent.
Patients
The study population has previously been described. 4 –6 Consecutive patients aged 18 years and older referred to the Department of Radiology between April 2007 and November 2009 with clinically suspected DVT or PE were eligible to be enrolled. Included patients were interviewed on use of antithrombotic medications and comorbidities, including pregnancy. Heparin derivatives, platelet inhibitors (clopidogrel and aspirin), and the vitamin K antagonist warfarin were included in the definition of antithrombotic medications. Comorbidities were defined as present cardiovascular diseases, trauma, or surgery within past 3 months, active malignancies and infections. Any smoking was defined as current smoker.
Radiological Examinations
B-mode compression ultrasound (Toshiba Aplio 80 and Toshiba Aplio XG; Toshiba Medical Systems, Tochigi, Japan) supplemented with venography of the femoral, popliteal, and deep calf veins when inconclusive were used for DVT diagnosis. Imaging of the pulmonary arteries was conducted with computed tomography (CT) angiography for PE diagnosis (Mx8000 IDT 16 CT Scanner, Philips Medical Systems, Best, The Netherlands) from arcus aorta to the diaphragm. Nonionic contrast (120 mL Omnipaque 240 mg/mL) was injected in the upper extremity at 3 mL/s. A bolus-tracking system (Bolus Pro Ultra, Philips Medical Systems) in the truncus pulmonalis was used for contrast timing.
Laboratory Analyses
Prior to the radiological examination, venous blood samples were collected by use of vacutainer tubes containing 0.129 mol/L trisodium citrate in 1:10 dilution. Within 1 hour, the samples were centrifuged at 3000×g for 20 minutes to obtain platelet-poor plasma, stored at −80°C until analyses. Determination of D-dimer and F1 + 2 was performed in batches with commercially available ELISA kits (Enzygnost F1 + 2; Siemens Healthcare Diagnostics, Marburg, Germany and Asserachrome D-dimer, Stago Diagnostics, Asnieres, France, respectively), as previously described in detail. 4 Coefficients of variations (CVs) were 5.4% and 6.6%, respectively. For sTF, the Imubind TF kit recognizing TF-apolipoproteins, sTF, and TF-VII complexes (American Diagnostic Inc, Greenwich, Connecticut) with CV of 10.5% were used. The thrombogram parameters were measured by the calibrated automated thrombogram (CAT) assay (Thrombinoscope BV, Maastricht, The Netherlands) on the Fluoroskan Ascent® microplate fluorimeter (Thermo Fisher Scientific Oy, Vantaa, Finland). A fresh made starring reagent containing phospholipids and tissue factor (TF) in addition to a thrombin-specific fluorogenic substrate in Hepes buffer containing CaCl2 were added to the plasma to obtain a final concentration of 5 pM, 4 μM, and 416.7 μM, respectively. Simultaneous analysis of an inert thrombin calibrator with known thrombin activity was performed in order to calculate the results. The software Thrombinoscope BV (Maastricht, The Netherlands, version 3.0.0.29) was used to measure the single parameters LT, TTP, pTG, and ETP. In addition, velocity index (V T) was calculated as: pTG/(TTP − LT). The CVs of the different CAT parameters were 14.2%, 4.6%, 5.0%, and 8.0%, respectively.
Statistical Analyses
The total cohort was divided in 2 groups: a VTE-negative group and a VTE-positive group.
Data analyses were conducted with IBM SPSS Statistics 22 (IBM, Armonk, New York). Number of patients, percentages, and medians with 25, 75 percentiles interquartile range were used for descriptive statistics. To assess differences between the groups in baseline characteristics, ex vivo and in vivo parameters, the nonparametric Mann-Whitney U test and Pearson χ2 test were used for continuous and categorical data, respectively. Correlations between the measured parameters were assessed with Spearman rank correlation (r s). Associations between prothrombotic markers and VTE were adjusted for relevant covariates: age, sex, comorbidities, and smoking. Skewed data were log-transformed before entered in the regression model. A P value of .05 or less was considered statistically significant.
Results
A total of 725 patients were included during the study period. Due to missing laboratory data, 68 patients were excluded and 66 patients were further excluded due to use of antithrombotic medications.
Baseline characteristics of the remaining 591 patients are given in Table 1. The cohort was relatively young with almost equal sex distribution. Only 15% had previous history of VTE, 35% had known comorbidities, and less than one-third of the patients were smokers. Levels on the haemostatic variables in the total population are shown in Table 1.
Characteristics of the Study Population.a,b
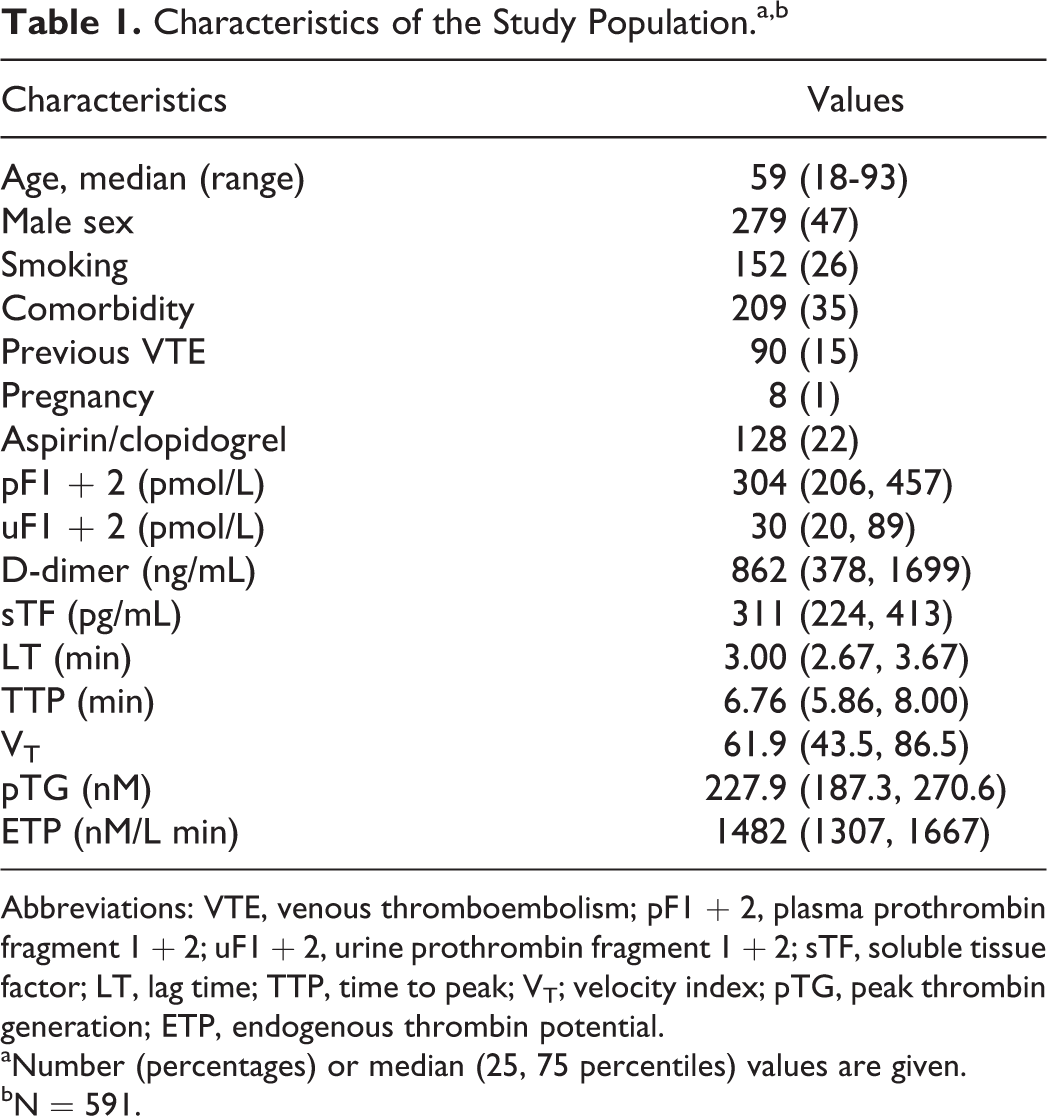
Abbreviations: VTE, venous thromboembolism; pF1 + 2, plasma prothrombin fragment 1 + 2; uF1 + 2, urine prothrombin fragment 1 + 2; sTF, soluble tissue factor; LT, lag time; TTP, time to peak; VT; velocity index; pTG, peak thrombin generation; ETP, endogenous thrombin potential.
aNumber (percentages) or median (25, 75 percentiles) values are given.
bN = 591.
There were significant correlations between sTF and pF1 + 2 (r s = 0.136, P < .001), uF1 + 2 (r s = 0.099, P = .016), and D-dimer (r s = 0.104, P = .012). The pF1 + 2, uF1 + 2, and D-dimer correlated significantly with LT and TTP, however, not with ETP (Table 2).
Correlations Between the In Vivo and Ex Vivo Biomarkers.a
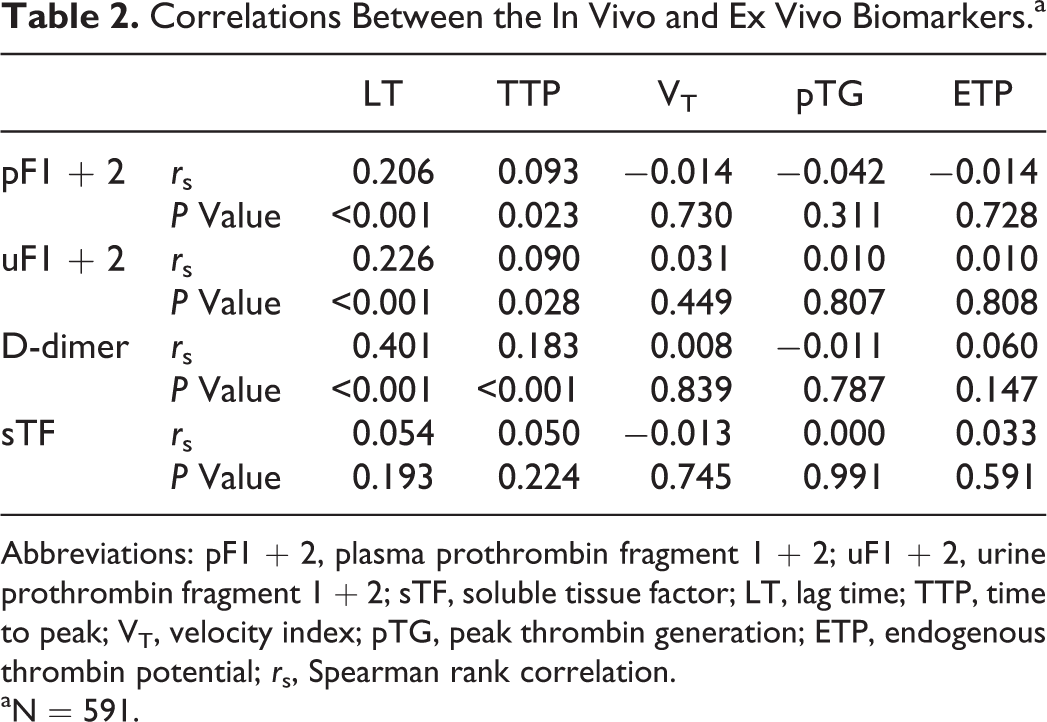
Abbreviations: pF1 + 2, plasma prothrombin fragment 1 + 2; uF1 + 2, urine prothrombin fragment 1 + 2; sTF, soluble tissue factor; LT, lag time; TTP, time to peak; VT, velocity index; pTG, peak thrombin generation; ETP, endogenous thrombin potential; r s, Spearman rank correlation.
aN = 591.
Age correlated significantly to sTF, pF1 + 2, uF1 + 2, and D-dimer, and inversely to pTG and ETP (Ps < .001) and weakly correlated to LT and TTP and inversely to V T (Ps < .005).
Prothrombotic Markers and Association With VTE
The VTE was imaging confirmed in 117 patients (20%). Characteristics of the VTE-negative and VTE-positive groups are shown in Table 3. Significantly higher number of males and higher number of patients with previous VTE were seen in the positive group. The VTE-negative group had significantly higher proportion of patients on platelet inhibitors. Biomarker levels of the 2 groups are shown in Table 4. The sTF did not differ significantly between the groups. As previously reported, pF1 + 2, uF1 + 2, and D-dimer levels were significantly higher in the VTE-positive group (Ps < .001). 4 In addition, VTE-positive patients had significantly higher levels of LT and TTP (both P < .001), whereas ETP levels were numerically, but not statistically significantly higher compared to the VTE-negative group.
Characteristics of the Venous Thromboembolism Negative and Positive Groups.a,b
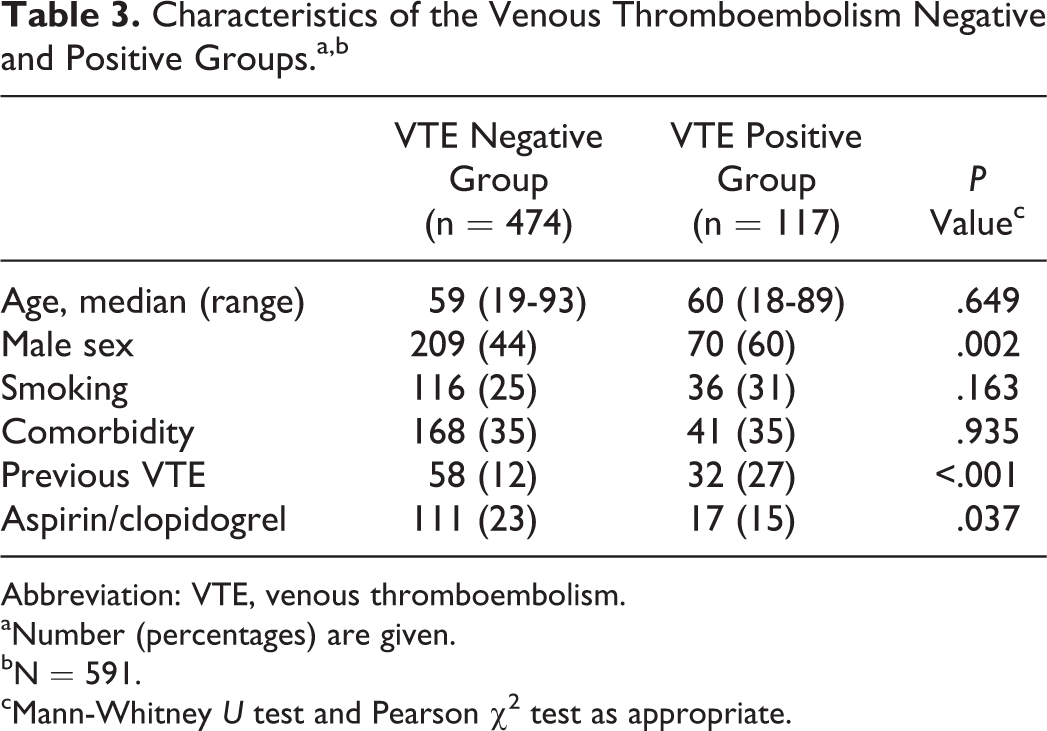
Abbreviation: VTE, venous thromboembolism.
aNumber (percentages) are given.
bN = 591.
cMann-Whitney U test and Pearson χ2 test as appropriate.
Biomarkers in the Venous Thromboembolism Negative and Positive Groups.a
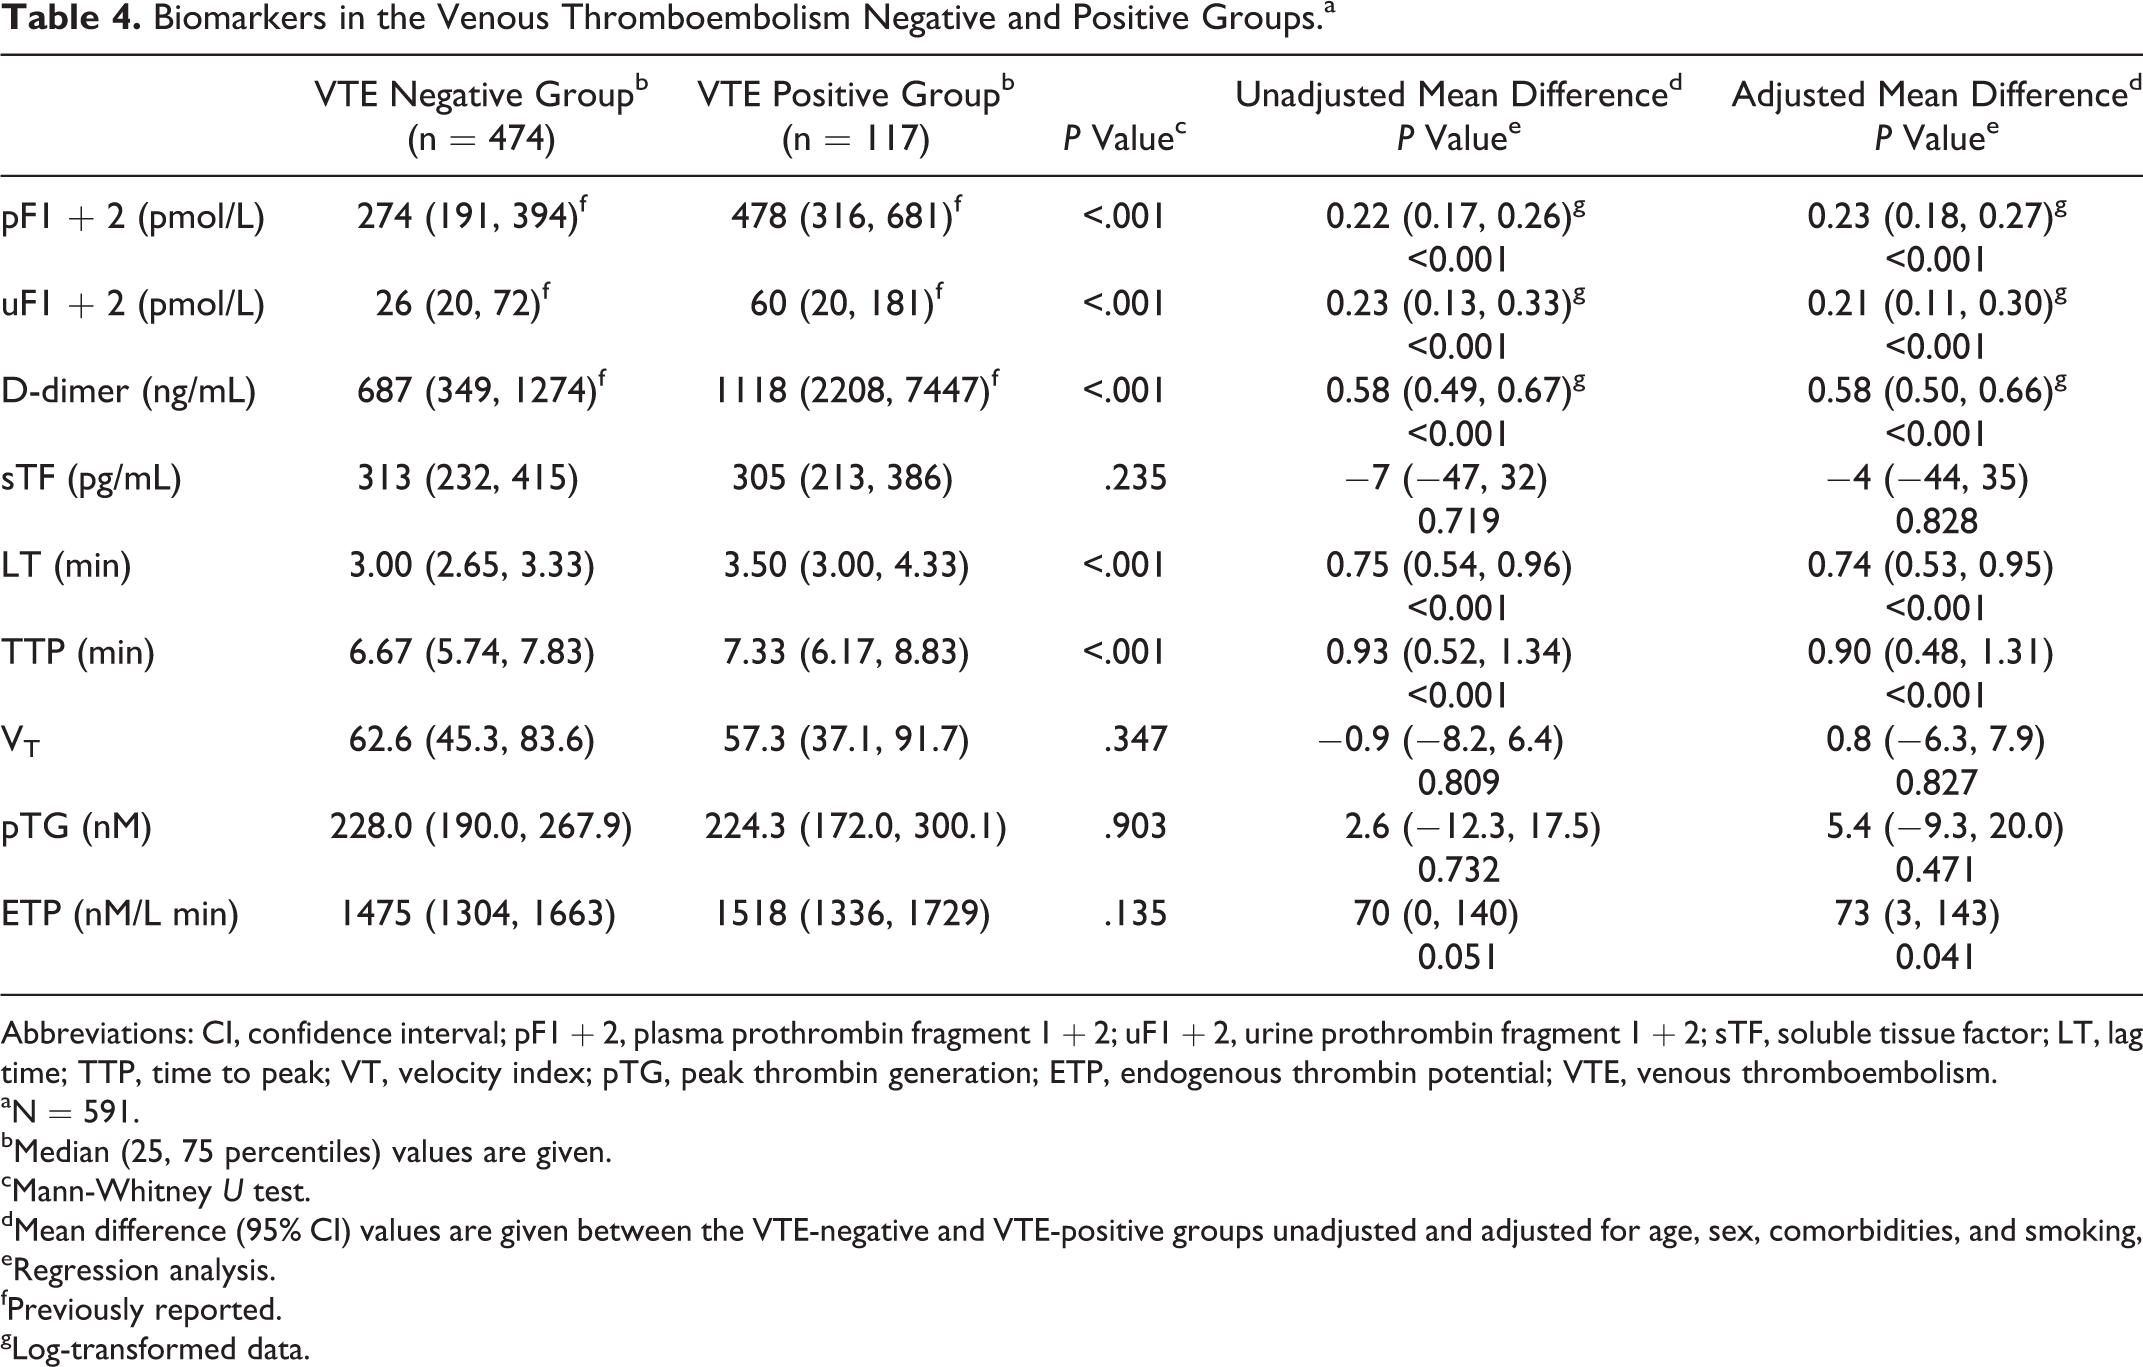
Abbreviations: CI, confidence interval; pF1 + 2, plasma prothrombin fragment 1 + 2; uF1 + 2, urine prothrombin fragment 1 + 2; sTF, soluble tissue factor; LT, lag time; TTP, time to peak; VT, velocity index; pTG, peak thrombin generation; ETP, endogenous thrombin potential; VTE, venous thromboembolism.
aN = 591.
bMedian (25, 75 percentiles) values are given.
cMann-Whitney U test.
dMean difference (95% CI) values are given between the VTE-negative and VTE-positive groups unadjusted and adjusted for age, sex, comorbidities, and smoking,
eRegression analysis.
fPreviously reported.
gLog-transformed data.
When analyzing the biomarkers adjusted for age, sex, comorbidities, and smoking, the results were similar; however, the VTE-positive group had significantly higher levels of ETP compared to the negative group (P = .041; Table 4).
Among the VTE-positive patients, 25 (21%) were diagnosed with PE and 92 (79%) had DVT. There were no differences in characteristics or in biomarker levels between these 2 groups (data not shown).
Prothrombotic Markers and Group Characteristics
Comparison of the prothrombotic markers according to group characteristics is shown in Table 5. Women had significantly higher levels of F1 + 2 both in plasma and urine, while levels of LT and TTP were markedly higher in men (Ps < .05). The F1 + 2 in plasma and urine, D-dimer, sTF, and LT levels were lower in smokers compared to nonsmokers (Ps < .05). In patients with comorbidities, pF1 + 2, uF1 + 2, D-dimer, and LT levels were significantly higher compared to the group without comorbidities (Ps < .001). There was not a significant difference of biomarker levels for previous history of VTE.
Levels of Prothrombotic Markers According to Group Characteristics.a,b
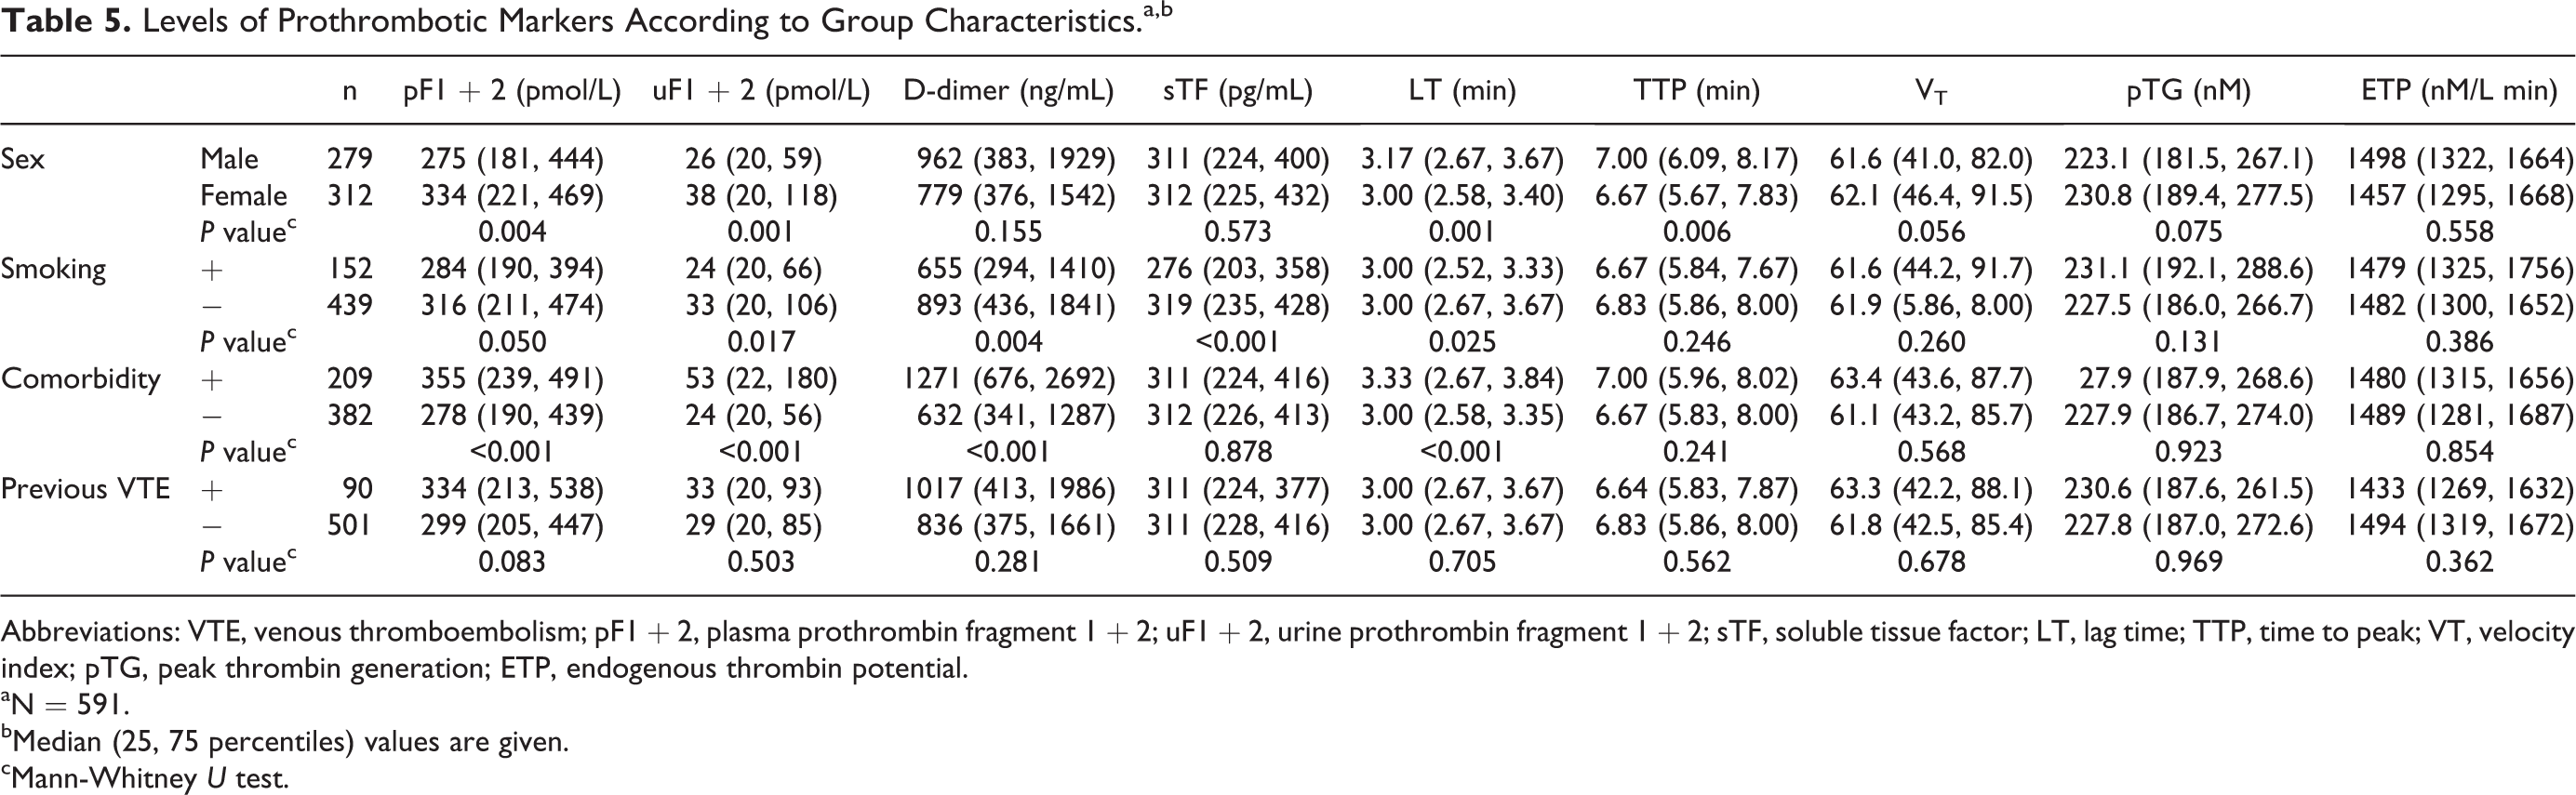
Abbreviations: VTE, venous thromboembolism; pF1 + 2, plasma prothrombin fragment 1 + 2; uF1 + 2, urine prothrombin fragment 1 + 2; sTF, soluble tissue factor; LT, lag time; TTP, time to peak; VT, velocity index; pTG, peak thrombin generation; ETP, endogenous thrombin potential.
aN = 591.
bMedian (25, 75 percentiles) values are given.
cMann-Whitney U test.
Discussion
In this study, we evaluated thrombin generation both ex vivo and in vivo and found that increased levels of LT, TTP, F1 + 2, and D-dimer were associated with imaging verified VTE. The ETP levels were also significantly higher in the VTE population after adjusting for age, sex, comorbidities, and smoking. Several studies have previously shown increased ETP and peak thrombin levels to be associated with increased risk of VTE, the latter opposed to our study. 9 –12 This discrepancy might be explained by differences in the studied populations, that is, imaging verified VTE versus risk stratification of VTE, comorbidities, use of medications, and the time frame of blood sampling, which in our study was not standardized with regard to time of day, fasting condition, and symptom onset.
Each of the ex vivo thrombin generation parameters have its own significance related to hypo- and hypercoagulability. In a hypercoagulable state, both the LT and TTP have been reported to be shortened whereas the V T, pTG, and ETP levels were increased. 13 In our study, the VTE imaging verified patients were hypercoagulable with regard to in vivo thrombin generation compared to those without VTE, whereas ex vivo measured LT and TTP showed almost hypocoagulable states. These inverse thrombin generating patterns in vivo and ex vivo are in line with findings in patients with stable coronary artery disease, as well as acute myocardial infarction. 14,15 In these studies, ETP also showed an inverse pattern. It was speculated by the authors that the prothrombotic state reflected in an increased in vivo production of thrombin caused an exhaustion phenomenon which reduced the potential to generate thrombin ex vivo.
There were no differences in sTF levels between VTE-positive and VTE-negative groups. This is opposed to a study on patients with lower leg injuries where VTE was significantly associated with increased TF levels. 16 It should be emphasized that these patients were quite different from ours, and the high levels may be due to injury-induced TF release. We could, however, not show any significant correlation between sTF and LT which has been demonstrated in healthy individuals by others. 17 It has been suggested that LT reflects TF activity and that the presence of TF microparticles shortens the LT. 17 Lack of correlation may be due to the method used in our study which is total TF antigen and not TF activity or the amount of microparticle-associated TF activity. In addition, the concentration of TF used to trigger coagulation in the CAT assay (5 pM) might have influenced the LT results. This concentration is, however, the most used in comparable studies.
We found that age was significantly associated with in vivo thrombin generation assessed by pF1 + 2 and D-dimer which is in accordance with other reports. 14,18 However, age was inversely related to ex vivo thrombin generation measured by ETP, pTG, and VT and positively associated with LT and TTP. This is also in line with previous findings, 14 although contrasting results have also been reported. 19
Males had lower levels of F1 + 2 in plasma and urine compared to women; however, no differences in D-dimer and ETP levels were observed. This is to some degree in accordance with other reports. 14,20
In line with other reports, no differences in thrombin generation assessed by ETP were observed in patients with comorbidities such as cancer, infections, and cardiovascular diseases compared to those without, whereas the comorbid had increased levels of pF1 + 2, uF1 + 2, and D-dimer. 14,21 –23
Tobacco smoking has been connected with increased levels of pF1 + 2, D-dimer, and ETP levels. 14,24 Surprisingly, in our study, D-dimer, pF1 + 2, uF1 + 2, as well as sTF levels were found to be lower in smokers compared to nonsmokers. This may be related to the nonselected patients in our study and lack of data on the degree of smoking and smoking years.
The pF1 + 2 in plasma and urine were similarly associated with the group characteristics and with the measured ex vivo biomarkers, indicating that F1 + 2 in urine has the same potential to reflect procoagulant conditions as pF1 + 2.
This study has some limitations. It was based on routine examinations of the patients referred to the radiological department with suspected DVT or PE. Due to restricted time, information on medical history and in particular medications may have been missed. Although all primary radiologists were instructed to get a second opinion by an experienced senior radiologist in cases of diagnostic uncertainty, there were risks for diagnostic misjudgment. Variations in the time of blood sampling have, as discussed, probably also impacted our results.
In summary, this study on nonselected patients with clinically suspected VTE showed a comparable pattern of ex vivo and in vivo thrombin generation when adjusted for covariates, although some thrombogram parameters showed an opposite picture.
The F1 + 2 measured in urine seems to reflect ex vivo thrombin generation in the same manner as pF1 + 2, which indicates that urine may be an attractive substrate to quantify a procoagulant state.
Footnotes
Acknowledgments
We thank our staff at the Department of Radiology and Department of Biochemistry. Special thanks to Tor E. Gudmundsen, Anniken Haslund, and Ferencz Laszlo for their support in the study period. Vibeke Bratseth MSc is acknowledged for her excellent assistance in laboratory work.
Declaration of Conflicting Interests
The author(s) declared no potential conflicts of interest with respect to the research, authorship, and/or publication of this article.
Funding
The author(s) received no financial support for the research, authorship, and/or publication of this article.