
Abstract
Introduction:
Intermittent pneumatic compression (IPC) is now a widely used therapy for the prophylaxis of deep vein thrombosis and pulmonary embolism. In general, the IPC sequence is composed of sequential compression and simultaneous deflation. Typically, veins are considered to be squeezed and emptied during the compression phase and to be refilled during the deflation phase. However, because the stop or sudden increase in blood flow can be dangerous, a further investigation is needed with respect to the blood flow.
Materials and Methods:
We demonstrated a new compression protocol based on the investigation results of venous blood flow during IPC. This new compression protocol involves successive compression without the deflation phase; thus, the expelled blood volume flow during a given period can be maximized. To investigate the blood flow during IPC, sonography movie clips and in-laboratory developed blood flow analysis software was used.
Results:
The increases in the peak volume flow during IPC were 49% (±24%) and 25% (±29%) with the conventional protocol and the new protocol, respectively, whereas the total volume flow (TVF) was not significantly changed (−1.0% and −13.0%, respectively). With the new protocol, the peak velocity (PV) was 49% lower than that with the conventional protocol. Thus, the new protocol has an effect of maintaining TVF without resulting in a sudden large increase or decrease in PV.
Conclusion:
The new suggested protocol might improve safety because it can maintain the stability of blood flow by reducing the risk of blood stasis and a rapid change in blood flow.
Introduction
Intermittent pneumatic compression (IPC) is considered as a general therapy to reduce the risk of deep vein thrombosis (DVT) or pulmonary embolism after surgery. 1 –4 In particular, in cases with an additional risk of bleeding, IPC devices are accepted as an effective alternative because thrombolytic or anticoagulant agents could be dangerous. 5,6
Intermittent pneumatic compression using an electromechanical device was introduced in the early 1970s, and several clinical trials have reported its clinical effects since. 7 –10 However, questions about the effectiveness and safety of IPC are still continuously raised. The reason for this may be the lack of a clear scientific causal relationship between IPC and prevention of blood clots. 11 Some studies have attempted to demonstrate an increase in fibrinolytic factors as the scientific basis of the effectiveness of IPC in preventing thrombosis. 11 –13 Other studies have focused on changes in hemodynamic variables after the application of IPC. 14 –19
Few studies have however investigated the real-time changes in blood flow in the vein during pneumatic compression. 18,20,21 This is likely because of the nonavailability of appropriate tools and methods for real-time measurement of blood flow. While Doppler sonography has been used in many studies on DVT, it provides images of blood flow that show the movement distribution of blood particles for only a short period (about 30 seconds). Conventional Doppler sonography equipment may provide values of some hemodynamic variables such as peak velocity (PV), mean velocity (MV), peak volume flow (PVF), and total volume flow (TVF), but these results can be obtained only after the measurement is complete, and not in real time, during the measurement. Therefore, it cannot be used to demonstrate or record the dramatic changes in blood flow that occur during IPC.
In this study, movie clips of screen shots captured during Doppler sonography were used to analyze real-time changes in blood flow during IPC. In addition, a software tool was developed that could detect and extract changes in the blood velocity and the thickness of the venous vessel at a particular measurement point—the superficial femoral vein—from the movie clips. Based on the extracted blood velocity data, the effective component of IPC was determined using frequency analysis and signal filtering. The filtered velocity waveform showed the dramatic changes in blood flow during the inflation and deflation phases, making interpretation of blood flow during IPC possible.
Currently, a variety of IPC devices are being used in clinical therapy, and each device has a different protocol. 22 In brief, a pair of cuffs (or sleeves) containing 1 or more chambers (or bladders) are worn around the legs, sometimes including the feet, and then air is blown into the chambers sequentially. Most IPC devices have a deflation phase, during which the air filled in the chambers is freely released at the same time. Because blood vessels regain their original shape and are refilled with blood during this phase, the deflation phase is also known as the refill time.
The required refill time varies according to patient and posture, and therefore, the validity and sufficiency of a fixed deflation time have been questioned. Recently, a new device that can detect blood refill and automatically adjust the deflation time was developed to actively deal with varying refill times. 15,23,24
In this study, a new compression protocol in which the deflation phase was eliminated from the conventional protocol was developed in an effort to investigate the validity and safety of the deflation time and develop an effective compression protocol. On investigating and comparing real-time changes in hemodynamic variables during IPC with or without the deflation phase, the validity and safety of the new suggested protocol were found to be reasonable.
Materials and Methods
Participants
This study included 30 healthy volunteers enrolled between July and October 2014, after approval from the clinical trial commission of the Korea National Cancer Center (NCC2014-0041).
Thirty healthy volunteers were randomly divided into group A and group B before sonography examination. In group A, blood flow was recorded at a resting state (baseline) and under compression with a conventional protocol (mode-1). In group B, blood flow was recorded at baseline and under compression with the new suggested protocol (mode-2). Sonography examination and IPC device operation were conducted by different persons who were blinded to the group designation of the participants. After measurement, any personal information was not used except movie clips. Because the movie clips for 4 participants were damaged while storing them on the device, 13 samples in each group could be analyzed.
The Device and Equipment
DVT-3000 (DS MAREF, Korea) was used as the IPC device. It had a fixed cuff pressure and deflation time of 40 mm Hg and 24 seconds, respectively. DS212 soft cuff (DS MAREF), which is compatible with DVT-3000, was used as a cuff. It has 3 chambers, 1 each compressing the lower calf, upper calf, and thigh. The distances between chambers were 17 and 27 cm, respectively.
Ultrasonography was performed using iU22 xMATRIX (Phillips Ultrasound, Bothell, WA, USA) with a 12.5-MHz, 50-mm linear array transducer; measurements were recorded in duplex mode.
Protocols
Compression using the IPC device was conducted for both legs, but measurements were performed only at the right superficial femoral vein. Therefore, the measurement position was different from the compressed positions and was located more proximally. After fastening the cuff around the legs, the connection status of air tubes and pressure safety were tested for about 30 seconds. Several cycles of IPC were performed for stabilization of blood flow before starting the measurement. Each movie clip included the measurement screen during at least 3 cycles of IPC. For subjects in group A, measurements were performed twice alternately at the resting state and under IPC with mode-1; similar measurements were performed for the subjects in group B, with IPC being performed with mode-2.
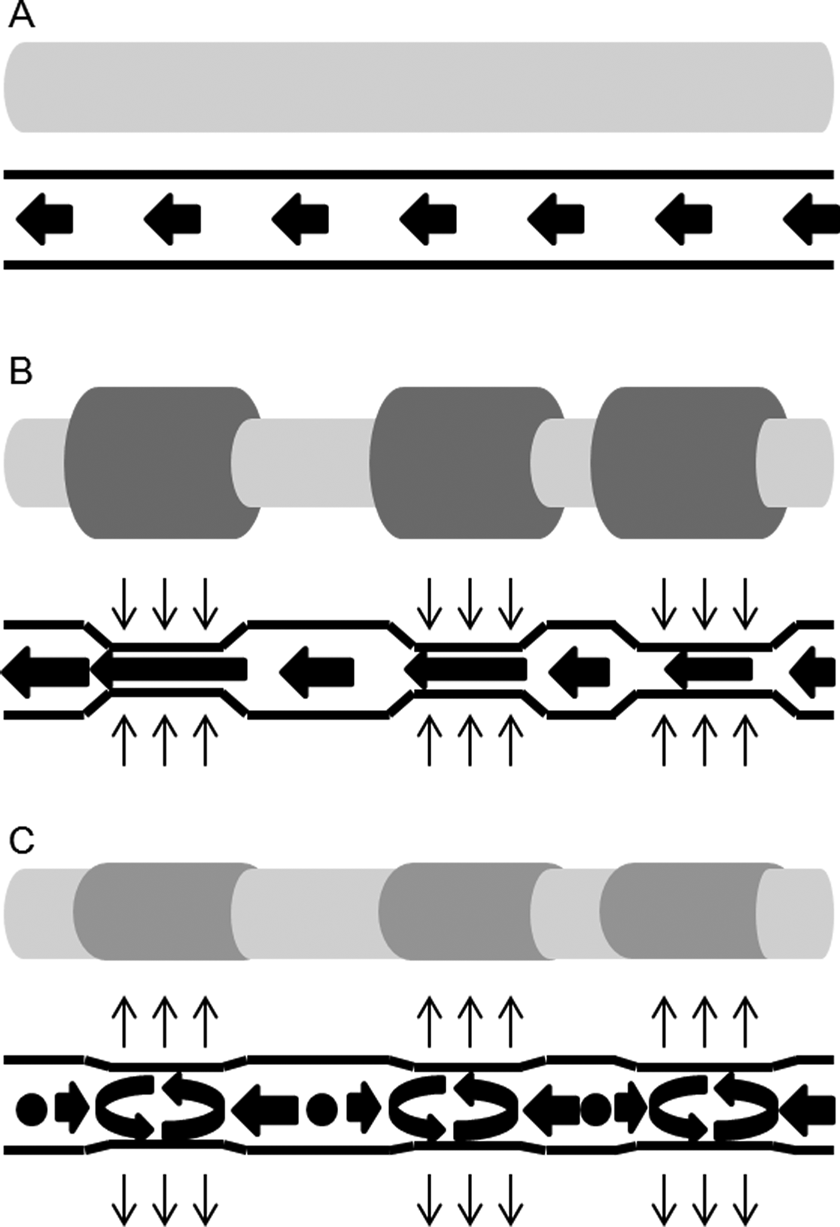
Mode-1 (conventional compression mode)
Mode-1 comprised inflation and deflation phases. The duration of the deflation phase was fixed at 24 seconds, whereas the duration of the inflation phase could change depending on the inner pressure of each chamber. The air inflation status of each chamber over time is shown in Figure 1A.
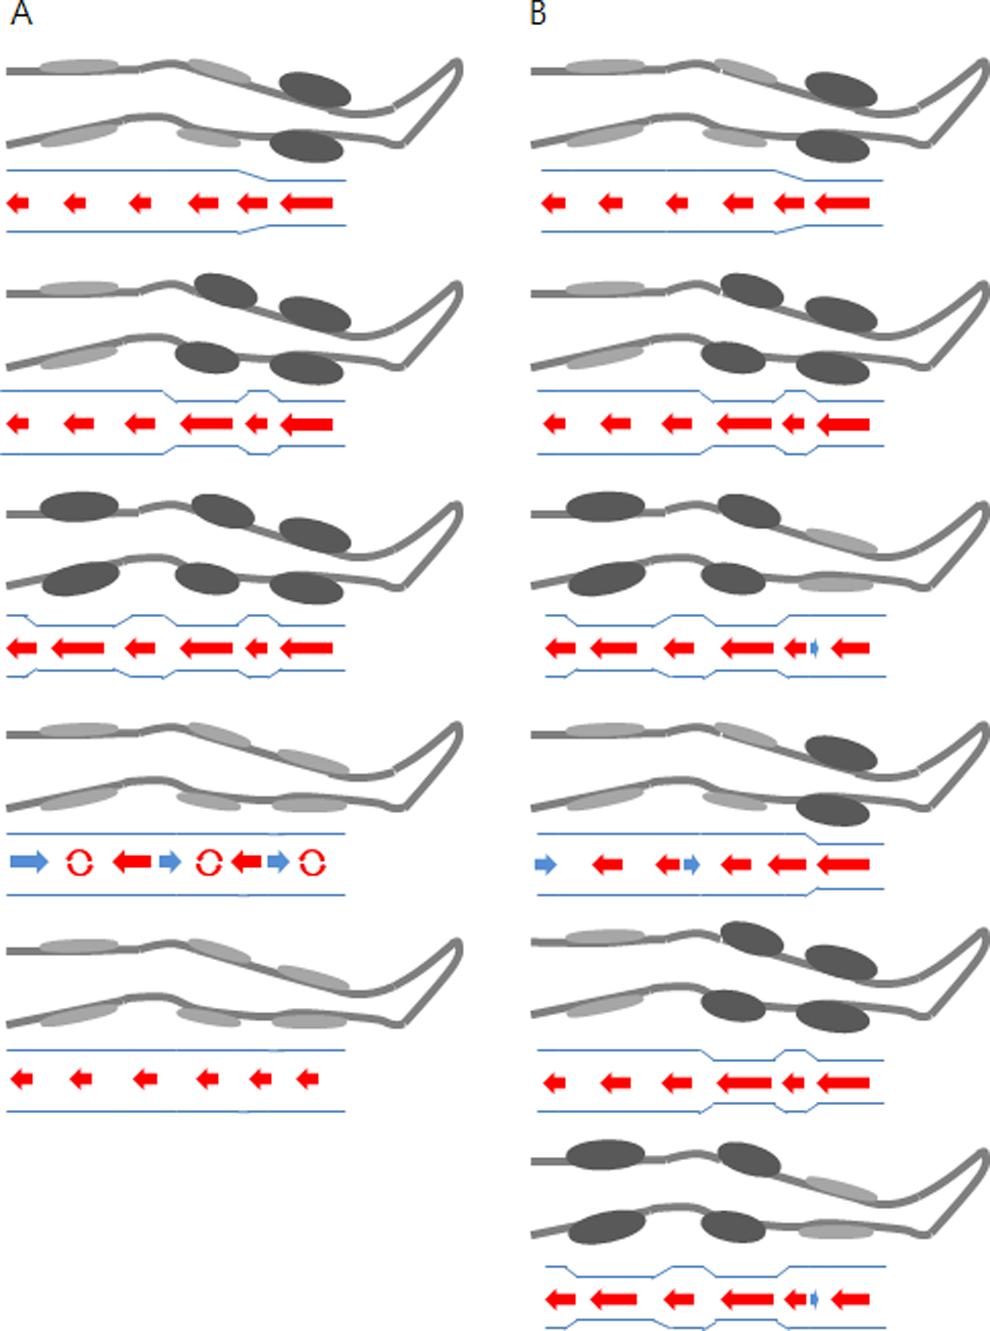
Compression protocols. Inflation is represented by swelled (painted dark) chambers. A, Mode-1: Lower calf, upper calf, and thigh are sequentially compressed and maintained in compression status before the chambers simultaneously begin deflation. B, Mode-2: Only 2 or less chambers are continuously compressed without deflation phase. Under each figure, blood flow status is shown.
Briefly, compression proceeded from the lower calf to the upper calf and then to the thigh during the inflation phase, and the pressure of the 2 calf chambers was maintained until the thigh chamber pressure reached the target value. Then, the deflation phase was started, with the air that filled the chambers being naturally released simultaneously.
Mode-2 (suggested compression mode)
The air inflation status in mode-2 is represented in Figure 1B. In mode-2, the number of chambers under compression was maintained at less than 2, and a separate deflation phase did not exist.
Data Processing
The iU22 xMATRIX screen provides a real-time blood flow distribution diagram. However, because this diagram is initialized every 30 seconds, complete cycles of the IPC cannot be represented. Further, because this diagram has not been designed for analysis but for visual demonstration of blood flow, the instantaneous blood velocity is not represented by a numerical value. Furthermore, the thickness of the veins on the ultrasound image can be visualized but is not quantitatively measured or stored for further processing.
In this study, sonography screens during compression with the IPC device were stored as movie clips, which is a supporting function of iU22 system, and data on instantaneous blood velocity and vein thickness were then extracted from each frame of the movie clip by a laboratory-developed, image-processing software program. This program can not only graphically represent the changes in blood velocity and vein thickness as a function of time during the entire sonography measurement but also calculate a variety of hemodynamic parameters such as PV, MV, PVF, TVF, and expelled volume flow (EVF). In addition, these numerical data can be stored as files for further analysis.
Calculation of Hemodynamic Parameters
The velocities of the blood particles are represented as dots in the blood flow distribution diagram in each frame of the sonography movie clips. The dot varies in intensity according to the number of particles with the same velocity. Because the distribution of blood particle velocities at a specific instant needs to be represented by a value, the mean square velocity is calculated and used as the instantaneous velocity (IV), calculated as follows:
Ii represents the number of particles with the same velocity, which is shown by the intensity of the dot on the measurement screen. The root mean square of the velocities (Vi ) of blood particles (Ii ) is calculated and defined as IV. Instantaneous velocities are acquired at pixel units and are then converted into time units. Time units could not be directly used because they could vary according to the screen setting. All hemodynamic parameters were calculated based on the IV. However, in the case of PV and PVF, the velocity value was not based on IV but on the maximum velocity of the blood particles for consistency with existing literature.
Vein Thickness
Vein thickness data were extracted from each frame of the movie clips because this varies with various factors, especially compression status, during measurement. When calculating blood volume flow, variation in vein thickness is an important factor because it affects blood volume flow by a squared value. The initial measuring region, the so-called region of interest, was manually determined before image processing. Then, image-processing techniques such as histogram equalization, Otsu thresholding, and image binarization were applied to detect the vein walls and measure the thickness. When calculating blood flow velocity and when measuring the vein thickness, pixel scale was automatically adjusted using the software program because it depends on the image zooming status.
Blood Volume Flow Calculation
Venous blood flow was measured as 3 different variables. First, PVF represents the blood volume flow during 1 second around a time point when the highest IV is observed. Second, TVF refers to the blood volume flow during 1 cycle of IPC, and its unit is mL/min. Finally, EVF indicates the blood volume flow only during the inflation phase, and its unit is L/h. In mode-2, there is no deflation phase, and so TVF and EVF represent the same amount of blood flow although their units differ. At baseline, because EVF is meaningless as compression is not applied, only PVF and TVF were measured and were used to compare mode-1 and mode-2.
When PVF, TVF, and EVF were calculated, IV was used without filtering, and the thickness of the vein was extracted in a frame-by-frame manner. The section of the vein was assumed to be a perfect circle. Blood flow was calculated by multiplying the surface area of the section with the IV (mL/sample), and the value was then converted to minutes. For consistency with previous studies, PVF and TVF values were converted to values with mL/min as the unit, and EVF values were converted to values with L/h as the unit.
Data Normalization
On examining IV graphs, the individual differences were found to be significant even in the resting state. Therefore, the individual differences had to be normalized to compare the effects of mode-1 and mode-2. For the normalization, the rate of change was calculated by dividing the change in the amount with the baseline value. The reason for the use of the rate of change and not the amount of change is described in the discussion section.
Results
Duplex Sonography Video Configuration
The software program developed in the laboratory was used to successively extract the blood flow velocity and vein thickness data from Doppler sonography movie clips (Figure 2).
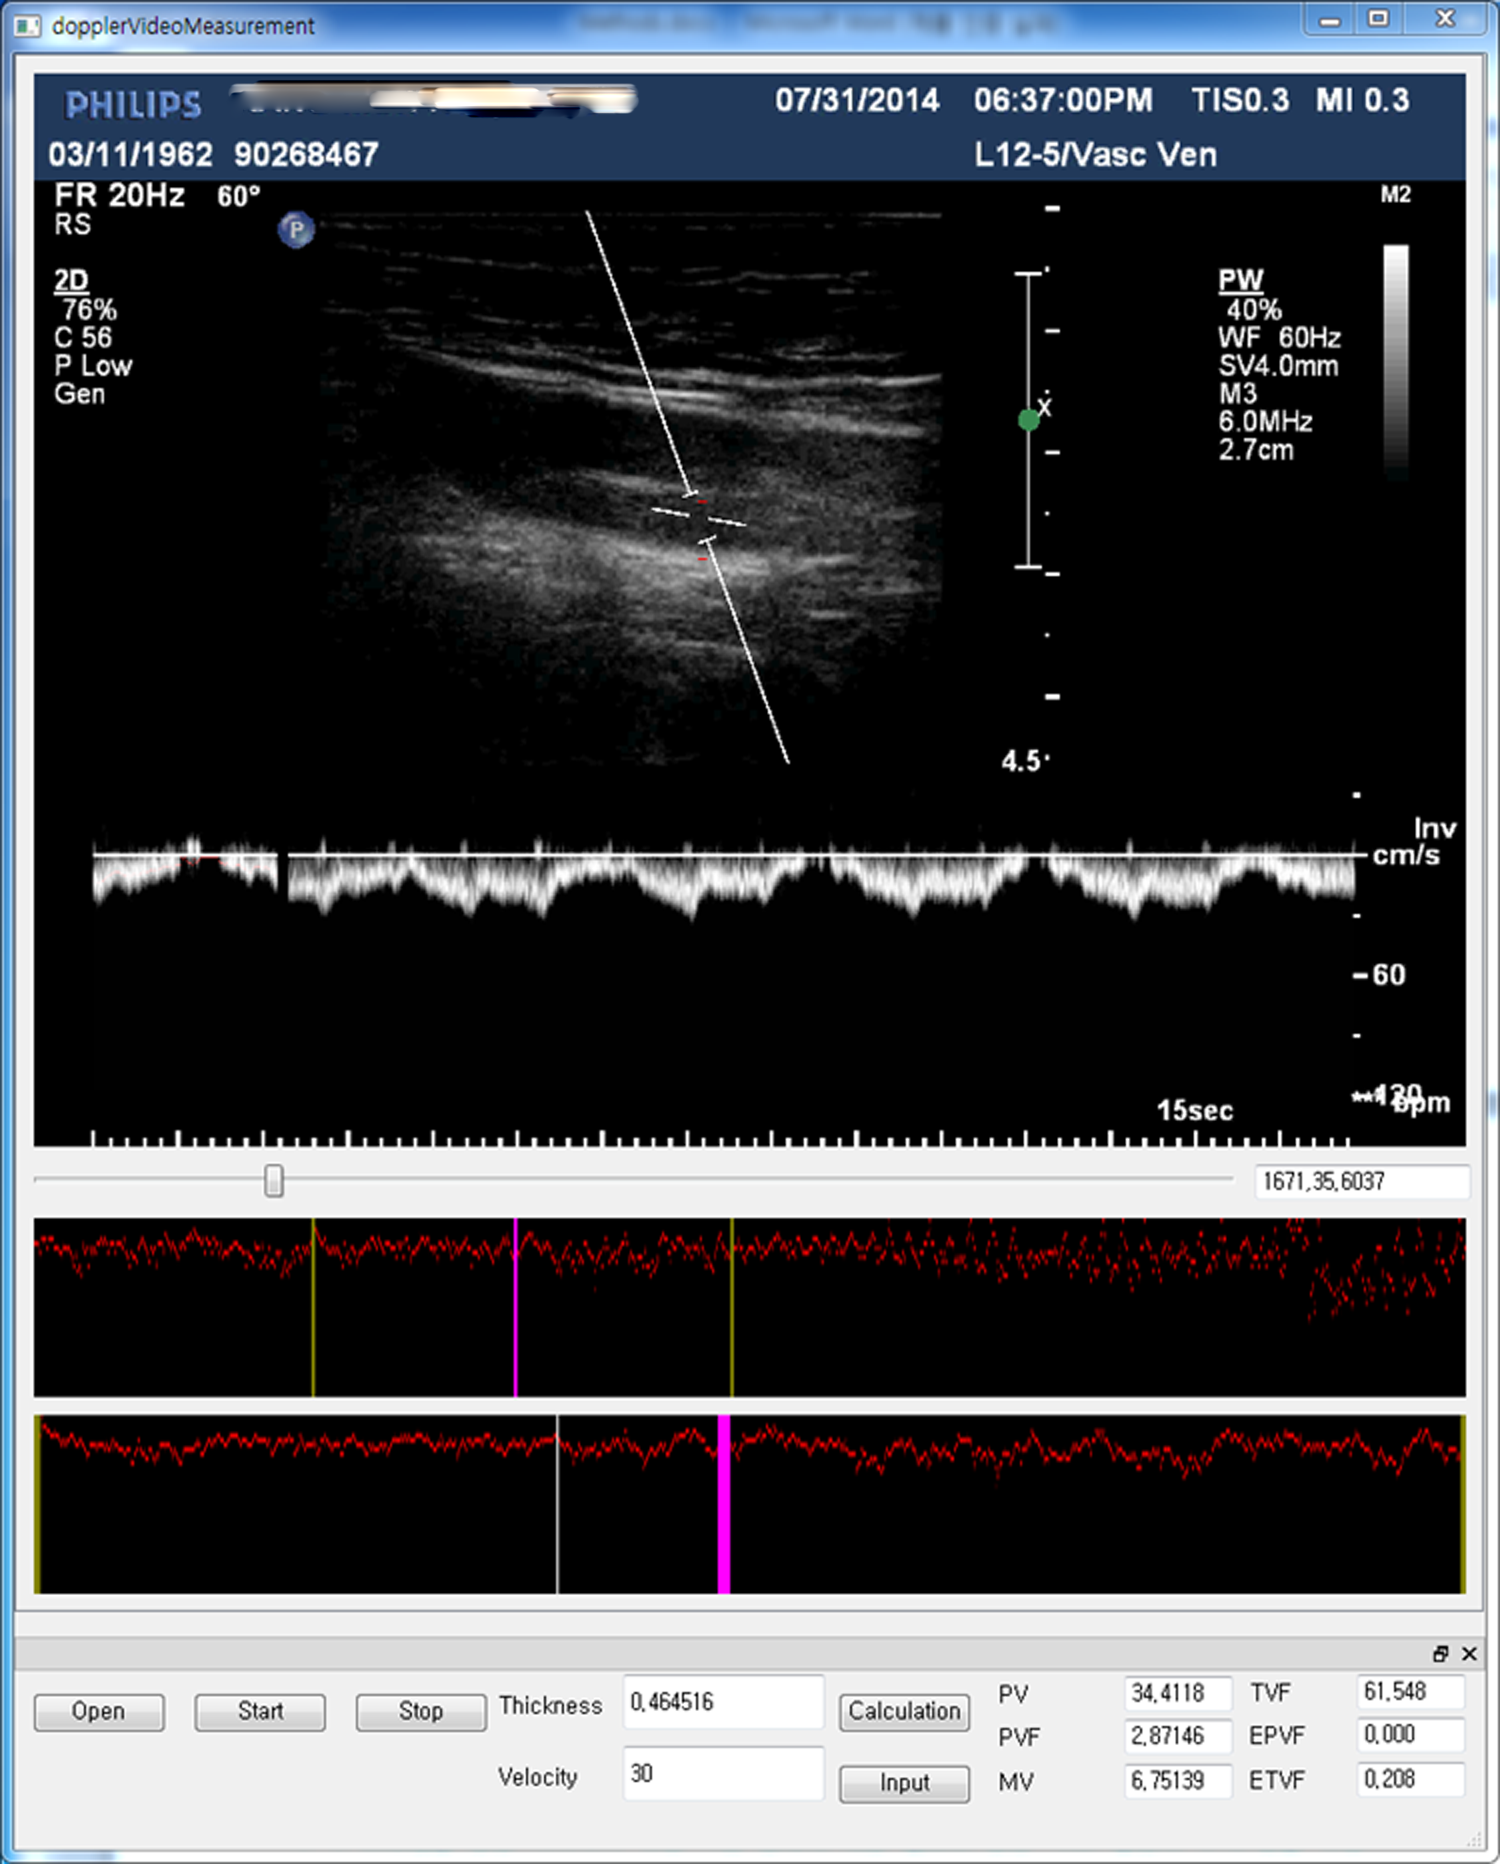
Blood flow analysis program. When a movie clip is played, instantaneous velocity (IV) and vein thickness are extracted from each frame image. After playing, hemodynamic variables are calculated by indicating start and end positions of a cycle and an inflation phase, respectively.
Immediately after the processing of each movie clip, instant blood velocities and vein thickness values were presented as waveforms below the movie clip. By pushing the calculation button after setting the start and end points of compression on the instantaneous blood velocity waveform, a series of blood volume flow values, including PVF and TVF, was calculated and presented at the bottom of the program. For the further analysis, the IV and thickness values from each movie clip were saved in files. A waveform of vein thickness is shown in Figure 3A. In this figure, the average thickness of the vein at the measuring point is 0.648 ± 0.011 cm.
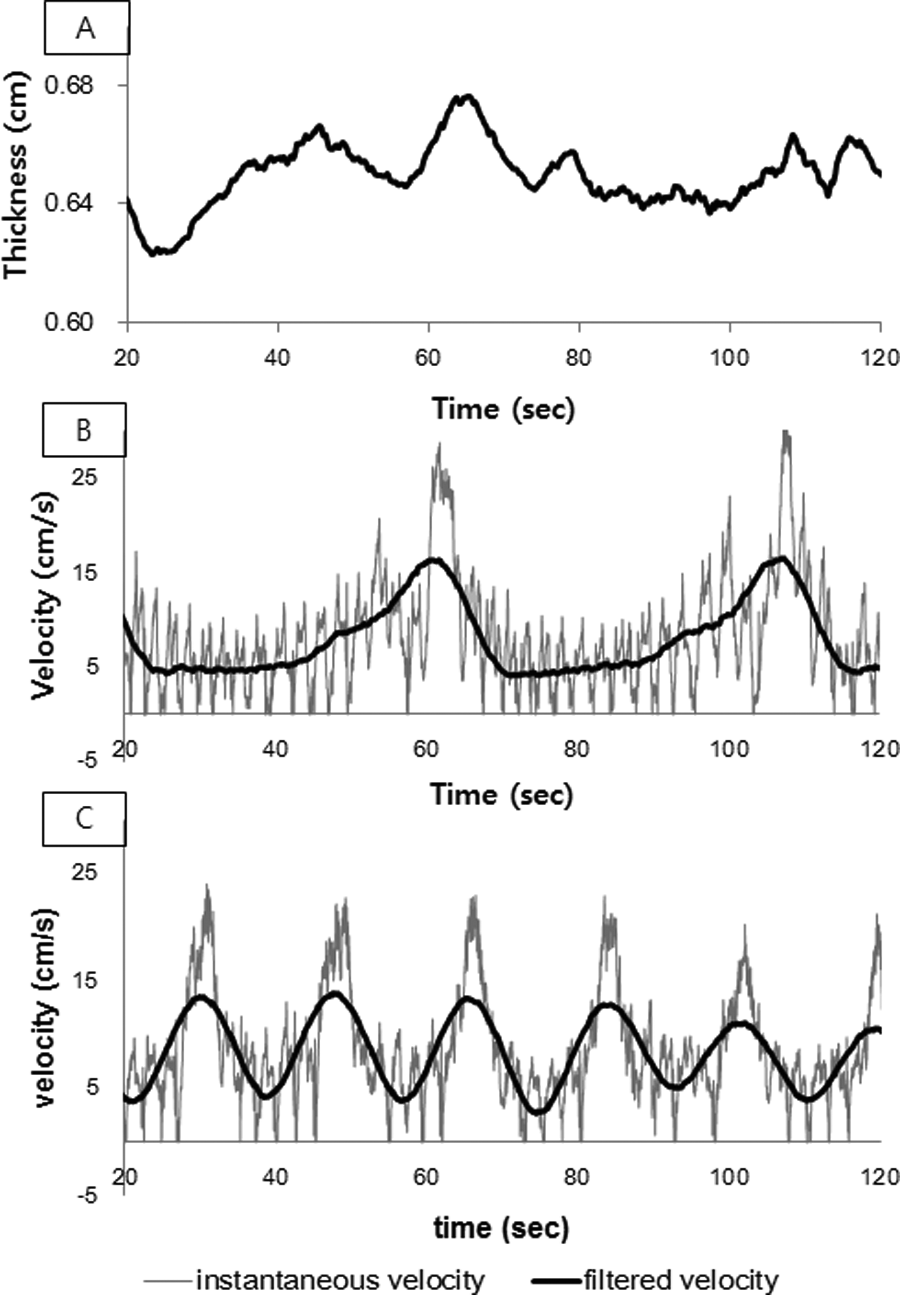
Graphs of vein thickness (A), blood velocity in mode-1 (B), and mode-2 (C) during intermittent pneumatic compression (IPC).
Compression Protocols
Mode-1 (conventional compression mode)
The cuff used in this study had 3 chambers, 1 each compressing the lower calf, upper calf, and thigh. The measuring point was the superficial femoral vein, which was more proximal than the compression points. The conventional compression protocol was referred to as mode-1. In this mode, after the lower calf was compressed, compression of the upper calf was started with the lower calf being in the compressed status; thigh compression was begun as soon as the upper calf compression was stopped, with both the lower calf and the upper calf in the compressed state. After compression of all 3 chambers were completed, deflation of the chambers was conducted for 24 seconds. The instantaneous blood flow velocity in the superficial femoral vein during mode-1 is presented as a graph in Figure 3B; the instantaneous blood flow velocity is shown as a periodic signal containing a high noise component, with the noise also shown as a periodic feature.
When the noise component was observed with sonography equipment, which only displays a very short duration of measurement, it seemed to be completely periodic and due to respiration. To analyze the changes in blood flow induced specifically by IPC, a 0.1-Hz low-pass filter was designed. This low-pass filter could exclude the effect of either respiration or pulse. The filtered result was overlaid on the nonfiltered waveform. The phase shift that occurred with the finite impulse response filter was adjusted to facilitate better understanding. On observing the filtered waveform, distinct periodicity was observed, with a 46-second period, which matched the IPC cycle. Because the deflation time was fixed at 24 seconds, the remainder of the period comprised the time for compression of the 3 chambers, but it was not possible to distinguish between the sections to compress the respective chamber. From the starting point of both the inflation and the deflation sections, the blood flow velocity was seen to rapidly reduce as soon as the deflation phase begun.
Mode-2 (suggested protocol)
In the suggested compression protocol (mode-2), a distinctive deflation phase did not exist; furthermore, at no instant were all 3 chambers in a compression state simultaneously. The instantaneous blood flow velocity in the superficial femoral vein during mode-2 is presented as a graph in Figure 3C; the instantaneous blood flow velocity showed simpler periodicity, but a noise component owing to respiration and pulse was still seen fluctuating.
The filter used with mode-1 was applied, and phase shifting was adjusted as with mode-1. The period of the filtered waveform in mode-2 was about 18 seconds, shorter than that with mode-2. The waveform of blood velocity with mode-2 was pure sinusoidal. The amplitude was decreased, but the minimal value was maintained over zero. The decreased amplitude indicated a reduced risk of stasis or reflux, and a lack of blood due to elimination of the deflation phase was not observed.
Statistical Analysis
Blood velocity and blood flow during the compression protocols are presented in Table 1. Peak velocity and PVF were significantly different with mode-1 and mode-2 (P = .002 and P = .031, respectively), but the MV and TVF were not (P = .103 and P = .266, respectively); in the resting state, none of the 4 variables, PV, MV, PVF, and TVF, were significantly different between group A and group B.
Hemodynamic Variables According to Compression Mode.
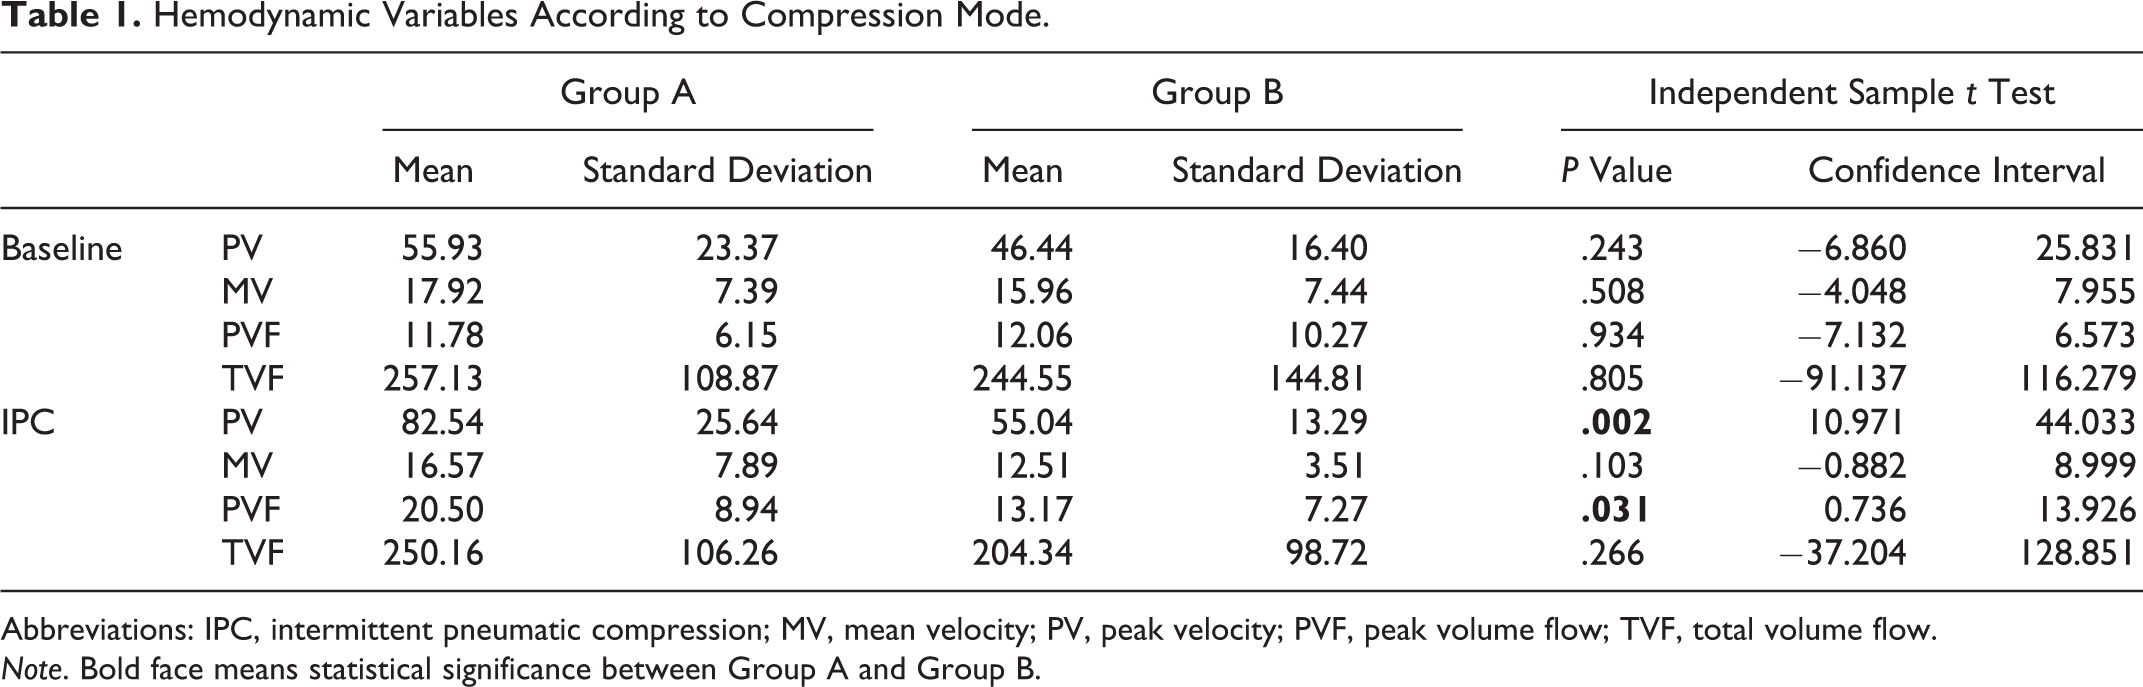
Abbreviations: IPC, intermittent pneumatic compression; MV, mean velocity; PV, peak velocity; PVF, peak volume flow; TVF, total volume flow. Note. Bold face means statistical significance between Group A and Group B.
Before analyzing the effect of IPC, each hemodynamic variable was normalized to express the rate of change because the amount of change was too dependent on individual differences.
When mode-1 was applied, instantaneous PV and PVF were increased by 49% and 89%, respectively. P values of PV and PVF were all less than .001. Mean velocity and TVF were hardly changed (group A in Figure 4; Table 2).
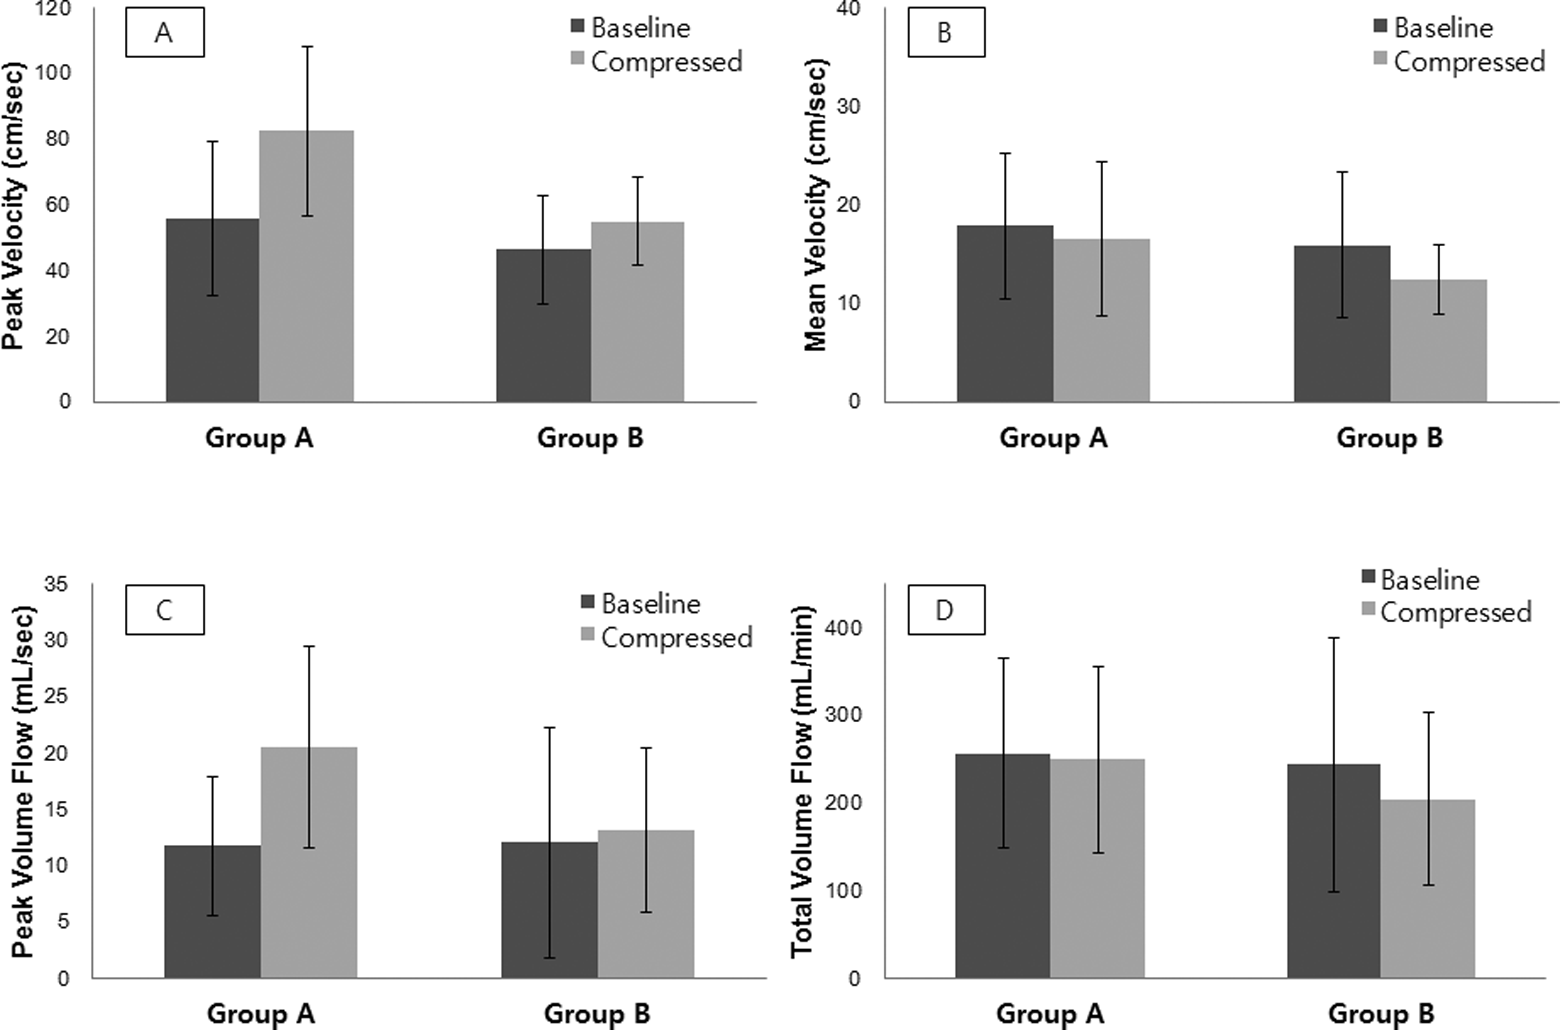
Peak velocity change (A), mean velocity change (B), peak volume flow change (C), and total volume flow change (D) in groups A and B.
Hemodynamic Changes in Group A (After Normalization).
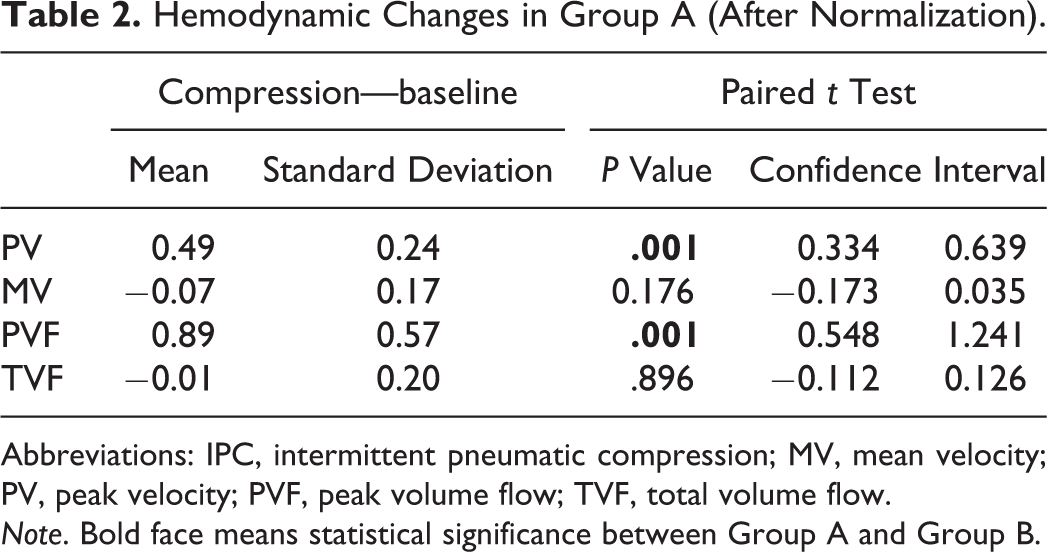
Abbreviations: IPC, intermittent pneumatic compression; MV, mean velocity; PV, peak velocity; PVF, peak volume flow; TVF, total volume flow. Note. Bold face means statistical significance between Group A and Group B.
With mode 2, PV and PVF were increased by 27% and 48%, respectively. P values were .006 and .001, respectively. However, MV and TVF were marginally decreased by 10% and 6%, respectively. The changes in MV and TVF were not statistically significant (group B in Figure 4; Table 3).
Hemodynamic Changes in Group B (After Normalization).
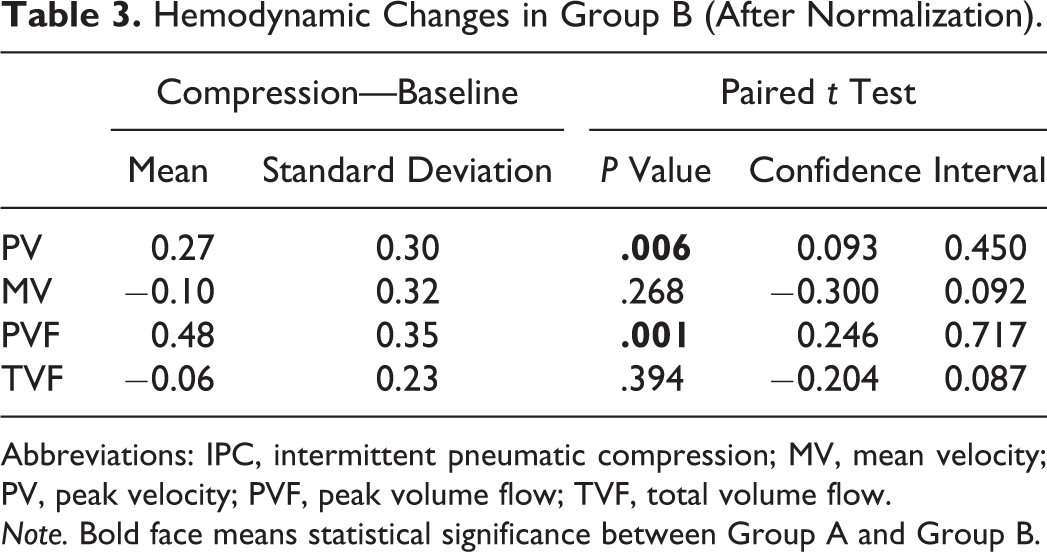
Abbreviations: IPC, intermittent pneumatic compression; MV, mean velocity; PV, peak velocity; PVF, peak volume flow; TVF, total volume flow. Note. Bold face means statistical significance between Group A and Group B.
On comparing the 2 groups, the changes in PV and PVF in group B were significantly smaller than those in group A, with P values of .036 and .013, respectively (Figure 5; Table 4). The mode-2 compression protocol in group B showed the effect of reducing the PV and PVF by half (Figure 5).
Compression Effect in Mode-1 and Mode-2.
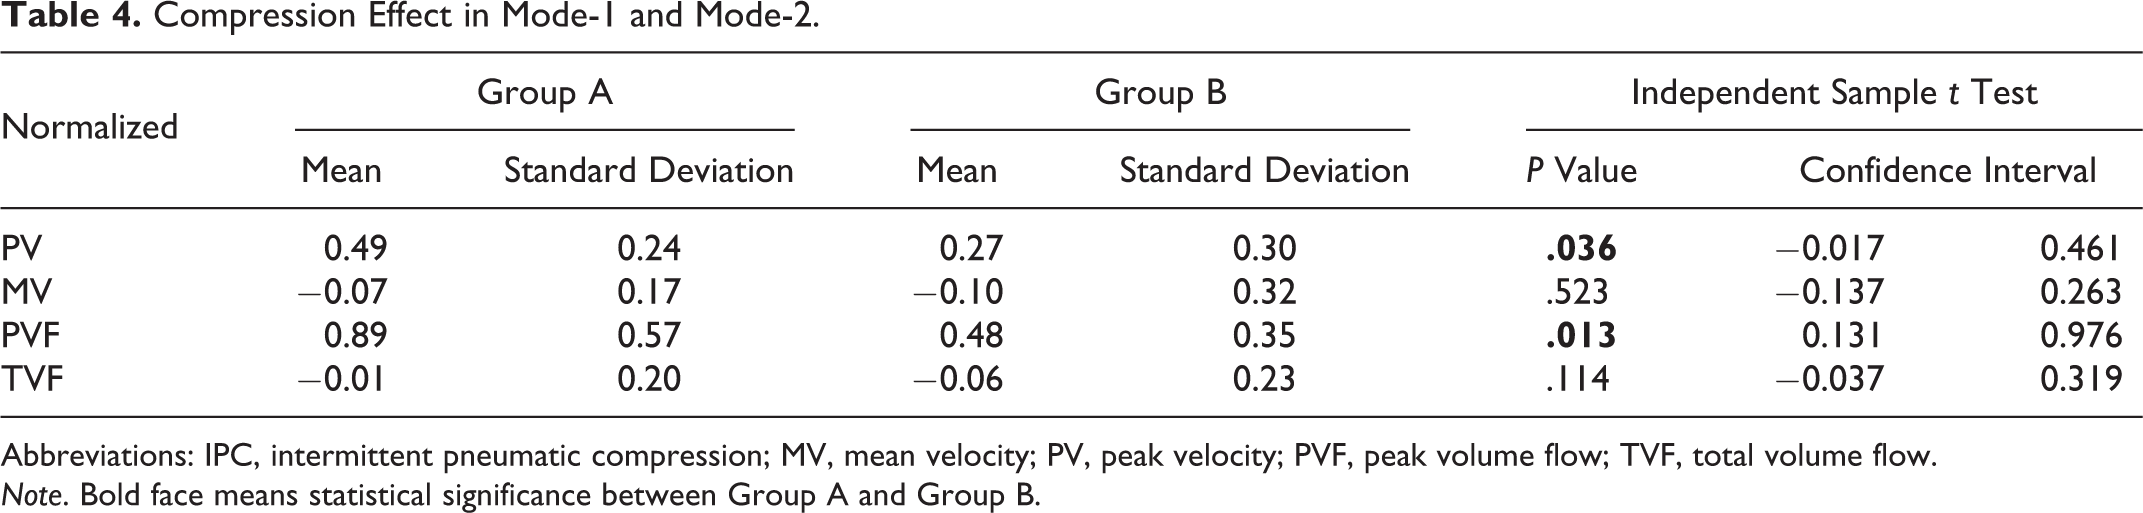
Abbreviations: IPC, intermittent pneumatic compression; MV, mean velocity; PV, peak velocity; PVF, peak volume flow; TVF, total volume flow. Note. Bold face means statistical significance between Group A and Group B.
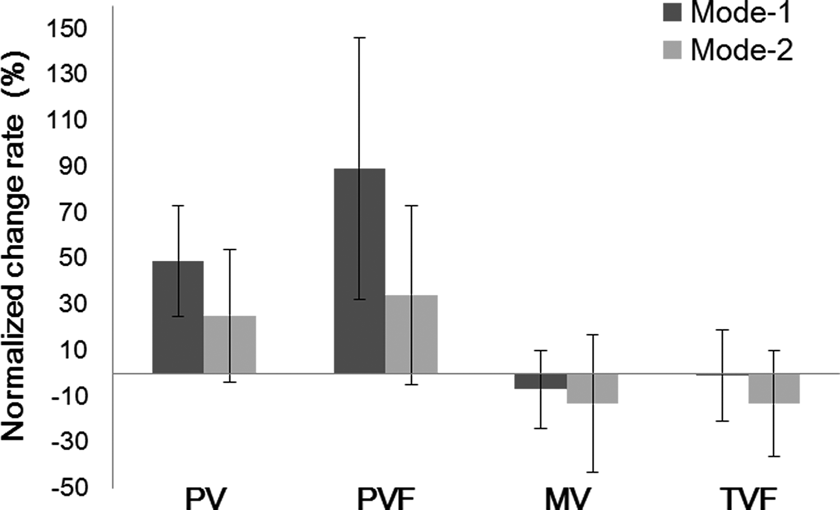
Normalized change rate in groups A and B. The changes in peak velocity (PV) and peak volume flow (PVF) in mode-1 are significantly larger than mode-2, but the changes in mean velocity (MV) and total volume flow (TVF) are negligible.
In summary, in both group A (mode-1) and group B (mode-2), PV and PVF were increased, but MV and TVF were slightly decreased or maintained during compression. The increasing effect of PV and PVF was reduced in group B.
Discussion
The use of IPC devices for prevention of thrombosis is gradually becoming a standard therapy. In particular, for patients with a high risk of bleeding, IPC has become the only means of thrombosis prophylaxis because chemical thrombolytic agents cannot be used. However, evidence of how IPC prevents thrombus is not clear; thrombolytic agents directly dissolve clots. The reason for the lack of clear evidence is the nonavailability of proper means and methods with which researchers can investigate the changes in the body, especially changes in blood flow, during IPC. In this study, Doppler sonography movie clips and a laboratory-developed software program were used to investigate the changes in blood flow during IPC. The software program could extract data on the velocity of blood flow and the thickness of the vein from the movie clips by image-processing technology and could also save changes in these variables in files.
By examining the Doppler sonography movie clips, it was found that blood flow was not constant but highly variable and that the blood particles had a wide range of velocity distribution according to their position in the vein and other factors such as pulse and respiration. To design efficient IPC devices, understanding such variable blood flows correctly should be a reasonable starting point. First, blood particles in the center of the vein show the fastest velocity distribution and those near the vessel wall run slowly because of resistance due to friction. The so-called blood velocity refers to the average value of the particle velocity distribution of blood flowing through a section of the blood vessel. In this study, instantaneous blood velocity was defined as the root mean squared value of particle velocity distribution at a certain time at the measuring point. The change in this IV can be represented as a function of time, and the graph of this function includes many factors, which can be mistaken as noise. To exclude the noise factors and investigate only the change in blood flow due to IPC, frequency analysis was conducted for the IV function. Pulse and respiration were found to have considerable effects on the velocity waveform, and these effects had to be eliminated. Because of these factors, analyzing the blood velocity without signal filtering can be very difficult, and errors are likely to occur. In this study, a low-pass filter with a 0.1-Hz cutoff frequency was designed to filter out the relatively high-frequency components such as pulse and respiration from the blood velocity waveform. Through the filtered graph, the effect in the bloodstream when IPC was applied could be determined.
The most notable change in blood flow during IPC was a sudden and steep decline in IV as soon as the deflation phase started. Conventional IPC devices have 2 operational phases, the inflation and deflation phases. During the inflation phase, air is blown into the chambers in cuffs (or sleeves), veins are compressed by the inflated chambers, and the blood in the vein is squeezed out. During the deflation phase, the air filled in the chambers is released, the veins are decompressed, and blood flows into the decompressed veins faster than usual. Thus, the deflation phase is also called the refill time. Based on the filtered blood velocity graph, 2 distinct sections exist in the deflation phase. Instantaneous blood velocity decreases rapidly in the first section but is gradually restored to a normal state in the second section. The reason for the decline in blood flow velocity in the first section is the decompression effect not the sustained compression effect. The decompression effect can be explained by the negative pressure in the blood vessel (Figure 6). When the compressed vessel starts expanding to the normal state in the deflation phase, negative pressure is instantly generated in the inner vessel. This negative pressure pulls blood into the decompressed vessels from the proximal veins as well as the distal veins. Thus, the blood flow at the measuring point, which is more proximal than compression point, appears slowed down and sometimes stopped. The veins of a healthy person have valves to prevent blood from flowing backward, but if a strong negative pressure is generated, the valves’ function cannot be guaranteed and the possibility of backward flow exists which is not desirable. Some researchers reported that a kind of turbulence might occur in the vein when negative pressure is generated in the varicose vein. 25 It should be considered that generating a harsh environment in the vessel could bring about unexpected changes in blood flow. In this situation, blood cells could be destroyed to create blood clots. Because most of the IPC device are using the natural exhaust way, they cannot control the generation of the above-mentioned negative pressure and the steep decrease in IV. In addition, in the conventional protocol, the negative pressure can become higher than in suggested protocol because the entire leg will be under the negative pressure at the same time. In this case, it is necessary to be careful of stronger backward flow corresponding to higher peak velocity. Therefore, without further action, the high peak may also be dangerous because the deep and steep valley in blood flow depends on the peak velocity. However, further studies on the risk of a steep increase and decrease in blood flow velocity are required.
Blood flow diagram during intermittent pneumatic compression (IPC). It describes the relation between thickness in blood vessel and the blood velocity during IPC. In this situation, hemostasis and turbulence may occur owing to the negative pressure in the vessels. (A) At resting status, (B) in inflation phase, and (C) in deflation phase.
In this study, a new compression protocol was suggested, which mimicked a 2-hand massage, so only 2 chambers could be compressed at a time and at least 1 chamber was always under compression. Each chamber was individually inflated and deflated. This protocol can not only relieve patients’ concern about device malfunction during the deflation phase but could also alleviate their stress of being excessively pressured when all 3 chambers are under pressure.
We examined whether the risk of blood flow stoppage was resolved with the suggested compression protocol. When the new protocol was applied, there were 2 differences in the blood flow velocity graph compared to the graph with the conventional protocol. These were the small amplitude and short duration, which were all reduced to less than 50% of those with the conventional compression protocol. The steep decline in blood velocity was still evident when the upper calf and thigh chambers were deflated and the lower calf was inflated simultaneously, but the amount of decline was substantially reduced. Here, the reduction in the negative pressure effect should be noted. Of note, venous blood flow was maintained in the forward direction, distal to proximal, even in the deflation phase. Consequently, the suggested compression protocol decreased the risks of the blood stasis and the instant high blood pressure due to the excessively fast blood flow. Although the reduction was small, this result shows that the alteration in compression protocol might affect the blood flow velocity profile and the steep variation in blood flow might be avoided. For example, the minimization of the negative pressure might be possible by slowing down the deflation rate. Furthermore, according to the analysis of the blood flow graph, a short duration might be more important and more effective than high pressure in the compression protocol design to prevent blood stasis and backward flow.
More consideration needs to be given to what changes occur in blood flow during IPC. Under compression, at first, muscles are tightened and then muscles narrow the blood vessels. As the vessels narrow, the blood flow velocity increases because the pumping pressure by the heart is maintained constantly. The increasing rate in blood flow is inversely proportional to the square of the blood vessel thickness. The shearing effect of IPC speed can cause some change in velocity, but the effect is negligible because this speed is much lower than the usual blood flow velocity. Because the change in the blood flow velocity by compression is due to the contraction of blood vessels, the increase in the blood flow velocity should be represented by the rate of change, and not by the magnitude of change, based on the baseline velocity value in the resting state. This rate of change might be an indicator of how well the effect of compression is delivered to the venous vessels.
Conclusion
In this study, the change in blood flow during IPC was analyzed using Doppler sonography movie clips, and a new compression protocol was suggested. Blood flow velocity was verified to be substantially affected by normal pulse and respiration as well as compression by IPC devices. By eliminating the effect of these normal components with signal filtering techniques, only the component changed by IPC application was extracted. From the filtered velocity graphs, it was found that a steep decrease in blood flow velocity occurred as soon as the deflation phase started and that the reason for this was the negative pressure in the vessel. Even in the filtered velocity graphs, the differences between participants were quite large, but the rate of increase was generally consistent.
The suggested compression protocol (mode-2) that did not include the deflation phase was compared with the conventional compression protocol (mode-1). The blood flow velocity in mode-1 was increased in the inflation phase but decreased in the deflation phase more significantly than in mode-2. In addition, in mode-2, the duration of 1 cycle was reduced by half because the time to reach the target pressure was shortened. Unlike with mode-1, any symptoms associated with the instant lack of blood such as blood stasis was not observed, and a stable sinusoidal waveform was maintained in the blood flow graph during mode-2 compression.
Statistical analysis was conducted to study the change in the hemodynamic parameters in both mode-1 and mode-2. Before IPC application, the baseline parameters were not statistically different between mode-1 and mode-2. Both PV and PVF were significantly increased during compression by 49% and 89% with mode-1 and by 27% and 48% with mode-2, respectively. However, MV and TVF were not significantly different. As a result, with the mode-2 protocol, the TVF could be maintained while reducing the PV and the PVF by half. These results are likely attributable to the reduced duration of each cycle due to the reduction in the inflation phase and elimination of the deflation phase. In addition, the mode-2 protocol reduced the likelihood of reverse flow near the compression point by reducing the amplitude of blood velocity. If it is accepted that the incidence of DVT was reduced by the variation in blood flow induced by IPC, shortening the compression cycle might be effective because this would induce greater blood flow.
This study was performed on healthy volunteers. Because blood flow in diseased limbs may have a different aspect, further studies in real patients are required. Authors hope the results in healthy limbs can be used as a kind of reference for future researches.
Footnotes
Authors’ Note
Kwang Gi Kim has now moved to Dept. Biomedical Engineering, Gil Medical Center, College of medicine, Gachon University, Docjeomro 3bun gil, 38, NamdongGu, Inchon, Republic of korea.
Acknowledgment
The authors thank the members of ultrasound room in National Cancer Center Korea. They gave a basic training on how to use the ultrasound equipment and set up the equipment day and night. The authors also appreciate the software engineers of DS MAREF who helped modify the firmware in accordance with the study design.
Declaration of Conflicting Interests
The author(s) declared no potential conflicts of interest with respect to the research, authorship, and/or publication of this article.
Funding
The author(s) disclosed receipt of the following financial support for the research, authorship, and/or publication of this article: This work was supported by the Technology Innovation Program (Grant: 10046763, “Development of multifunctional pneumatic compression device for lymph edema and DVT”) funded by the Ministry of Trade, Industry & Energy (Republic of Korea, ![]() ).
).