
Abstract
Background:
A documented relationship between ovarian cancer and thrombosis does exist. Low-molecular-weight heparins (LMWHs) are cornerstone drugs in the primary prevention and treatment of venous thromboembolic events in patients with cancer. However, cancer cells may alter the efficiency of these antithrombotic agents.
Objective:
We aimed to characterize the procoagulant phenotype of human epithelial ovarian adenocarcinoma cells, IGROV1, and to compare the capacity of tinzaparin and enoxaparin to inhibit thrombin generation triggered by these cells.
Methods:
Thrombin generation induced by different concentrations of IGROV1 cells on platelet poor plasma (PPP) was assessed by the calibrated automated thrombogram assay. Tissue factor (TF) expression was studied using Western blot analysis. Then, the experimental model of thrombin generation was used to compare the inhibitory effect of clinically relevant concentrations of both tinzaparin and enoxaparin. The inhibitory concentration 50 (IC50) of the mean rate index and the endogenous thrombin potential and the 2-fold increase in lag time were analyzed on the basis of the anti-Xa and anti-IIa activities of the LMWHs.
Results:
IGROV1 cells suspended into PPP resulted in a significant increase in thrombin generation in the absence of any exogenous source of TF and phospholipids. Tissue factor was expressed by IGROV1 cells. Tinzaparin was a more potent inhibitor of thrombin generation than enoxaparin. The inhibition of thrombin generation induced by IGROV1 cancer cells depended mainly on the anti-Xa activity of the LMWHs.
Conclusion:
This experimental study in ovarian cancer cells demonstrates that the antithrombotic activity of LMWHs is not completely predicted by the anti-Xa or anti-IIa activities measured in PPP.
Introduction
Venous thromboembolism (VTE) occurs frequently in patients with cancer and leads to an increased morbidity and mortality. 1 –4 It is well known that the VTE risk varies depending on the type of cancer. For instance, patients with pancreatic cancer or ovarian cancer are at higher risk as compared to those with breast cancer at the same stage of the disease. 5 The pathophysiology of thrombosis in cancer is complex but can be viewed classically as related to abnormalities described by Virchow triad (ie, stasis of the blood, vascular injury, and hypercoagulability). 6 Notably, constitutive expression of tissue factor (TF) by cancer cells triggers local and systemic activation of the coagulation process and is among the major cause of hypercoagulability. 7 The need for a suitable tool that identifies hypercoagulability and predicts thromboembolic complications in patients with cancer was therefore well documented. 8 Hence, classic clotting times have a very limited value in the detection of hypercoagulable states that lead to increased thrombosis risk. 9,10 Thrombin generation test (TGT) offers a direct global measurement of coagulation potential and detects hypercoagulable changes in the plasma particularly in patients with cancer. 11 –14 Moreover, TGT is a sensitive test that can be used to evaluate the efficiency of antithrombotic treatment with low-molecular-weight heparins (LMWHs). 15 –17 The LMWHs, tinzaparin and enoxaparin, are recommended for the treatment of acute phase and the secondary prevention of VTE in patients with cancer. They are used as prophylactic doses in patients with cancer at high risk for VTE. 18 –20 Thus, the comprehension of the mechanism of action of these LMWHs in cancer-induced hypercoagulability is a prerequisite for the optimization of the antithrombotic treatment. For this purpose, an experimental system for the modelization of hypercoagulability induced by cancer cells and the influence of the latter on the antithrombotic efficiency of LMWHs, fondaparinux, and the direct orally active anticoagulants has been developed and validated. 21 –24
The present study was designed to characterize the procoagulant fingerprint of human epithelial ovarian adenocarcinoma cells IGROV1 and to modelize the role of the anti-Xa and anti-IIa activities of tinzaparin and enoxaparin on thrombin generation triggered by the IGROV1 cells.
Materials and Methods
IGROV1 Cell Culture
Adhesive ovarian cancer cell line IGROV1 and normal human platelet poor plasma (PPP) were used for thrombin generation experiments. Human epithelial ovarian adenocarcinoma cancer cell line IGROV1 was obtained from Institut Gustave ROUSSY (Villejuif, France). IGROV1 cell line originating from an ovarian carcinoma of a 47-year-old woman was established in tissue culture and in nude mice. 22 Cells were cultured and expanded as described elsewhere. 21 Briefly, IGROV1 cells were cultured in Roswell Park Memorial Institute medium (RPMI)-1640 medium (Invitrogen, Cergy-Pontoise, France) supplemented with 10% fetal serum (Invitrogen, Cergy-Pontoise, France), 5 mmol/L glutamine, and 50 U/mL penicillin–streptomycin (Sigma-Aldrich, Saint-Quentin-Fallavier, France) at 37°C in 100% humidified atmosphere with 5% CO2. Adhesive cultures were developed on 75-cm2 culture flasks. The cells were trypsinized (5 minutes, 37 °C) at 50% confluence. Thereafter, they were suspended in RPMI and washed twice with phosphate-buffered saline (PBS). After centrifugation (5 minutes, 200g), cell pellets were suspended in isotonic saline solution. Cells were used in the experiments only if the apoptotic cell number was lower than 2% of the whole cell count in the working suspension. The concentration of cells in the working suspension was adapted to yield final concentrations of IGROV1 cells in PPP ranging from 5 to 250 cells/µL (5, 10, 20, 50, 100, 200 and 250 cells/µL). The number of cells was verified by observation using a contrast microscope. In preliminary experiments (data not shown), we verified that the treatment of cells with trypsin did not influence either their effect on thrombin generation or the membrane expression of procoagulant molecules (ie, TF).
Normal Human Poor Plasma
Venous blood was obtained from 10 sex-matched healthy volunteers not taking any medication interfering with hemostasis and without personal or family history of VTE. Blood was collected at fasting by atraumatic antecubital venipuncture into siliconized vacutainer tubes (Becton Dickinson, Meylan, France) containing buffered trisodium citrate (0.129 mol/L, 9 parts of blood and 1 part of citrate solution). Thrombin generation assay was performed in PPP prepared after centrifugation of citrated whole blood (15 minutes, 2000g, room temperature).
Experimental Model for In Vitro Study of IGROV1 Cells’ Impact on Thrombin Generation
We used an experimental system inspired by recent publications describing thrombin generation triggered by pancreatic and breast cancer cells. 18 The cells IGROV1 suspended in saline were spiked into fresh PPP. Free cell PPP was used in the control experiment. Thrombin generation was studied in vitro using the calibrated automated thrombogram assay (Thrombinoscope B.V., Maastricht, the Netherlands). In each well of a microplate, 80 µL of each studied sample (corresponding to the different concentrations of cells) was mixed with 20 µL saline. A free cell PPP sample (80 µL) spiked with a thrombin calibrator (20 µL) was run in parallel with each studied sample. Thrombin generation was initiated by adding 20 µL of free TF and phospholipid-triggering solution containing CaCl2 (16.7 mmol/L final concentration) and a fluorogenic substrate (Z-Gly-Gly-Arg-AMC; Bachem AG, Bubendorf, Switzerland; 417 µmol/L final concentration). Thrombin generation was assessed as described by Hemker et al. 9 Thrombin generation parameters retrieved from a thrombogram were all analyzed—lag time, time to peak (ttPeak), peak, and endogenous thrombin potential (ETP). The mean rate index (MRI), calculated by the formula [peak/(ttPeak – lag time)], was also analyzed. Assays were repeated 10 times, one after the other on different assay plates.
Western Blot Analysis for TF Expression by IGROV1 Cells
IGROV1 cells (107 cells per experiment) were washed with PBS solution and then treated by several steps as described elsewhere for pancreatic and breast cancer cells. 21 The IGROV1 cells were suspended in a lysing buffer (Tris–HCl pH 8.2, 20 mmol/L Tris, 150 mmol/L NaCl) supplemented with protease inhibitors (1% Brig 97, 5 mmol/L iodoacetamide, 25 mmol/L phenanthroline, 20 μg/mL aprotinin, 10 mmol/L dithiothreitol) all from Sigma-Aldrich (Saint-Quentin-Fallavier, France) and 10 mmol/L phenylmethylsulfonyl fluoride from Amersham Biosciences Europe (Orsay, France) and incubated for 30 minutes at 4°C. After centrifugation at 1000g for 30 minutes at 4°C, the supernatant containing all cellular components except nuclei was collected. After washing thrice with lysis buffer, a Protein G Sepharose column (Amersham Biosciences Europe) was incubated (2 hours, at room temperature) with 2 μg of mouse monoclonal antibody against human TF (product number 4503; American Diagnostica, Neuville-sur-Oise, France) and then washed with lysis solution to eliminate unbound anti-TF antibody. The cell lysate mixture was added to the anti-TF/Protein G Sepharose complex column and incubated at 4°C overnight. After washing with the lysis solution, the proteins were eluted with 100 to 250 μL of 2× Laemmli sample buffer under nonreducing conditions (125 mmol/L Tris–HCl pH 8, 10 mmol/L EDTA, 0.1% sodium dodecyl sulfate [SDS]). Supernatants were boiled at 100°C for 10 minutes and centrifuged at 400g for 10 minutes at 4°C in order to release bound proteins and analyzed after electroblotting. Elute proteins, cell lysates (30 µL), and 10 μL of molecular-weight markers (Invitrogen SARL, Éragny, Cergy-Pontoise, France) were subjected to electrophoresis SDS-polyacrylamide gel electrophoresis. The expression of β-actin by IGROV1 cell lysates was used as a positive control. Proteins were separated in Tris-glycine gel 12% (Novex Invitrogen SARL, Éragny, Cergy-Pontoise, France) and subjected for 2 hours at 125 V, 600 mA. Transferred membrane immobilon strips Hybond-P polyvinylidene fluoride (PVDF), 0.4 μm (Amersham Biosciences Europe) was incubated for 10 minutes in a transfer solution (Tris 25 mmol/L, glycine 192 mmol/L pH 8.3, and methanol 20%). Proteins were transferred onto immobilon strips Hybond-P PVDF, during the 90 minutes at 25 V, 500 mA. Proteins were fixed on the membrane for 5 minutes in 20% methanol and washed 3 times. Membranes were treated with blocking solution overnight in order to block the nonspecific sites (Tris-buffered saline pH 7.6, 1% [vol/vol], Tween 20 (TBS-T), 5% [wt/vol] nonfat dried milk). After washing with TBS-T, the membranes were incubated for 1 hour at room temperature with the same mouse anti-TF immunoglobulin G 1 (IgG1) monoclonal antibody or its isotype (diluted 1/1000), followed by 3 washes and incubation for 1 hour with the corresponding secondary antibody with a horseradish peroxidase-labeled horse antimouse antibody (diluted 1/5000) and with enhanced chemiluminescence (ECL) Western blotting detection reagents (Amersham Biosciences Europe). After washing, the membranes were immersed for 1 minute in ECL reagents (vol/vol) and exposed to an X-ray film (Hyperfilm MP, Amersham). The film was revealed, dried, and scanned or photographed.
Inhibitory Effect of Tinzaparin and Enoxaparin on Thrombin Generation Triggered by IGROV1 Cells
Tinzaparin (Innohep; LEO, Paris, France) and enoxaparin (Lovenox; Sanofi, Paris, France) were spiked with PPP supplemented or not with IGROV1 cells at concentrations ranging from 0.2 to 1 IU/mL anti-Xa (0.2, 0.4, 0.8, and 1 IU/mL anti-Xa). These concentrations are used in clinical practice for prophylactic or curative purposes. Thrombin generation triggered by IGROV1 cells at 50 and 200 cells/µL of final concentrations in PPP was studied in parallel with control experiment (free cell PPP). Anti-Xa activity in PPP spiked with each LMWH was measured using chromogenic assay Rotachrom heparin (Diagnostica Stago, Asnières-sur-Seine, France). Each experiment was repeated 10 times. The concentrations of tinzaparin and enoxaparin were expressed as IU/mL anti-Xa measured in PPP or as IU/mL anti-IIa calculated according to the anti-Xa/anti-IIa ratio given by the manufacturer (2 and 3.9, respectively, for tinzaparin and enoxaparin).
Statistical Analysis
We calculated the ratio of each studied parameter of the thrombogram according to the formula (PPP + IGROV1/PPP) in order to show the impact of cancer cells on thrombin generation. The anti-Xa and anti-IIa activities required for 50% reduction (inhibitory concentration 50 [IC50]) of MRI and ETP and for a 2-fold increase in lag time in the absence and the presence of IGROV1 cells had been determined by extrapolation from the concentration–response curve constructed for each studied compound in each experimental system. The nonparametric paired Mann-Whitney U test was applied to control changes in thrombogram before and after the addition of cancer cells in the absence and in the presence of the studied LMWHs. Data are presented as mean ± standard deviation. Statistical Package for the Social Science, a statistical software package, was used for statistical analysis. The level of significance was set at P < .05.
Results
Effects of the Presence of IGROV1 Cells on Thrombin Generation
Representative thrombograms of thrombin generation triggered in PPP in the presence of an increasing number of IGROV1 cells are illustrated in Figure 1. Thrombin generation parameters were differently affected by the presence of an increasing number of IGROV1 cells.
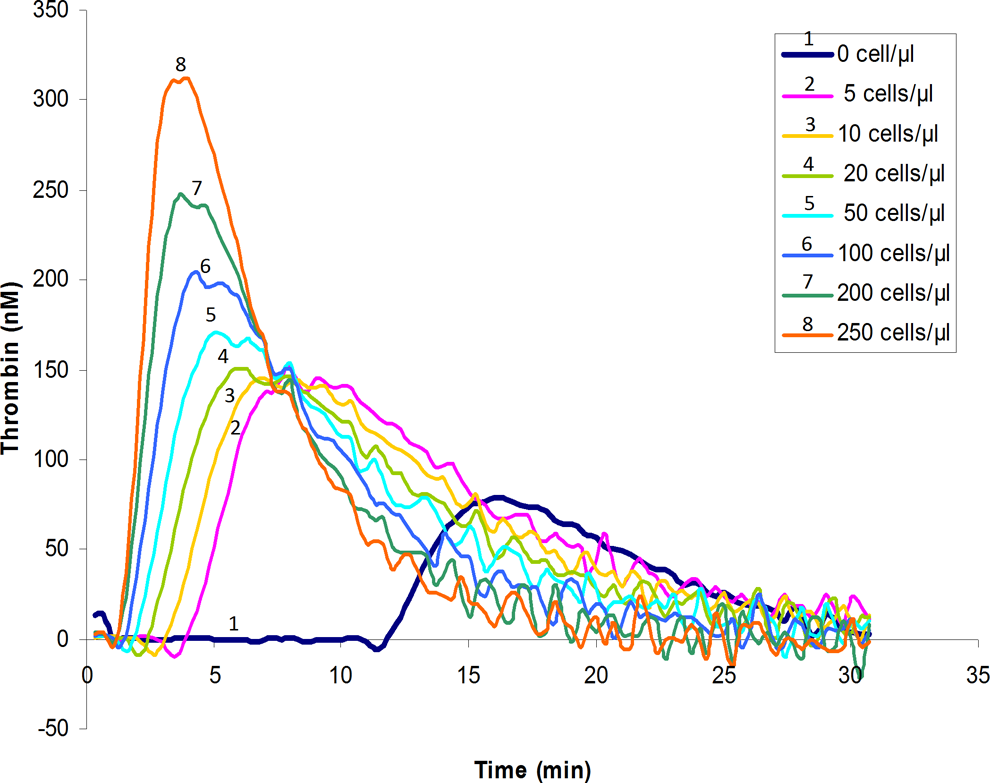
Representative thrombograms of 1 of 10 experiments of thrombin generation triggered in normal human PPP in the absence of the exogenous source of tissue factor and phospholipids and in the presence of increasing concentrations of IGROV1 cells (5, 10, 20, 50, 100, 200, and 250 cells/µL) and in PPP alone (without cells). PPP indicates platelet poor plasma.
Chronometric parameters
When IGROV1 cells were added to PPP to yield a final cell number of 5 cells/µL, the lag time (4.33 ± 0.5 minutes; P < .05) and ttPeak (8.01 ± 0.5 minutes; P < .05) were significantly reduced compared with the values obtained with PPP alone (12.67 ± 2.5 minutes and 16.33 ± 3 minutes, respectively). A plateau effect on the reduction of lag time was observed since 100 cells/µL (Figure 2, frame A). It corresponded to a 7 times reduction of the lag time compared to the control experiment. Similar to the lag time, the ttPeak was decreased in a concentration-dependent manner and reached a plateau effect since 200 cells/µL, which corresponds to 4 times reduction of ttPeak compared to control experiment (Figure 2, frame A). The lag time rather than the ttPeak was more sensitive to the presence of IGROV1 cells.
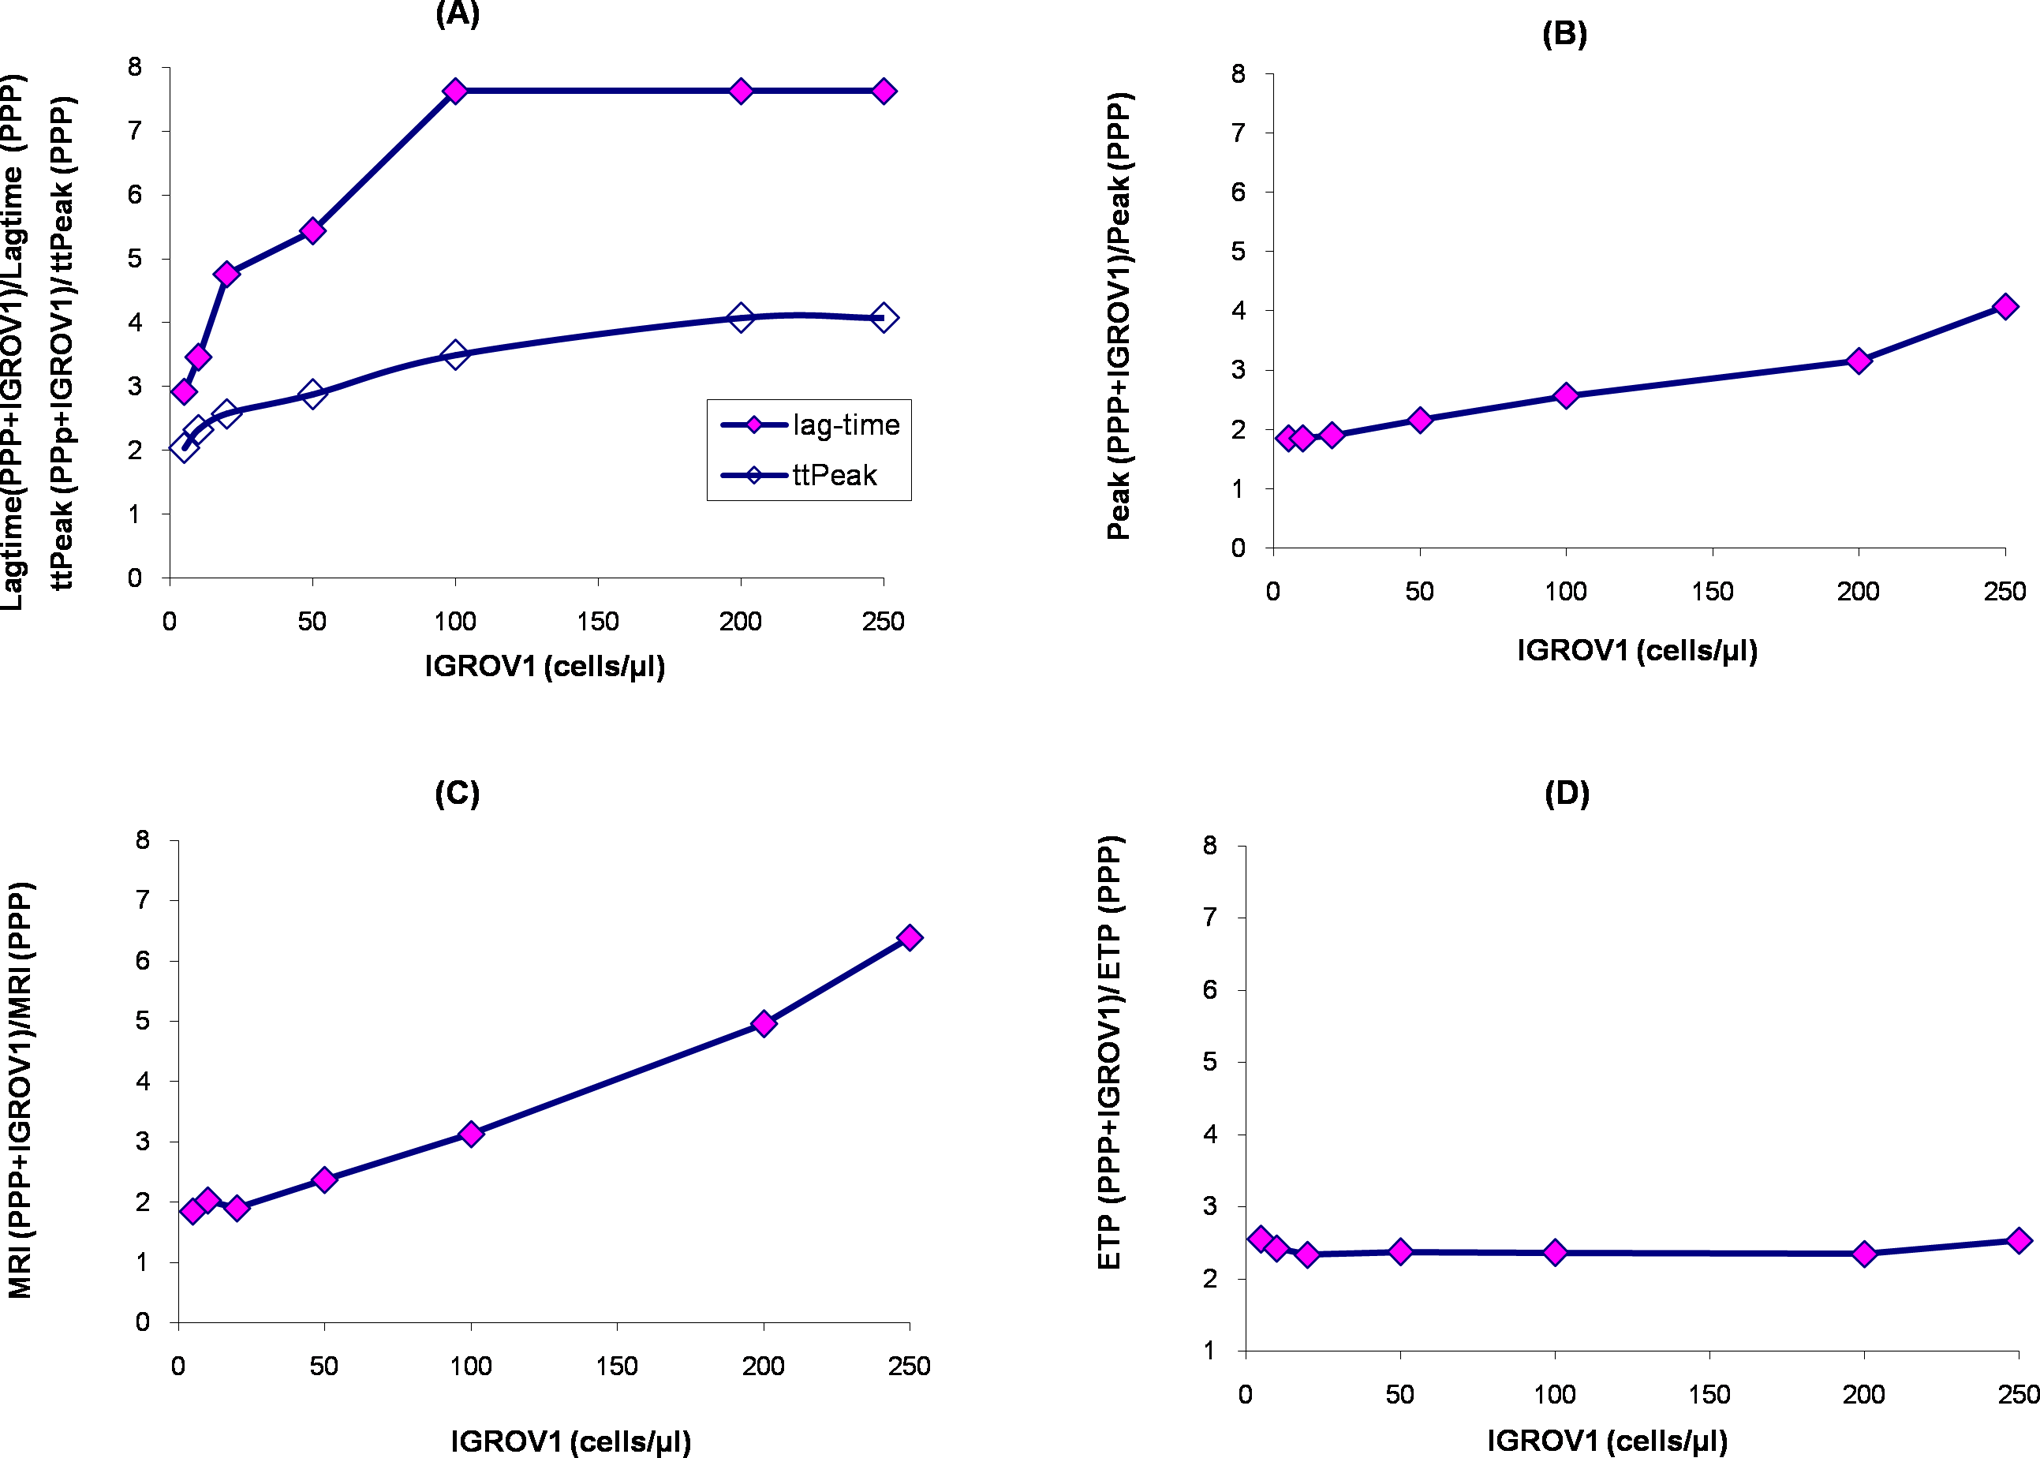
Influence of increasing concentration of IGROV1 cells suspended in normal human PPP on thrombin generation. Results are expressed as the ratio of the mean of each studied parameter of the thrombogram at the different concentrations of IGROV1 cells. The ratio is calculated according to the formula (PPP + IGROV1/PPP). Lag time and ttPeak (frame A); peak (frame B); MRI (frame C); and ETP (frame D). ETP indicates endogenous thrombin potential; MRI, mean rate index; PPP, platelet poor plasma; ttPeak, time to peak.
Peak and MRI
When IGROV1 cells were added to PPP at 5 cells/µL, the peak (145 ± 13 nmol/L; P < .05) and the MRI (39.47 ± 5 nmol/L/min; P < .05) were significantly increased compared with the values obtained in PPP without any cells (78 ± 10 nmol/L and 21.33 ± 8 nmol/L/min, respectively). Similarly, the peak and the MRI were increased in a concentration-dependent manner (Figure 2, frames B and C). A plateau effect did not occur with the studied concentrations of cells contrary to chronometric parameters.
Endogenous thrombin potential
In PPP + IGROV1 cells (5 cells/µL), ETP (1935 ± 150 nmol/L·min, P < .05) was significantly increased compared to PPP alone (760 ± 100 nM.min). Noteworthy, no further increase was observed when IGROV1 cells reached higher concentrations (Figure 2, frame D). Thus, ETP was not a sensitive parameter to the increasing number of IGROV1 cells.
Tissue Factor Expression by IGROV1 Cells
Western blot analysis showed that TF was present in eluted proteins after immunoprecipitation of cell lysates with anti-TF and in cell lysates (Figure 3). Two different bands were observed with eluted proteins after immunoprecipitation of cell lysate with anti-TF—a major band at the level of 47 kDa and a faint band at the level of 25 kDa. However, only 1 band at the level of 47 kDa was obtained with cell lysates. This band was less intense than that found with eluted proteins.
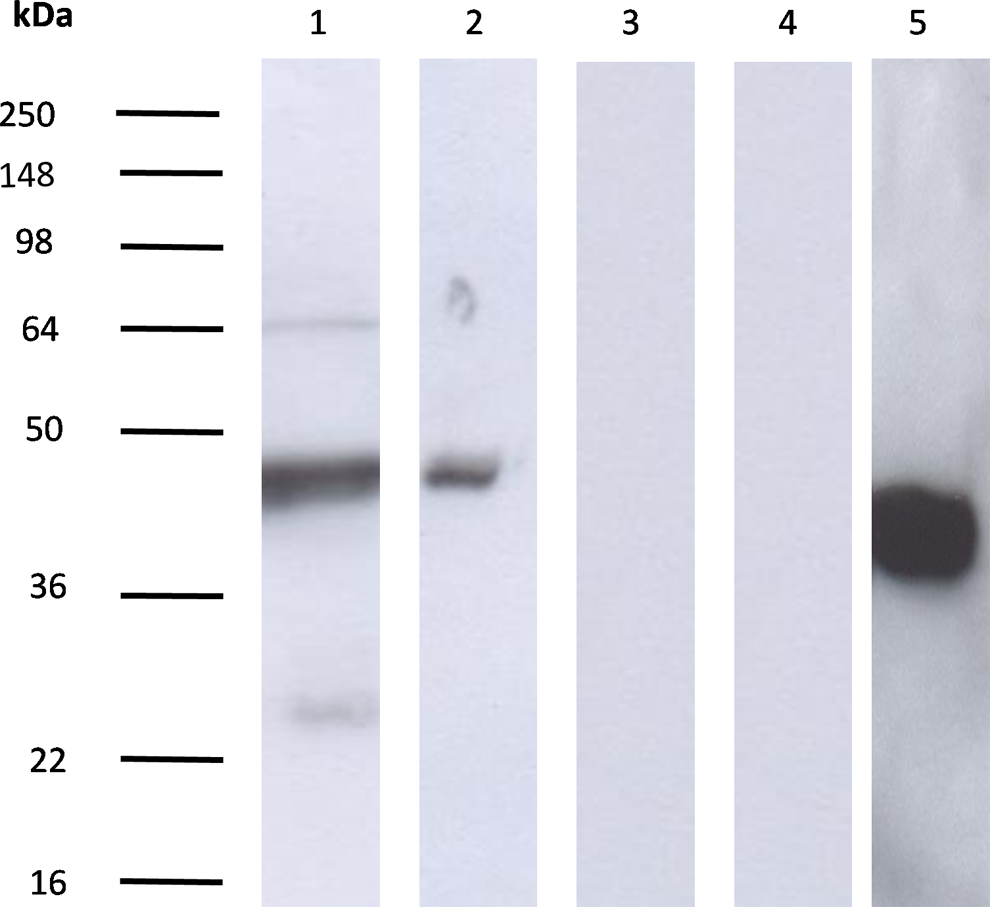
Tissue factor expression by IGROV1 cells. Tissue factor expression by IGROV1 cells (lines 1 and 2) was studied by Western blotting and revealed with the murine IgG1 antihuman TF monoclonal antibody as described in Materials and Methods. Electrophoresis was done in the presence of sodium dodecyl sulfate (lines 1, 2, 3, 4 and 5). The expression of TF in eluted proteins after immunoprecipitation of cell lysates with anti-TF (lines 1 and 3) or in only cell lysates (lines 2 and 4) was studied. Negative results after incubation with the control isotype were shown for IGROV1 (lines 3 and 4). The expression of β-actin by IGROV1 cell lysates (line 5) was used as a positive control. Tissue factor isoforms at the levels of 47 and 25 kDa are detected in IGROV1 cell lysates. IgG indicates immunoglobulin G; TF, tissue factor.
Effects of Tinzaparin and Enoxaparin on Thrombin Generation Induced by IGROV1 Cells
In PPP without cells, tinzaparin and enoxaparin completely inhibited thrombin generation at the concentration of 0.2 and 0.4 IU/mL anti-Xa, respectively. In PPP + IGROV1 cells, studied LMWHs exerted a concentration-dependent inhibition of thrombin generation (Figure 4).
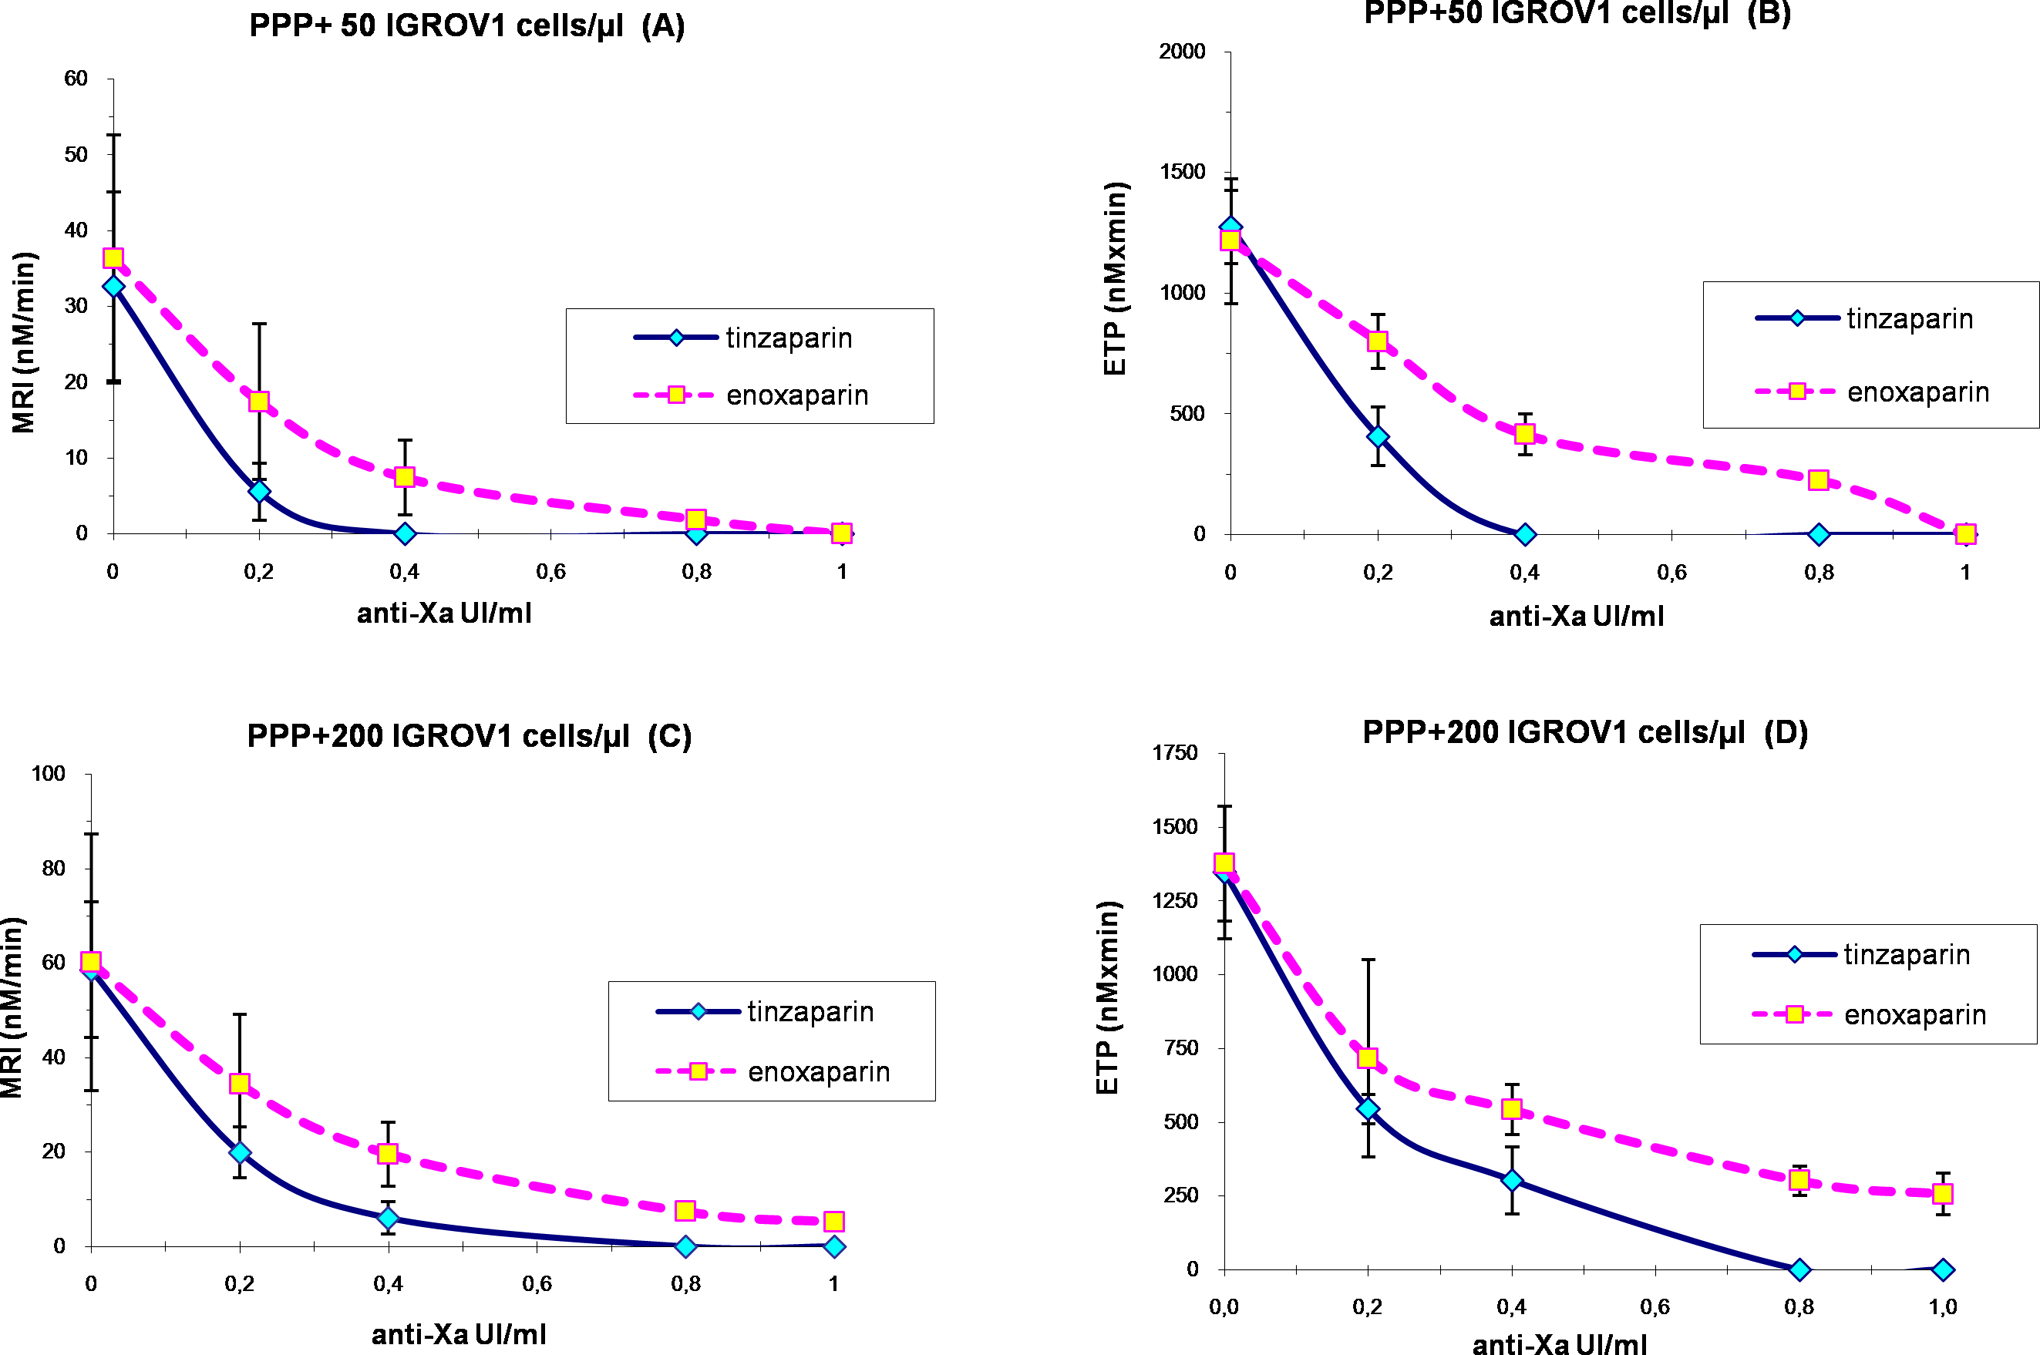
Effects of tinzaparin and enoxaparin on the MRI (frames A and C) and the ETP (frames B and D) of thrombin generation triggered in PPP in the presence of IGROV1 cells at the concentrations of 50 cells/µL (frames A and B) and 200 cells/µL (frames C and D). Values are expressed as mean ± SD from 10 experiments. ETP indicates endogenous thrombin potential; MRI, mean rate index; PPP, platelet poor plasma; SD, standard deviation.
In the presence of PPP + 50 IGROV1 cells/µL, thrombin generation was abolished by tinzaparin and enoxaparin at the concentration of 0.4 and 1 IU/mL anti-Xa, respectively. Enoxaparin, at 0.4 IU/mL anti-Xa, reduced the MRI and the ETP by 80% and 66%, respectively, and prolonged the lag time by 54% as compared to the control experiment (PPP + 50 IGROV1 cells/µL without enoxaparin). This same inhibitory effect on MRI and ETP was exerted by tinzaparin at 0.2 IU/mL anti-Xa. The inhibitory potential of tinzaparin on thrombin generation was significantly higher compared to that of enoxaparin (Figure 4, frames A and B).
In the presence of PPP + 200 IGROV1 cells/µL, thrombin generation was completely abrogated by tinzaparin at the concentration of 0.8 IU/mL anti-Xa. Twice less anti-Xa activity of tinzaparin was required to obtain the same effect in the presence of 50 cells/µL. However, at the highest studied concentration, enoxaparin did not completely inhibit thrombin generation triggered by IGROV1 cells (Figure 4, frames C and D).
On the basis of ETP values, the difference between the inhibitory effects of tinzaparin and enoxaparin between 0.2 and 0.4 IU/mL anti-Xa was less pronounced when the IGROV1 cell concentration increased in PPP (Figure 4, frames B and D). This observation was not striking with MRI.
The Role of Anti-Xa and Anti-IIa Activities on the Inhibition of Thrombin Generation Triggered by IGROV1 Cells
The IC50 of tinzaparin and enoxaparin for the MRI and the ETP and the 2-fold increase in the lag time determined both in the absence and in the presence of IGROV1 cells in PPP are depicted in Table 1.
Concentrations of Tinzaparin and Enoxaparin That Reduced by 50% (IC50) the MRI and the ETP and Increased by 2-fold the Lag Time of Thrombin Generation in PPP in the Presence or Absence of IGROV1 Cancer Cells.
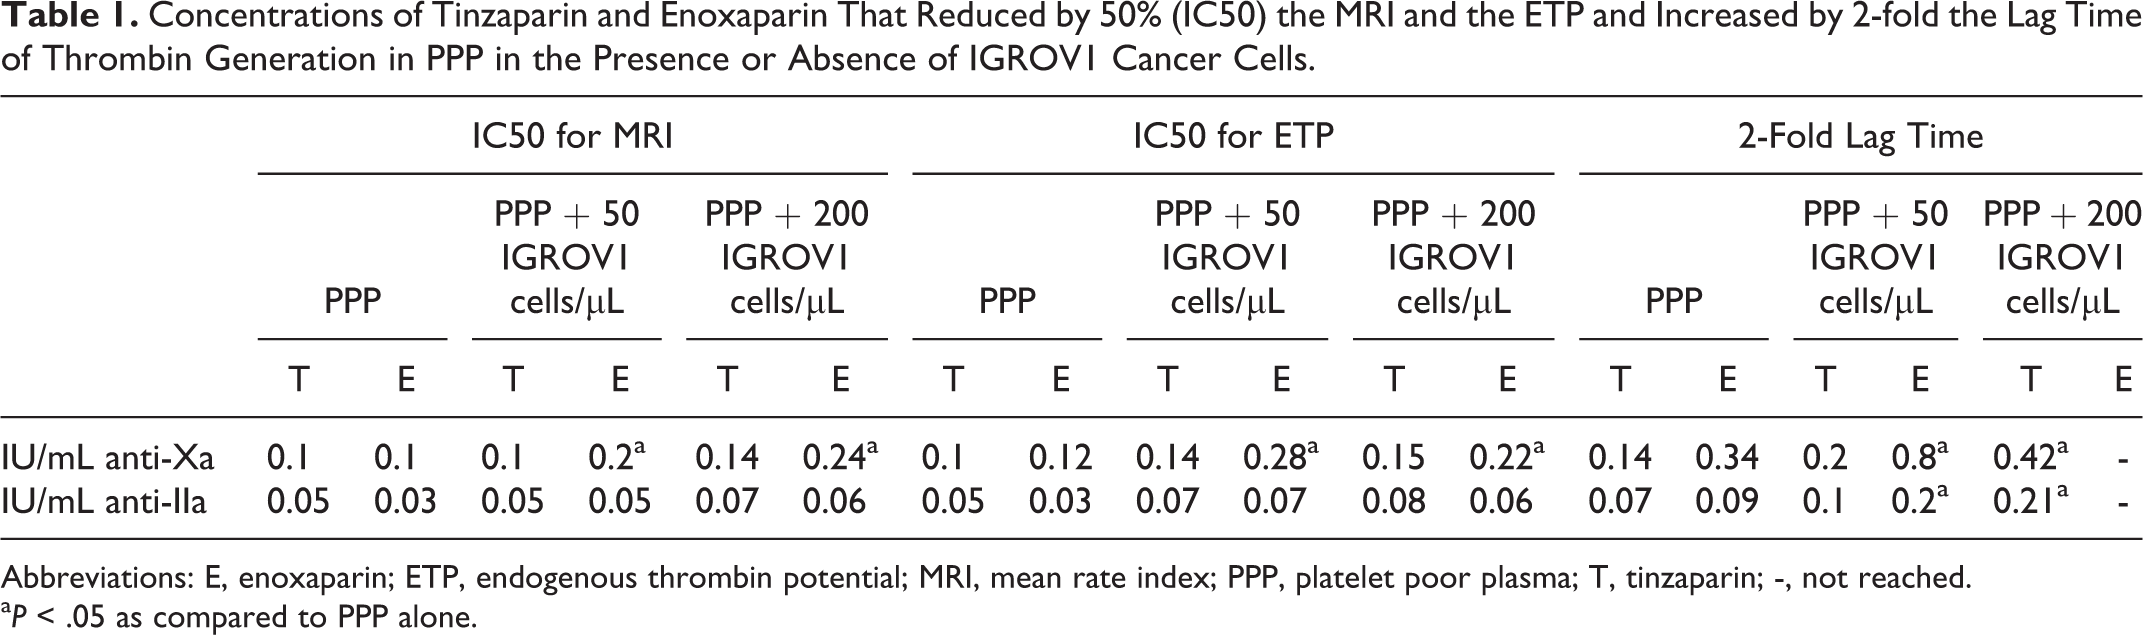
Abbreviations: E, enoxaparin; ETP, endogenous thrombin potential; MRI, mean rate index; PPP, platelet poor plasma; T, tinzaparin; -, not reached.
a P < .05 as compared to PPP alone.
Comparison of the effect on the propagation phase of thrombin generation (MRI)
In PPP + 50 IGROV1 cells/µL, tinzaparin’s IC50 for the MRI did not change compared to the respective IC50 in PPP alone. Whereas, the presence of 50 cells/µL in PPP increased the IC50 of enoxaparin by 2-fold for the MRI.
In the presence of PPP + 200 IGROV1 cells/µL, the IC50 for the MRI was increased 1.4-fold for tinzaparin and 1.2-fold for enoxaparin compared with PPP+ 50 IGROV1 cells/µL. Enoxaparin compared to tinzaparin on the basis of the anti-Xa activity had almost 2-fold higher IC50 for MRI in the presence of IGROV1 cells. When the IC50 for MRI was compared based on anti-IIa, no significant difference was found between the 2 studied LMWHs.
Comparison of the effect on the ETP
In PPP + 50 IGROV1 cells /µL, tinzaparin’s IC50 for the ETP was increased 1.4-fold compared to the respective IC50 in PPP alone. However, the presence of 50 cells/µL in PPP increased by 2.4-fold the IC50 of enoxaparin for the ETP.
In the presence of PPP + 200 IGROV1 cells/µL, tinzaparin’s IC50 for the ETP was comparable to the respective IC50 in the presence of 50 IGROV1 cells/µL in PPP. In other words, the IC50 for the ETP of enoxaparin increased by 1.8-fold in PPP + 200 IGROV1 cells/µL as compared to PPP alone, but it was reduced by 21% when compared with the respective IC50 in PPP + 50 IGROV1 cells/µL. Enoxaparin compared to tinzaparin on the basis of the anti-Xa activity had 2-fold higher IC50 for ETP in the presence of 50 IGROV1 cells/µL. In other words, if the IC50 for ETP was compared based on anti-IIa, no significant difference was found between the 2 studied LMWHs. However, when the cell concentration reached 200/µL, tinzaparin’s IC50 for ETP was 1.3-fold higher than the respective IC50 of enoxaparin on the basis of anti-IIa activity.
In PPP+ 50 IGROV1 cells/µL, the IC50 of tinzaparin and enoxaparin for ETP were 1.4-fold and 1.3-fold, respectively, higher as compared with that for MRI. Similar to the IC50 for the MRI, the IC50 for the ETP was weakly sensitive to the variation in IGROV1 cell concentration in PPP.
Comparison of the effect on the initiation phase of thrombin generation (lag time)
In PPP + 50 IGROV1 cells/µL, the anti-Xa activities of tinzaparin and enoxaparin required to double lag time were 1.4-fold and 2.3-fold, respectively, higher compared to PPP alone. Furthermore, 4-fold higher anti-Xa activity of enoxaparin than that of tinzaparin was necessary to double lag time.
In PPP + 200 IGROV1 cells/µL, the increase upon doubling lag time was 2.1-fold for tinzaparin as compared to PPP + 50 IGROV1 cells/µL. Whereas, at the highest anti-Xa activity studied (1 IU/mL anti-Xa), enoxaparin did not achieve 2-fold increase in lag time in the presence of 200 IGROV1 cells/µL. Hence, the anti-Xa and the anti-IIa activities of tinzaparin and enoxaparin required to double lag time were very sensitive to the increase in cell concentration in PPP and thus were markedly increased in the presence of 200 cells/µL in PPP compared to 50 cells/µL.
In free cell PPP, anti-Xa activities of tinzaparin and enoxaparin required to double lag time were higher than that required to reduce par half the MRI and the ETP. Unlike the IC50 for the MRI and the ETP, anti-Xa activities of tinzaparin and enoxaparin required to double lag time were very sensitive to the increase in cell concentration in PPP.
Discussion
Epithelial ovarian cancer is the fifth leading cause of cancer-related death among women and is the most lethal gynecologic malignancy. A documented relationship between ovarian cancer and thrombosis does exist. Furthermore, ovarian cancer involves a considerably larger number of cancer cells than other types of cancers; as a consequence, an extremely large amount of TF is released by the cancer cells. 25 –31 This expression of TF, the physiologic initiator of hemostasis, is significantly correlated with VTE development in clinical situations. 32 The LMWHs are the drugs of choice for both initial and long-term treatment of cancer-associated thrombosis. 19,20 The global antithrombotic activity of LMWHs is not completely predicted by anti-Xa activity measured in PPP. 33 Fortunately, last developments have made it possible to measure thrombin generation routinely at a high throughput, which might provide useful information to guide clinical decisions 11,18 in a delicate population such as patients with cancer.
We studied the effect upon thrombin generation of the ovarian cancer cells, IGROV1, in the absence and in the presence of LMWHs in normal human PPP. In the first part of the work, we analyzed the effect of the increasing concentration of cancer cells on thrombogram parameters and we studied TF expression by IGROV1 cells. In the presence of IGROV1 cells in PPP, the thrombin generation curve is characterized by a shorter initiation phase followed by an explosive burst of thrombin compared to PPP alone. In PPP + 5 IGROV1 cells/µL, cancer cells already manifested a significant effect on all thrombin generation parameters. The chronometric parameters were clearly influenced by the presence of IGROV1 cells in a concentration-dependent manner until a plateau. Indeed, chronometric parameters of thrombogram were the most relevant parameters for the detection of TF-dependent procoagulant activity in cancer cells. 21 Moreover, IGROV1 cells accelerated the propagation phase of thrombin generation in a concentration-dependent manner and increased the peak and the ETP in the absence of the exogenous source of phospholipids. Surprisingly, in our study, the ETP was the only parameter that was not vulnerable to the increase in cell concentration in PPP. At the concentration of 5 cells/µL, the total enzymatic work performed by thrombin during the time that it was active was already saturated. In fact, the peak, ETP, and MRI are dependent on the amount of phospholipids provided by the studied system. These procoagulant phospholipids optimize the assembly of enzymatic complexes of blood coagulation and then enhance thrombin generation. 34 Furthermore, thrombin generation was used in vivo to assess the procoagulant activity in the plasma of patients with cancer. These studies have shown the involvement in thrombin generation of endogenous TF and endogenous phospholipids released into the circulation from cancer cells. 35 So, in the absence of any exogenous source of TF and phospholipids, we hypothesize that IGROV1 cells express and/or release TF and procoagulant phospholipids. Concerning TF expression, Western blot immunoelectrophoresis showed that eluted proteins after immunoprecipitation of cell lysates with anti-TF and cell lysates from IGROV1 cells contained a 47-kDa protein recognized by the specific anti-TF monoclonal antibody that corresponds to the known molecular weight of TF. The immunoprecipitation of cell lysates with anti-TF allowed concentrating TF from cancer cells. The presence of the 25-kDa band could correspond to a spliced isoform of TF or to a degraded TF as it was advanced by Gerotziafas et al 21 about pancreatic and breast cancer cells (BXCP3 and MCF7). The expression of TF by IGROV1 cancer cells mainly influences the initiation phase of thrombin generation.
In the second part of the study, we evaluated the antithrombotic efficiency of tinzaparin and enoxaparin when coagulation was triggered in PPP in the presence of IGROV1 cells. We showed that at clinically relevant concentrations of tinzaparin and enoxaparin in PPP, thrombin generation was inhibited in a concentration-dependent manner. When the 2 LMWHs were compared on the basis of equivalent anti-Xa activity, tinzaparin was found to be a more potent inhibitor of thrombin generation than enoxaparin in the presence of cancer cells, which is in accordance with previous studies, 22 since it has a lower anti-Xa/anti-IIa ratio and then more anti-IIa activity compared to enoxaparin. 33 Moreover, the activity of tinzaparin was found to be less influenced by the presence of IGROV1 cells than enoxaparin. In fact, tinzaparin has a higher molecular weight and longer chains than enoxaparin. 33 From a structural viewpoint, the long polysaccharide chains may have nonspecific binding. So, we hypothesize that a nonspecific binding of longer polysaccharide chains of tinzaparin to the membrane of IGROV1 cells might change the procoagulant phenotype of cancer cells (ie, by reducing the amount of TF and/or procoagulant phospholipids derived from IGROV1 cells). Hence, we conclude, at this stage, that the procoagulant proprieties of IGROV1 cells render more vulnerable the antithrombin activity against FXa than the anti-IIa similar to pancreatic cancer cells BXPC3 as reported previously by our group. 22
Noteworthy, on the basis of the anti-Xa activity, enoxaparin had almost 2-fold higher IC50 for MRI in the presence of IGROV1 cells than tinzaparin. No difference was found among tinzaparin and enoxaparin when the IC50 for the MRI were compared on the basis of anti-IIa activity. In fact, the reduction in the MRI was already recognized as mainly influenced by the anti-Xa activity of LMWHs. 33 Our finding is in agreement with the study previously cited in which the effects of LMWHs upon thrombin generation in the presence of human pancreatic cancer cells BXPC3 were studied. 22 In addition, enoxaparin compared to tinzaparin on the basis of the anti-Xa activity had 2-fold higher IC50 for ETP in the presence of 50 IGROV1 cells/µL. Similar to the MRI, no difference was found among tinzaparin and enoxaparin when the IC50 for the ETP was compared on the basis of anti-IIa activity. Interestingly, the results obtained with ETP were not consistent with those of LMWHs in the presence of pancreatic BXPC3 cancer cells in PPP 22 and with the results of in vitro experiments that had already shown that the inhibition of ETP is depending far more on the anti-IIa than on the anti-Xa activity. 33 This striking finding provides evidence that the inhibition of thrombin generation induced by ovarian cancer cells IGROV1 depends mainly on the anti-Xa activity.
On the other hand, higher anti-Xa activities of enoxaparin than tinzaparin were required to double the lag time in the absence and in the presence of IGROV1 cancer cells. The lag time is mainly influenced by the anti-IIa activity of LMWHs, 33 which was also proved in our experimental study in the presence of ovarian cancer cells. Unlike the IC50 for the MRI and the ETP, anti-Xa and the anti-IIa activities of tinzaparin and enoxaparin required to double lag time were very sensitive to the increase in cell concentration in PPP. Hence, the number of cancer cells that might correspond to different stages of cancer influences the effect of tinzaparin and enoxaparin only on the coagulation initiation phase.
Conclusion
Our data are the first study that characterizes the procoagulant phenotype of human epithelial ovarian cancer cells IGROV1 and their in vitro sensitivity to the antithrombotic effects of tinzaparin and enoxaparin. On the basis of the IC50 for MRI and ETP in the presence of cancer cells, we put the finger on an important point. The inhibition of thrombin generation induced by ovarian cancer cells IGROV1 depends mainly on the anti-Xa activity. It is argued that the antithrombotic potency of tinzaparin and enoxaparin varies depending on the type of cancer. Thus, this experimental study supported the concept that the antithrombotic activity of LMWHs is not completely predicted by the anti-Xa or anti-IIa activities measured in PPP. We should not extrapolate the efficiency profile of antithrombotic drugs in a cancer to another one. The challenge is to prescribe the suitable LMWHs depending on the type of cancer with the best efficacy and with the minimum bleeding risk. This efficiency is certainly modulated by TF and phospholipids expressed and issued from cancer cells. These first experiments provide a rational for conducting trials assessing the interactions of ovarian cancer cells with their cellular environment and comparing again the efficiency of tinzaparin and enoxaparin.
M.S. did the experiments, contributed to study design, acquisition, analysis, and interpretation of data, and has been involved in drafting the manuscript. T.C. contributed to the analysis and interpretation of data. E.M. carried out the cultures of cancer cells IGROV1 and Western blot and contributed to the drafting of manuscript. P.V.D. critically reviewed the manuscript. I.E. has made substantial contribution to the design of the study and the interpretation of data. A.K.L. critically reviewed the manuscript. G.T.G. has made substantial contributions to conception and design of the study, analysis and interpretation of data, has been involved in drafting the manuscript, and has given final approval of the version to be published.
Footnotes
Acknowledgments
The authors acknowledge Hayat Mokrani for her skillful technical assistance.
Declaration of Conflicting Interests
The author(s) declared no potential conflicts of interest with respect to the research, authorship, and/or publication of this article.
Funding
The author(s) received no financial support for the research, authorship, and/or publication of this article.