
Abstract
Background
The ROADMAP-EOP study aimed to identify clinically relevant biomarkers of hypercoagulability for the identification of pregnant women at risk of early onset preeclampsia worsening.
Methods
The ROADMAP-EOP observational single center retrospective case–control study was conducted in Greece (Centre for Human Reproduction, Genesis Athens Clinic, Athens, Greece) from July 2020 to July and enrolled pregnant women diagnosed with EOP stratified in mild EOP group (n = 34) and severe EOP group (n = 15) as well as women with uncomplicated pregnancy (control group; n = 35). All women were assessed with thromboelastometry (ROTEM®), Calibrated Automated Thrombogram®, tissue factor activity (TFa), procoagulant phospholipid dependentclotting time (Procoag-PPL®), Proteins S (PS), TFPI, D-dimer, antithrombin (AT), thrombomodulin (TM), fibrinogen, prothrombin time (PT) and activated partial thromboplastin time (aPTT). The primary study end-point was severe earlyonset preeclampsia. Principal component analysis (PCA) was performed.
Results
The PCA analysis showed that a score composed of the lag-time, ttPeak and Procoag-PPL accurately predicted severe EOP (sensitivity 71.4%, specificity 61.8%, and AUC of the ROC analysis 0.953).
Conclusion
The pilot ROADMAP-EOP shows that activation of endothelial cells and blood hypercoagulability are driven events in the worsening of EOP. Among a large panel of biomarkers and coagulation assays, thrombingeneration test and procoagulant phospholipid dependent clotting time emerged as clinically relevant for the evaluation of the risk of severe EOP. This methodology for the development of a new clinic-biological risk assessment model for prompt identification of pregnant women at risk of severe EOP must be validated in a large multi-centerprospective study.
Keywords
Introduction
Pre-eclampsia occurs in up to 7% of pregnancies in Western Countries and is a leading cause of maternal and fetal morbidity and mortality. 1 Pre-eclampsia is an evolutive syndrome characterized by new-onset hypertension (systolic blood pressure ≥140 mm Hg, diastolic blood pressure ≥90 mm Hg), with either proteinuria (≥300 mg/24 h) and/or organ dysfunction after the 20th gestational week.2, 3
Classification of preeclampsia is based on the timing of symptoms’ onset and the severity of the clinical status. Accordingly, early and late preeclampsia are characterized by symptom onset before or after 32-34 weeks of gestation respectively. Mild or severe preeclampsia are characterized by the levels of blood pressure (mild, <160/110 mm Hg; severe, ≥160/110 mm Hg), and the presence or absence of organ dysfunction (kidney failure, liver rupture, stroke, and seizure). 4
Pathogenesis of preeclampsia is characterized by abnormal placental vascular development with impaired invasion of the uterine spiral arteries by trophoblasts, resulting in fetal complications and maternal endothelial dysfunction. 5 Intact antithrombotic properties of the endothelial cells and efficient regulation of thrombin generation and platelet activation at the microenvironment of the uterus are necessary conditions for successful trophoblast invasion and development of feto-maternal circulation during normal pregnancy.6, 7
The data available so far indicate that preeclampsia aggravation is driven by inflammation and hypercoagulability due to exacerbated platelet activation, release of procoagulant extracellular vesicles (EVs), and thrombin generation. Altered clot formation kinetics and structure and activation of endothelial cells are implicated in onset and worsening of preeclampsia.8, 9 In addition, EVs released from activated platelets and placenta syncytiotrophoblasts contain bioactive messengers including miRNA and protein ligands. The EVs play a role in mediating preeclampsia-induced maternal endothelial damage.8–12
Prompt identification of pregnant women at risk of preeclampsia worsening could help to anticipated therapeutic intervention and improvement of the clinical outcome. Since preeclampsia aggravation process involves activation of hemostasis and endothelial cells, the pilot ROADMAP-Early Onset Preeclampsia study (ROADMAP-EOP) aimed to identify biomarkers of hypercoagulability that can be used in risk assessment tools for the identification of women at risk of EOP worsening.
Materials and Methods
Study Design and Participants
An observational single center retrospective case–control study was conducted in pregnant women diagnosed with preeclampsia from July 2020 to July 2021 at the Centre for Human Reproduction, Genesis Athens Clinic, Athens, Greece). Eligible women were included in the study before initiation of any treatment for preeclampsia and were stratified in mild early onset preeclampsia group (mild EOP), and severe early onset preeclampsia group (severe EOP) according to the criteria of the International Society for the Study of Hypertension in Pregnancy, as follows 4 : Mild preeclampsia was diagnosed in the presence of two criteria, a blood pressure of 140/90 mm Hg or higher (after two consecutive measurements with an interval of six hours) and proteinuria (300 mg of protein or higher in a 24 h urine specimen). Severe preeclampsia was diagnosed when there were two or more of the following diagnostic criteria: (a) systolic blood pressure exceeding 160 mm Hg, diastolic blood pressure exceeding 110 mm Hg (blood pressure findings must be observed twice at intervals of at least six hours); (b) proteinuria measured with greater than 5 gr/24 h or three or four positive proteinuria findings detected with dipstick; (c) oliguria (urine output of ≤ 400 ml/24 h); (d) frontal headache or visual disturbances; (e) abnormal liver function tests (alanine aminotransferase and aspartate aminotransferase); (f) thrombocytopenia; and (g) pulmonary edema or cyanosis.
Exclusion criteria were: age ≤18 years, patients receiving prophylactic or therapeutic anticoagulant therapy, or aspirin, or with personal history of venous or arterial thrombosis, inflammatory or autoimmune disorders, cancer, diabetes, obesity, chronic hypertension, renal, or hepatic diseases, acute infections, known inherited thrombophilia.
The control group consisted of normal pregnant women, who had uncomplicated singleton pregnancies, normal blood pressure and no proteinuria. They were matched with the women with preeclampsia for age (± five years) and gestational age (± two weeks). No pregnant control had a history of preeclampsia or gestational hypertension.
Ethics: The study was performed according to the Declaration of Helsinki. All volunteers gave written informed consent.
Blood Sampling
Blood samples were collected at the time of clinical diagnosis of preeclampsia, before starting any treatment, in the frame of routine hematological exploration, by atraumatic antecubital venipuncture using a 19-Gauge needle, in vacutainer tubes (Becton Dickinson, Franklin Lakes, NJ, USA) containing 3.8% sodium citrate 109 Mmol/L (for blood coagulation assay) and one vacutainer tube containing ethylene diamine tetra acetic acid (EDTA) 5.4 mg (for hemogram). Thromboelastometry analysis was performed on fresh citrated whole blood. Citrated platelet-poor plasma (PPP) was prepared within 1 h of blood collection by double centrifugation (2 × 15 min at 2500 g) at room temperature to perform routine blood coagulation tests. The residual volume of and PPP was stored in aliquots at −80 °C until analysis.
Blood Coagulation Analysis
Tissue factor activity (TFa) was measured with a one-stage chromogenic method according to manufacturer's recommendation (from Diagnosica Stago, Asnières, France). This assay measures the ability of TF-FVIIa to activate factor X. The plasma samples were mixed with human factor VII, factor X and fibrin polymerization inhibitor and incubated at 37 °C allowing for the formation of TF/Factor VIIa complex. The secondary generation of activated factor X (FXa) was measured by adding a specific chromogenic substrate for FXa. Inter-assay and intra-assay coefficients of variation for this kit were 3.8% and 4.2% respectively [7-8].
Procoagulant phospholipid dependent clotting time (Procoag-PPL) was measured using a factor Xa-based clotting assay; STA®-Procoag-PPL® (Diagnostica Stago, Asnières, France). The assay measures the clotting time in a system dependent on the total plasma phase procoagulant phospholipid (PPL) content of the sample. It differs from solid phase assays in that there is no pre-selection of annexin-V bound activity. The assay was performed using phospholipid depleted substrate plasma to eliminate the influence of any coagulation factors upstream. Factor Xa, in the presence of calcium, triggers the coagulation. A shortening clotting time of the sample indicates an increased concentration of procoagulant phospholipids.
Protein S and free-TFPI levels were measured by STA®-Staclot Protein S® on a STA®-R analyser and by ELISA Free TFPI, Asserachrom® (Diagnostica Stago, Asnières, France) respectively. Assays were performed according to the manufacturer's instructions.
D-dimer levels were measured by STA® Liatest D-Di® and antithrombin levels (AT) were measured by Liatest® ATIII (Diagnostica Stago). Fibrinogen was measured by the Clauss method, with STA®-Fibrinogen according to standard procedures and using a STA-R® automated coagulation analyzer (Diagnostica Stago). Prothrombin time (PT) and activated partial thromboplastin time (aPTT) with STA®-neoptimal and STA®-PTT-automat (Diagnostica Stago). Plasma thrombomodulin activity (TMa) was measured using an in house assay (from Diagnostica Stago, Asnière, France). In brief, TMa levels were measured on the STA-R® analyser using a chromogenic assay based on the ability of TMa to activate protein C after incubation with thrombin-protein C. All samples were measured in duplicate.
Calibrated Automated Thrombogram Assay. Thrombin generation in PPP was studied with the Calibrated Automated Thrombogram (CAT) from Diagnostica Stago, (Gennevilliers, France) and the respective software (Thrombinoscope BV, Maastricht,the Netherlands) using FluoroskanAscent, a fully automated, computer controlled fluorometric microplate reader (Thermo Fisher Scientific, Waltham, Massachusetts, USA). In each well of the microtiter plate, 80 μL of PPP, were mixed with 20 μL PPP-Reagent low® (1 pmol/L of TF and 4 μmol/L of phospholipids). Thrombin generation was initiated by adding a triggering solution containing CaCl2 (16.7 mmol/L final concentration) and a fluorogenic substrate (Z-GlyGly-Arg-AMC, 417 μmol/L final concentration). Each measurement was performed in duplicate. In a third well, thrombin calibrator (from Diagnostica Stago) was added to correct thrombin generation curves for substrate consumption and inner filter fluorescence effects. The following thrombogram parameters were analyzed: lag-time (LT) corresponding to the initiation phase of coagulation; time to peak (ttPeak), the time to maximum thrombin generation; peak (Peak): maximum concentration of free thrombin; endogenous thrombin potential (ETP) which informs for the total enzymatic activity of thrombin and mean rate index (MRI) of the propagation phase of thrombin generation calculated by the formula MRI = Peak/(ttPeak − LT). The inter- and intra assay coefficients of variation for all parameters were 5%. The assays and the analyzer were purchased from Diagnostica Stago, Asnières France. Thrombin generation was also performed in the presence and absence of soluble thrombomodulin with STG-thromboScreen (Diagnostica Stago) and the corresponding ETP ratio (ETPtm/ETP) was calculated
Rotation Thromboelastometry assay. Thromboelastometry was performed on fresh citrated whole blood on ROTEM delta® instrument (Tem Innovations GmbH, Werfen, Munich, Germany). The elapsed time between blood collection and launching of ROTEM® assays was less than 2 h. Standard ROTEM® assay using the INTEM® reagent (triggering the intrinsic coagulation pathway) was performed according to manufacturer's instructions. For each experiment, 330 μL of whole blood were mixed with 20 μL of CaCl2 solution (0.2 mol/L) and 10 μL of INTEM® reagent. The following parameters of the thromboelastogram were analyzed: the clotting time (CT, expressed in seconds), corresponding to the time from the beginning of the coagulation analysis until an increase in amplitude of 2 mm. The CT reflects the initiation phase of the clotting process; the clot formation time (CFT, expressed in seconds), is the time between an increase in amplitude of thromboelastogram from 2 to 20 mm; the α-angle (°), is the tangent to the clotting curve through the 2 mm point. The CFT and α-angle reflect the propagation phase of clot formation; the maximum clot firmness (MCF, expressed in millimeters), is the maximum distance between the two branches of the thromboelastogram and correlates with the platelet count and function as well as with the concentration of fibrinogen and the red blood cell count. The MCF quantifies the firmeness of the established coagulum; the maximum lysis (ML, %), is defined as the ratio of the lowest amplitude after reaching the MCF. It represents the maximum fibrinolysis detected during the analysis. The inter- and intra-assay coefficients of variation for all parameters ranged between 8% and 5%, and the inter-individual assay variability in healthy individuals is 15%.
Data were checked for normal distribution;continuous variables are described as mean ± standard deviation and categorical variables as frequency and percentage. Patients with missing data (clinical variables or biomarkers) were excluded from the analysis. Values of biomarkers measured in the cohort of patients were compared against values measured in the control group. Comparisons were also performed between the groups of mild and severe EOP.
The study groups were compared with Student-t-test. In view of the deviation from normality (as evidenced by the Shapiro-Wilk test) the comparison between the studied groups was performed using the Mann-Whitney-Wilcoxon test for independent samples. Pearson's correlation analysis was used to detect significant correlations between parameters. Principal component analysis (PCA) was performed to check for associations among the biomarkers and the clinical outcome.
Separate random forest classifiers were trained on variables to predict EOP and PCA was performed. During training, the random forest classifier performed an implicit feature selection; the top features are those that appear highest ranked in the most trees. To reduce overfitting, the number of trees were limited to ten, the maximum depth of each tree was limited to three, and a three-fold cross validation approach was used.16–8 To remain conservative and to limit the risk of overfitting further, no hyperparameters were tuned or optimized by design and intent. The samples were split into two stratified training (70%) and validation sets (30%). The reduced variable sets were then visualized with a nonlinear dimensionality reduction on the full data matrix using the t-distributed stochastic nearest neighbor embedding (t-SNE) algorithm. 19 The t-SNE assumes that the “optimal” representation of the data lies on a manifold with complex geometry, but with low dimension, embedded in the full-dimensional space of the raw data. Receiver operating characteristic (ROC) curves were conducted with the random forest to determine sensitivity and specificity of the reduced variable sets for predicting their binary outcome, either intubation or mortality. To avoid circular-analysis and reduce overfitting, the reduced model was tested using the validation dataset and a random forest classifier with ten trees, maximum depth of three and three-fold cross validation. When evaluating the diagnostic ability of a test to discriminate the binary outcomes of the subjects, areas under the curve [>0.90 are generally considered to provide excellent accuracy classification, while 0.80-0.89 are considered to provide very good accuracy classification (with 1.0 being a ‘‘perfect’’ test and 0.5 attributed to ‘‘luck’’)]. 20 Model discrimination performance was evaluated by calculating sensitivity, specificity, positive predictive value (PPV) and negative predictive value (NPV) in both cohorts. Data analysis and statistics were performed with the “scikit-learn” module for Python 3.8.5 Open Source.
Results
Demographic Characteristics of Study Participants
A total of 84 pregnant women were included in the study. Among them, 35 had normal pregnancy (control group), 34 mild EOP, and 15 severe EOP. There were no significant differences regarding age, gravidity, gestational age, and the body mass index (BMI) between EOP groups and normal pregnancy as well as within the EOP groups. Patients had significantly higher blood pressure than the control group.
Platelet counts were similar in healthy pregnant women, and mild EOP group, and significantly lower in severe EOP (P < .05). No other statistically significant differences were found between-groups (Table 1).
Demographics and Clinical Data of Study Population.
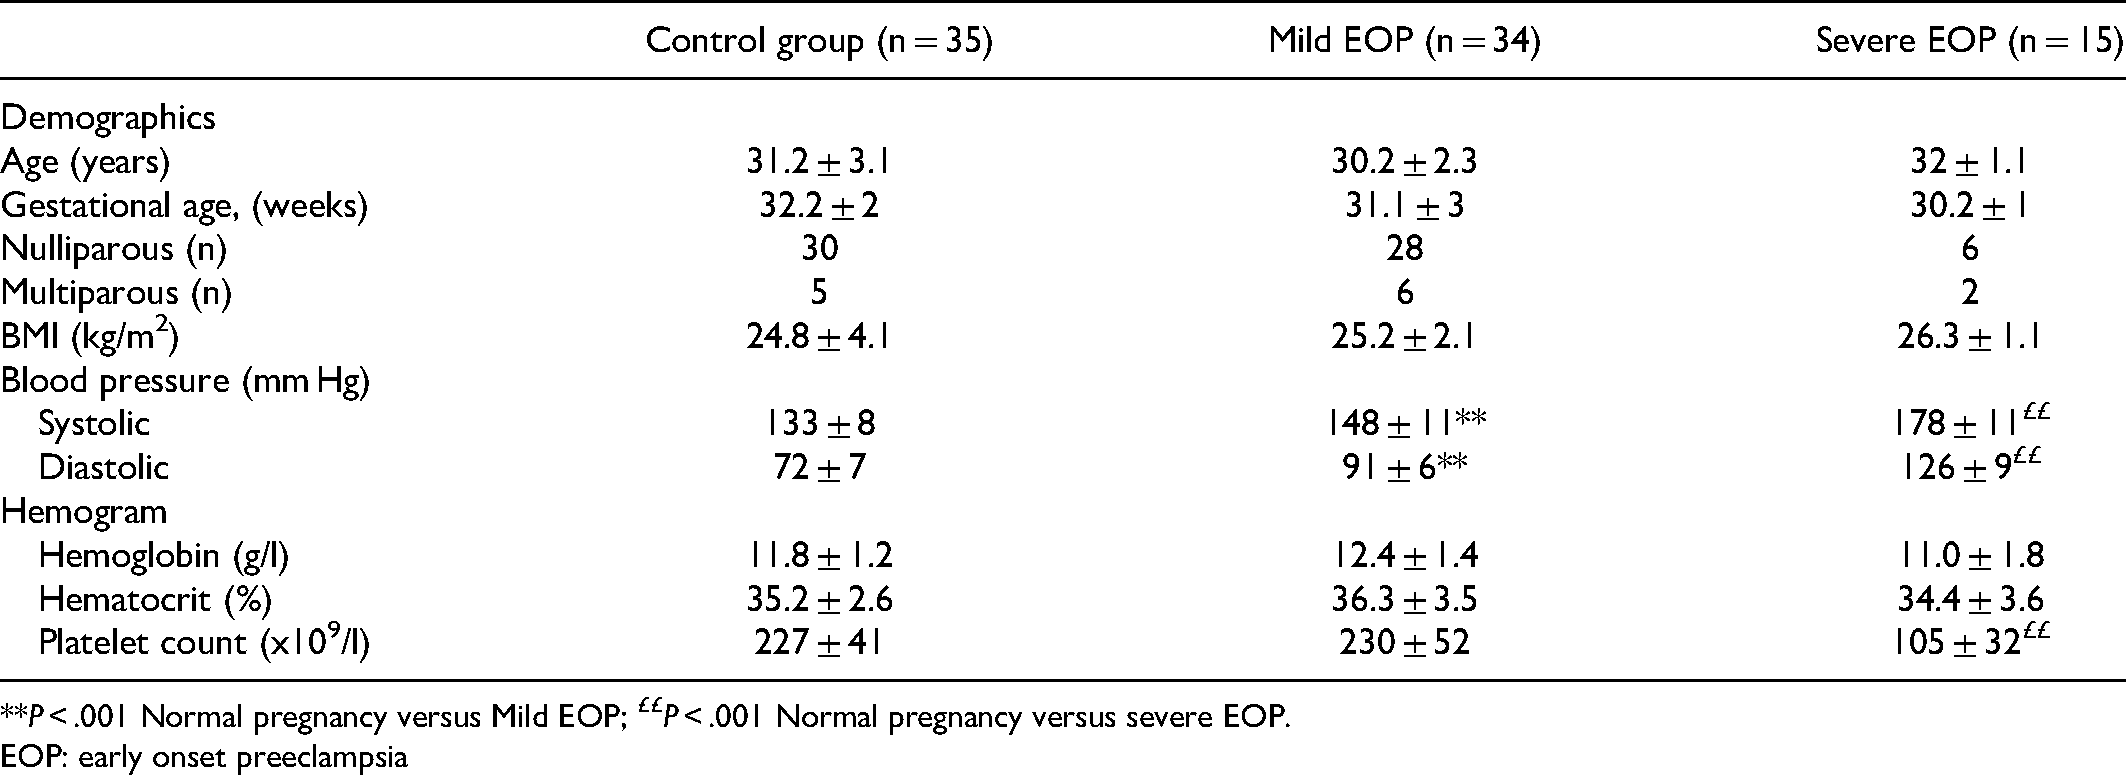
**P < .001 Normal pregnancy versus Mild EOP; ££P < .001 Normal pregnancy versus severe EOP.
EOP: early onset preeclampsia
Clot Formation Kinetics, Clot Firmness and lysis in Early Onset Preeclampsia
Clotting time, CFT, α-angle, MCF, ML, all fell within the reference ranges for healthy pregnant women. The CT was not significantly different in mild EOP group as compared to the control group. The severe EOP showed a significantly longer CT than the control and the mild EOP group (155.27 ± 6.23 s, vs 149 ± 11.16 and 147.35 ± 8.03 s respectively; P < .05). Mild EOP group had significantly shorter CFT as compared to the control group (52.97 ± 6.24 vs 56.37 ± 6.25 respectively; P < .05). In contrast, the severe EOP showed longer CFT as compared to the control group (63.20 ± 4.18 vs 56.37 ± 6.25; P < .05). Furthermore, CFT was significantly longer in the severe EOP group as compared to the mild EOP group (P < .05).
The α angle was not significantly different between the mild EOP group and the control group. In patients with severe EOP, the α angle was significantly lower as compared with control group and mild EOP (59.67 ± 5.60 vs 78.77 ± 1.88 and 77.79 ± 1.77 respectively; P < .001).
The MCF was not significantly different between the control and the mild EPO group, but it was significantly lower in the severe EOP group (74.50 ± 3.13 and 58.53 ± 3.29 vs 70.4 ± 2.17 respectively; P < .001).
The ML was significantly lower in mild EOP and severe EOP groups as compared to the control group (2.88 ± 1.12 and 2.07 ± 0.80 vs 5.69 ± 1.11 respectively; P < .001). The ML was significantly higher in mild EOP as compared to severe EOP (P < .05). Thromboelastometric parameters in the three studied groups are summarized in Table 2.
Thromboelastometry Profiles in Women with Early Onset Preeclampsia and Pregnant Controls.

Values are mean ± sd. *P < .05 pregnant controls versus mild or severe EOP;
P < .05 mild EOP versus severe EOP. Thromboelastometry was performed in citrated fresh whole blood using INTEM reagent.
CT: clotting timer; CFT: clot formation time; MCF: maximum clot firmness; ML: mMaximum lysis; EOP: early onset preeclampsia
CT: Clotting Time; CFT: Clot formation time; α-angle : Alpha; MCF: Maximum Clot Firmness; ML: Maximum lysis.
Thrombin Generation in Early Onset Preeclampsia
Patients with EOP showed significantly prolonged lag-time as compared to the control group (6.82 ± 0.59 min, P < .001). The lag-time was significantly prolonged in severe EOP (8.20 ± 0.63 min) as compared to mild EOP group (7.12 ± 0.52 min; P < .001)
The ttPeak was significantly prolonged in mild EOP (13.84 ± 0.76 min) and severe EOP (13.92 ± 0.81) groups as compared with the control group (12.78 ± 0.71; P < .001).
The Peak of thrombin was significantly increased in mild EOP (231.01 ± 34.6 nM) as compared to the Peak of thrombin in women with severe EOP (200.53 ± 13.15 nM) and in the control group (205.81 ± 46.77 nM; P < .001).
Each EOP group showed significantly higher ETP as compared to the control group (1930.77 ± 238.13 nMxmin; P < .05). The ETP, was significantly higher in mild EOP as compared to severe EOP (2653.36 ± 408.72 nMxmin and 2113.75 ± 186.40 nMxmin; P < .001).
The MRI was similar in mild and severe EOP and in the control group.
Thrombin generation was also assessed after addition of thrombomodulin in plasma and compared with the results in the absence of the later by calculating the ratio. The ETP ratio was not significantly different between mild EOP and controls (0.48 ± 0.07 vs, 0.55 ± 0.07 respectively; P > .05) but it was significantly reduced in the severe EOP group as compared to the control group (0.38 ± 0.08 vs, 0.55 ± 0.07 respectively P < .001). Table 3 summarizes the results of thrombin generation in the control and EOP groups.
Calibrated Automated Thrombogram Assay in Women with Early Onset Preeclampsia and Pregnant Controls.
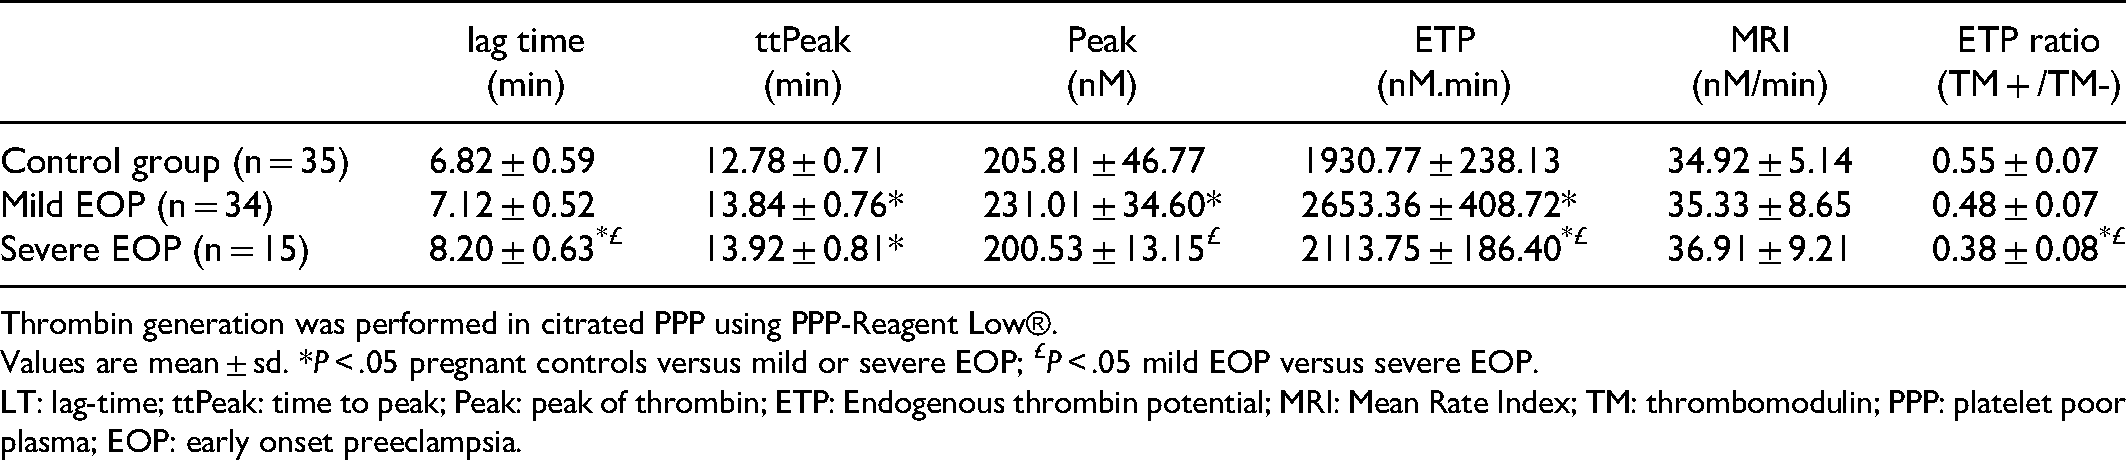
Thrombin generation was performed in citrated PPP using PPP-Reagent Low®.
Values are mean ± sd. *P < .05 pregnant controls versus mild or severe EOP; £P < .05 mild EOP versus severe EOP.
LT: lag-time; ttPeak: time to peak; Peak: peak of thrombin; ETP: Endogenous thrombin potential; MRI: Mean Rate Index; TM: thrombomodulin; PPP: platelet poor plasma; EOP: early onset preeclampsia.
Biomarkers of Hypercoagulability in Early Onset Preeclampsia
Free PS was decreased in all groups as compared to the reference values for healthy individuals. Protein S levels were significantly lower in mild EOP and severe EOP groups as compared to the control group.
The levels of TFPI, TFa, TMa were significantly increased, and the Procoag-PPL was significantly decreased in the two EOP groups as compared to the control group. No statistically significant difference of TFPI, TFa and Procag-PPL was observed between mild and severe EOP groups. The levels of TMa were significantly increased in the severe EOP as compared to mild EOP group. The levels of D-dimer were not significantly different between the mild EOP and the control group. In contrast the D-dimer levels were significantly increased in severe EOP as compared to either mild EOP or the control group.
The TMa/TFa ratio and the TFa/TFPI ratio were significantly increased in both EPO groups as compared to the control group. Fibrinogen was not significantly different among the three studied groups of pregnant women. The PT and aPTT were significantly prolonged in EOP groups as compared to the control group. The prolongation of PT and aPTT were significantly pronounced in severe EOP as compared to the mild EPO group. Antithrombin levels were significantly decreased in EOP groups as compared to the control group. Patients with severe EOP showed significantly lower levels of AT as compared to those with mild EOP. Data are summarized in Table 4.
Biomarkers of Hypercoagulability, in Women with Early Onset Preeclampsia and Pregnant Controls.
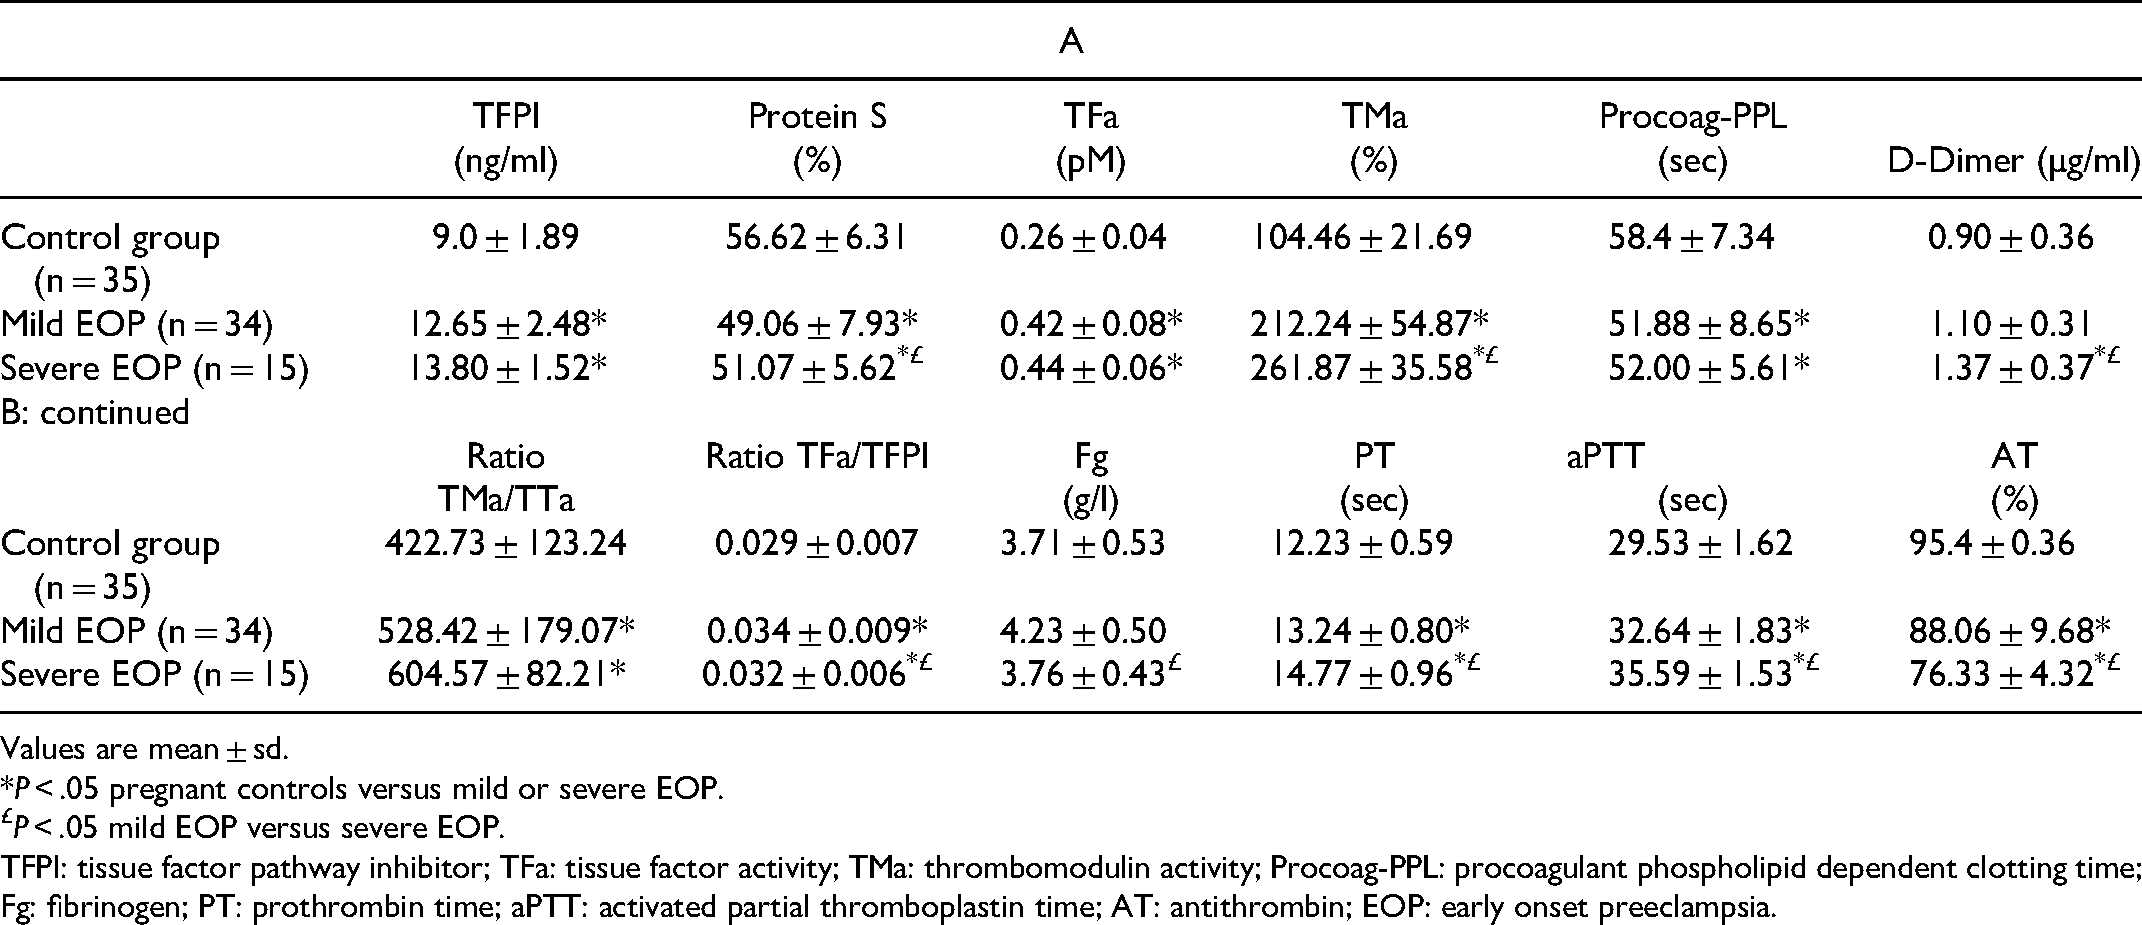
Values are mean ± sd.
*P < .05 pregnant controls versus mild or severe EOP.
P < .05 mild EOP versus severe EOP.
TFPI: tissue factor pathway inhibitor; TFa: tissue factor activity; TMa: thrombomodulin activity; Procoag-PPL: procoagulant phospholipid dependent clotting time; Fg: fibrinogen; PT: prothrombin time; aPTT: activated partial thromboplastin time; AT: antithrombin; EOP: early onset preeclampsia.
Correlation Between Thromboelastometry, Thrombin Generation and Hypercoagulability
In women with severe EOP a significant linear correlation between fibrinogen levels in plasma and MCF values was observed (r = 0.543; P < .05). A linear correlation was also observed between CT and TMa/TFa or TF/TFPI ratio (r = −0.477 ; P < .10 and r = 0.637 P < .02 respectively), as well as between TMa/TFa ratio and the ML (r = −0.503 ; P < .10). TFa was correlated with CT (r = 0.632; P < .02). The D-dimer was correlated with ML (r = 0.560; P < .05). No correlation was found between aPTT or PT and thromboelastometric parameters.
In women with mild EOP a significant linear correlation was observed between fibrinogen levels and MCF values (r = 0.446; P < .01). The TFa/TFPI ratio was correlated with ML (r = −0.441 ; P < .02). The aPTT was correlated with MCF (r = 0.344; P < .05). TFPI was correlated with ML (r = 0.430; P < .02). No significant correlation was found either between aPTT and CT or between PT and CT in EOP patients. In the control group no significant correlation was observed between Fg, aPTT, PT, TF/TFPI ratio and thromboelastometric parameters.
The correlations between thrombogram parameters and biomarkers of hypercoagulability were as follows: In severe EOP group, free TFPI levels were significantly correlated with the Peak, lag time, and ETP (r = −537, P < .05 ; r = 0.575; P < .05 and r = −0.630; P < .02 respectively). Protein S was correlated with the lag-time and MRI (r = 0.791; P < .01 ; and r = −0.756; P < .01 respectively). Thrombomodulin was correlated with ttPeak and MRI (r = −0.607; P < .02; and r = −0.692; P < .02). D-dimer levels were correlated with the Peak (r = 0.549; P < .05). The aPTT was correlated with the lag time (r = 0.555; P < .05). No significant correlation was found between AT and thrombogram parameters.
In the mild EOP group, TFPI was correlated with the lag time and the ETP (r = 0.548; P < .01; r = −0.402; P < .05, respectively). Protein S was significantly correlated with the lag-time and MRI (r = 0.703; P < .01 and r = −0.437; P < .05). TFa was correlated with the Peak (r = 0.672; P < .01), TMa with the ttPeak (r = 0.690; P < .01), TMa/TFa ratio with ttPeak, Peak and MRI (r = 0.647; P < .01, r = −346; P < .05 and r = −491 P < .05 respectively) and the TF/TFPI ration with the Peak (r = 0.494; P < .05).
No significant correlation was found between aPTT, TP, AT and thrombin generation parameters. In pregnant controls no significant correlation was observed between aPTT, PT, TF/TFPI ratio, PS and TFPI and thrombin generation parameters.
In severe EOP, the stronger correlation was seen between PS and TFPI (r = 0.890, P < .01), followed by the correlation of TMa with PS and TFa (r = −0.556; P < .05 and r = 0.525, P < .05 respectively). The aPTT was correlated with PS and fibrinogen (r = 538; P < .05 and r = −0.644; P < .02). No correlation was observed with AT. In mild EOP, PS levels were also correlated with the TFPI (r = 0.516, P < .01) and TFa was correlated with D-dimer (r = −0.370; P < .05). No correlation was observed with PT, aPTT and AT. In pregnant controls aPTT was correlated with TFa (r = 0.497;P < .05)
Principal Component Analysis of Biomarkers of Hypercoagulability and pre-Eclampsia
Since the correlation among most of the biomarkers of hypercoagulability was significant, we performed exploratory data analysis by applying PCA for making predictive models for mild EOP, severe EOP and EOP (including both severe and mild).
The PCA showed that the repartition of data allowed to discriminate the patients with EOP from healthy pregnant women as well as patients with mild EPO from those with severe EOP. Among the analysed predictors, the α, ML, TFa, TM, ttPeak and TM/TFa ratio showed the most significant power to distinguish EOP patients from controls. The first level analysis explained the 27.6% of the variance allowing a clear distinction between the healthy pregnant women and pregnant women with EOP. The α-angle and the TFa also showed a significant power to discriminate patients with mild EOP from those with severe EOP. The second level analysis explained 15.96% of the variance allowing a distinction between the pregnant women with mild and severe EOP (Figure 1A). As shown in the scatterplot (Figure 1B) the studied variables allow to accurately distinguish the three studied groups (health controls, mild and severe EOP).
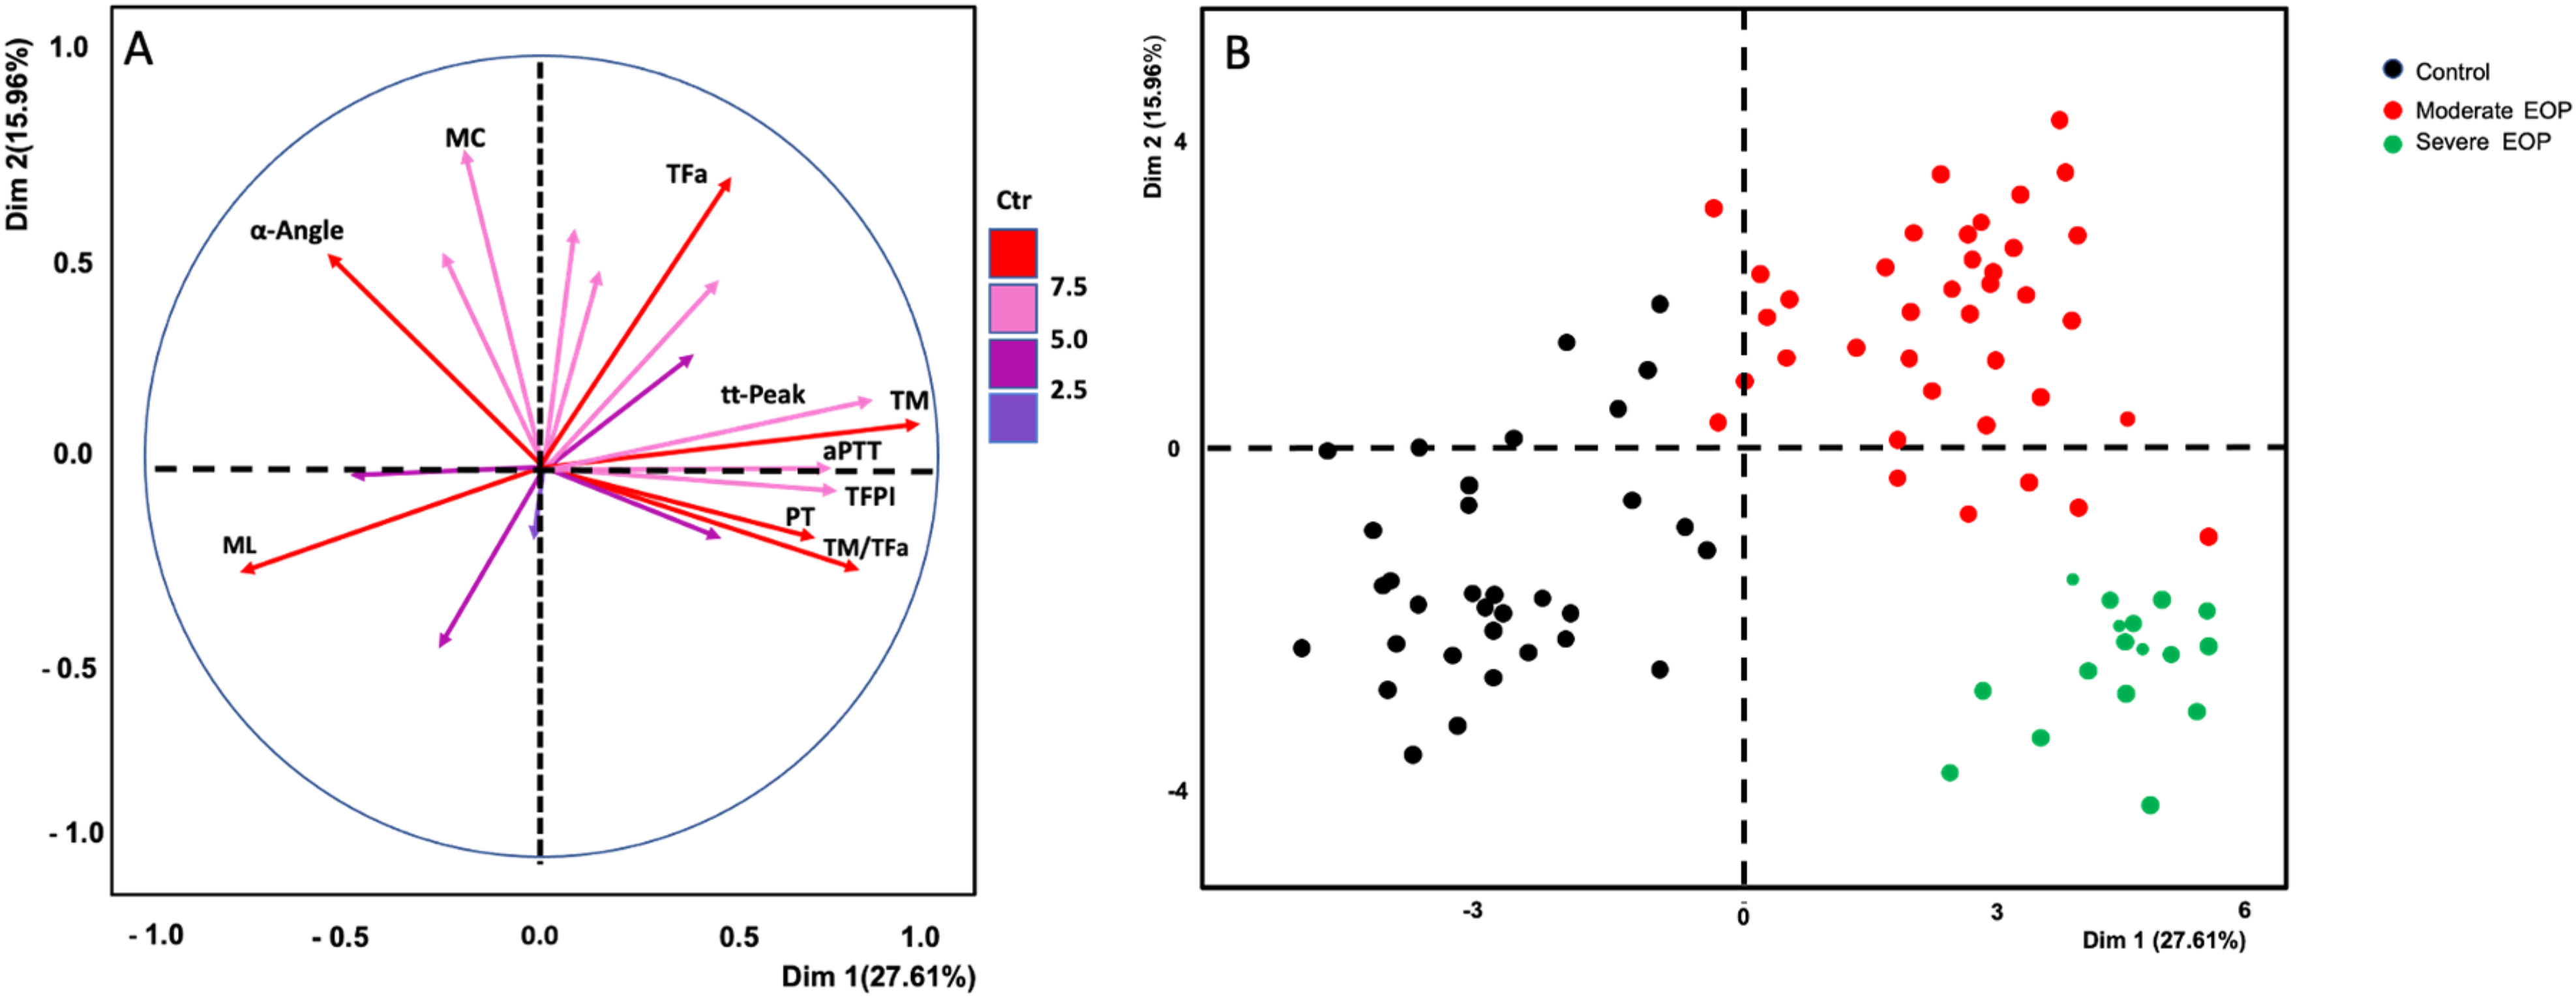
Principal component analysis (PCA) of biomarkers of hypercoagulability for the distinction between patients with early onset preeclampsia (EOP) and controls. Frame A: PCA plot showing the multivariate variation of the studied variables of biomarkers. Vectors indicate the direction and strength of each variable to the overall distribution. Red color indicates the most important contribution to the principal components. Fram B: scatterplot of the distinction of the three studied groups.
Derivation of Score for the Risk of Early Onset Preeclampsia
A set of clinical and biological variables was analyzed to determine those associated with the risk of EOP or severe EOP. The cohort was randomly splitted to respect the rule-of-thumb (the score should include less than 4 predictors).
Feature selection by way of random forest identified overall ranking, while feature reduction identified the top 3 variables with the greatest prediction capacity. The samples were split into two stratified training (n = 60) and validation sets (n = 17), Accordingly the following model was generated:
EOP status = lag-time (min) + ttPeak (min) + Procoag-PPL (sec)
When biomarkers of hypercoagulability were considered according to the severity of EOP in multivariate analysis the lag-time, ttPeak and PPL clotting time were independently associated with the risk of severe EOP.
An increase of the lag time by 1 min over the upper normal limit, the risk of EOP increases by 20-folds. Similarly, the increase of the ttPeak by 1 min over the upper normal limit, the risk of EOP increases by 20.5 folds. Lastly, the increase of the Procoag-PPL clotting time one unit (second) the risk of EOP decreases. Accordingly, a Procoag-PPL clotting time longer than 58,75 s the risk of EOP decreases by 50%.
The sensitivity and the specificity of the score for severe EOP were 71.4% and 61.8%, respectively and the AUC of the ROC analysis is 0.953. (Figure 2).

ROC analysis of the score for prediction of the risk of severe early onset preeclampsia.
Discussion
The ROADMAP-EOP study by applying PCA on 26 biomarkers of hypercoagulability in pregnant women with EOP led to the derivation of a predictive score that includes the thrombin generation parameters lag-time and ttPeak together with the Procoag-PPL® clotting time. The score when applied after the 32 weeks of pregnancy identifies accurately the women at high risk of EOP. The sensitivity and the specificity of the score for severe EOP were 71.4% and 61.8%, respectively and the AUC of the ROC analysis was 0.953. The score, accurately stratifies pregnant women into high and low risk for severe EOP with a sensitivity and specificity of 71.4% and 61.8%, respectively. The ROC analysis yielded an AUC of 0.953. These data suggest that a biological score composed of the Procoag-PPL® clotting time and thrombin generation (Throbmogram-Thrombinoscope® PPP-reagent 1 pM-TF assay) could be a useful tool to identify promptly pregnant women with high probability of mild or severe EOP. An external validation of the proposed methodology needs to be performed in a large prospective observational multicenter study.
The implication of plasma hypercoagulability, enhanced thrombin generation, impaired fibrinolysis and endothelial cell activation in the manifestation of severe preeclampsia has been shown in recent studies.21–4 The ROADMAP-EOP study contributes to the understanding of the role of hypercoagulability and endothelial cell activation in the worsening process of EOP. The data presented herein stress out the impact of endothelial cell activation, consumption of the natural coagulation inhibitors (AT and PS), increase of TFPI, TMa and TFa, and increased clot lysis time in the worsening process of EOP. The comparison between thrombogram and thromboelastometry assays revealed that the lag-time and the ttPeak of thrombin generation showed higher performance than the chronometric parameters of thrombelastometry in the evaluation of the risk of EOP and its severity.
Patients with EOP showed significant shortening of the Procoag-PPL® clotting time which translates an important increase of the concentration of procoagulant phospholipids in plasma.
The data provided by the ROADMAP-EOP study underline the importance of the procoagulant phospholipids in the worsening process of EOP. 25 High levels of circulating membrane microparticles or extracellular vesicles have been associated with vascular complications of pregnancy and the risk of fetal loss.26–28 Some of them, bear active TF and most of them expose procoagulant phospholipids resulting in triggering and enhancement of thrombin generation.
Women with mild or severe EOP showed enhanced thrombin generation documented by increased ETP and Peak as compared to healthy pregnant women.
Consistent with the recent literature, our study found that the AT activity in women with EOP was lower than that of healthy pregnant women.29, 30 In addition, the decrease of PS or AT is corelated with the severity of EOP. Total and free PS levels decrease in healthy pregnant women during pregnancy.31, 32 As it was expected, ETP and Peak increase was inversely correlated with PS levels which are influenced by the exaggerated systemic maternal inflammation characterizing patients with EOP.,33, 34
Mild and severe EOP are characterized by elevated TFPI levels, reflecting endothelial cell activation. In vitro modelization experiments and epidemiological studies showed that the increase of TFPI is correlated with activation of endothelial cells and vascular complications in patients with cardiovascular disease. 35 The involvement of TFPI in lag-time and ttPeak prolongation found in our study corroborates the findings reported by Egan et al who showed that women with EOP present with attenuated thrombin generation and significantly increased TFPI levels in plasma. 24
An optimal balance between TF and TFPI is of major importance for normal placenta function and pregnancy outcome. 36 The ROADMAP-EOP study showed increased TFa and TFPI Ievels in pregnant women with EOP, and significantly higher values of TFa/TFPI ratio as compared to the normal pregnancy group. Despite a physiological regulation by endogenous TFPI, the increase of TFPI was insufficient. Indeed, the ratio TFa/TFPl was significantly higher in women with EOP than in the control group.
Thromboelastometry profiles, showed that women with severe EOP had significantly delayed kinetics of clot formation and lower clot firmness as compared to either the control group or the patients with mild EOP. These alterations were correlated with the platelet count. Indeed, women with severe EOP had thrombocytopenia. In contrast, the platelet count was within the normal range in the control group and in the mild EOP group. Though, patients with mild EOP showed significantly decreased ML as compared with healthy pregnant women.
The present study has some limitations. The size of the EOP cohort provided sufficient statistical power for the derivation of the score but it did not allow any internal validation of the model. The findings of the present study are restricted to the assessment of procoagulant phospholipids and thrombin generation in plasma using only the assays and the reagents employed. The performance of other methods which measure thrombin generation (ie in-house assays, other combinations of reagents or other techniques available in the market) should be assessed in suitably designed prospective studies.
In conclusion, the ROADMAP-EOP study provides evidence showing that activation of endothelial cells and blood hypercoagulability are driven events in the worsening of EOP. Among a large panel of biomarkers and coagulation assays, thrombin generation test and PPL dependent clotting time emerged as clinically relevant for the evaluation of the risk of severe EOP.
Footnotes
Acknowledgments
The authors wish to thank Stago for offering assays and reagents for the measurement of the studied biomarkers of hypercoagulabilty in the frame of institutional and unconditional collaboration with the Research Group “Cancer, Angiogenesis, Thrombosis” Research Team "Cancer, Vessels - Biology and Therapeutics", INSERM UMR_S 938, Sorbonne Université.
Data Sharing
Data can be shared - after contacting the corresponding author (grigorios.gerotziafas@inserm.fr)- with qualifying researchers who submit a proposal with a valuable research question. A contract should be signed.
Declaration of Conflicting Interests
The author(s) declared no potential conflicts of interest with respect to the research, authorship, and/or publication of this article.
Funding
The author(s) received no financial support for the research, authorship, and/or publication of this article.