
Abstract
There is evidence that diet and variation in lipid metabolism can influence blood coagulation, but little is known about the effect of Ramadan fasting on plasmatic coagulation pattern. We investigated the effect of Ramadan fasting on thrombin generation (TG) in patients with cardiovascular disease (CVD) risks, and we aimed to assess the effect of lipid profile on TG parameters. The study was conducted in 36 adults having at least 2 CVD risks and in 30 healthy controls. Coagulation pattern was assessed by both classical clotting times and TG test. A complete lipid profile was performed simultaneously. Patients were invited 2 times: 1 week before Ramadan and during the last week of the Ramadan. The TG parameters were not different in patients with CVD risks compared to healthy controls. Fasting had no effect on plasmatic coagulation parameters and on TG profile. Individual analysis of the mean rate index (MRI) of TG revealed 3 groups: group 1 with no modification of MRI, group 2 with a significant increase in MRI (81.64 nM/min vs 136.07 nM/min; P < .001), and group 3 with a significant decrease in MRI (125.27 nM/min vs 73.18 nM/min; P = .001). Only in group 2, a significant increase was observed in total cholesterol and low-density lipoprotein cholesterol. Changes in lipid profile during Ramadan fasting did not influence the global coagulation pattern in patients with CVD risks. Whereas, a significant increase in the propagation phase of TG was associated with a significant increase in cholesterol levels, which was not found with the other TG parameters.
Introduction
Diet and irregularities in lipid metabolism can influence blood coagulation. Indeed, increased coagulation was reported in healthy individuals and patients with hyperlipemia during the postprandial state. Ramadan fasting is an intermittent fasting that extends everyday from dawn till sunset during 1 month/lunar year. 1 It entails a major shift in the timing and the content of meals. During Ramadan, patients continue to take their usual treatment but with modifications in prescription schedules. However, Ramadan fasting may alter pharmacologic properties of some medications resulting from the change in eating patterns and physiological parameter disturbances. 1,2 Several studies focused on the effect of fasting on anthropometric and metabolic parameters in healthy individuals or in patients with metabolic syndrome and diabetics and showed that Ramadan fasting causes definite changes in lipid profile. 2 However, little is known about the effect of Ramadan fasting on hemostatic profile particularly in patients with cardiovascular disease (CVD) risks who are exposed to hypercoagulable states. The majority of these patients including those with stable coronary artery diseases are particularly vulnerable to the modification of the coagulation pattern. 3 Many of these patients are willing to observe fasting during Ramadan. Hence, management of patients with CVD risks poses challenges to the medical staff, and thus the evaluation of the potential risks of fasting on their plasmatic coagulation profile is prerequisite to any medical recommendations.
Coagulation is routinely assessed by 2 classic clotting times, the prothrombin time (PT) and the activated partial thromboplastin time (aPTT) 4 ; both tests have a very limited value in the detection of hypercoagulable states. Thrombin generation (TG) test is a promising tool for such phenotyping. 5,6 It measures the overall thrombin activity and is therefore more useful than the conventional coagulation tests to look for the phenotype of hypocoagulability or hypercoagulability. 5,7 Nowadays, it has become clear that measurement of TG is useful for the management of venous thrombosis. 8 Although a connection between arterial thrombosis and TG is very likely, it is not proven with the same rigor as in venous thrombosis. Few data are available regarding the study of TG on patients with CVD risks. 9 Interestingly, TG test is also helpful in the management of antithrombotic drugs, such as low-molecular-weight heparins (LMWHs), 10 for the treatment of patients with acute coronary syndromes.
In the present study, we aimed to investigate whether fasting during Ramadan had any effect on the coagulation pattern of patients with CVD risks, by measuring the PT and aPTT times and by assessing TG in platelet poor plasma (PPP). We evaluated particularly the effect of lipid profile on TG parameters in order to find the suitable parameters for screening hypercoagulable states and anticoagulants monitoring during Ramadan fasting.
Materials and Methods
Patients and Study Design
This prospective cohort study was conducted during Ramadan of August 2010 at the Fattouma Bourguiba Hospital (Monastir, Tunisia) and had received approval from the institutional review board of our institution. Thirty-six patients (21 men and 15 women) were included. They were recruited from 3 outpatient specialized clinics (cardiology, endocrinology, and internal medicine) and the emergency department of Fattouma Bourguiba Hospital. Patients were eligible for the study if they had at least 2 conventional CVD risk factors according to Framingham criteria and had already planned to fast during Ramadan month. The CVD risk factors considered for this study included the following: hypertension, diabetes mellitus, dyslipidemia, smoking, obesity, and history of coronary artery disease heredity. Recruited patients were subsequently directed to the clinical center especially dedicated to the study. Exclusion criteria were patients under 40 years, unstable diabetes, recent (within the last 3 months) cardiovascular acute events or an acute comorbidity decompensation, current use of antidepressants, chronic disease with <1 year expected mortality, serum creatinine levels higher than 1.4 mg/dL, and hepatic function tests at least 2.5 times higher than the normal levels. Patients were excluded secondarily if they do not observe the fast or stop their treatments.
Two clinical visits were planned for each included patient: the first visit 1 week before Ramadan (baseline) and the second visit during the last week of Ramadan. At each time assessment, physical and clinical examinations were done by the same investigators. The following clinical data were recorded: demographic characteristics, previous medical history, Framingham score, and physical examination data.
Controls
Thirty age- and sex-matched individuals were chosen as controls for clotting times, TG, and lipid profile analysis. None of the controls had a history of CVD, diabetes, dyslipidemia, arterial hypertension, malignancy, liver insufficiency, or used antithrombotic drugs. All participants gave their consent to participate.
Blood Collection and Storage
For each patient, 3 samples were taken at 9:00
Clotting Times
The PT and aPTT were measured by the 1-stage clotting assays using the STA Compact (Diagnostica Stago, Asnieres, France). Thromboplastin (STA-NEOPLASTINE CI PLUS; Diagnostica Stago) was used as a trigger for the PT, and phospholipids, silice (STA-PTT Automate; Diagnostica Stago) and calcium (STA-CaCl2 0.025 M, Diagnostica Stago) were used for aPTT.
The TG Test
The TG was studied in vitro according to Hemker et al 11 using the Calibrated Automated Thrombogram (CAT) assay (Thrombinoscope B.V., Maastricht, the Netherlands), according to the manufacturer’s instructions. The CAT assay relies on a low-affinity fluorogenic substrate (Z-Gly-Gly-Arg-AMC) to continuously monitor thrombin activity in plasma. It requires 2 fluorescence measurements in the same plasma. In the measurement well, coagulation is triggered with tissue factor (TF), phospholipids, and CaCl2; in the calibration well, only the thrombin calibrator and CaCl2 are added to plasma. Thrombin activity in both wells is monitored continuously via conversion of the low-affinity fluorogenic substrate added to plasma. Fluorescence readings are automatically converted into TG curves by dedicated software. 6 Briefly, 80 µL of PPP was mixed with 20 µL of PPP reagent (Biodis, Stago, PPP reagent®,Thrombinoscope B.V., Diagnostica Stago, Asnieres, France) containing 5 pM TF and 4 µM phospholipids (final concentrations) in 96-well microtiter plates. Fluorogenic substrate of 20 µL and CaCl2 were added and then the fluorescence intensity was detected at a wavelength of 355 nm (excitation filter) and 460 nm (emission filter). The curve obtained describes the variation in thrombin’s amount during the activation of coagulation. 6,9 The thrombogram parameters analyzed were (1) the lag time of TG (lagtime), the time to beginning of the burst of growth of TG (initiation phase), (2) time to Peak (ttPeak), the time needed to reach the maximum concentration of thrombin, (3) the maximum concentration of thrombin (Peak), (4) the mean rate index (MRI) of the propagation phase of TG calculated by the formula: Peak/ (ttPeak-lagtime) and the area under the curve or endogenous thrombin potential (ETP) representing the total thrombin activity (Figure 1). 12
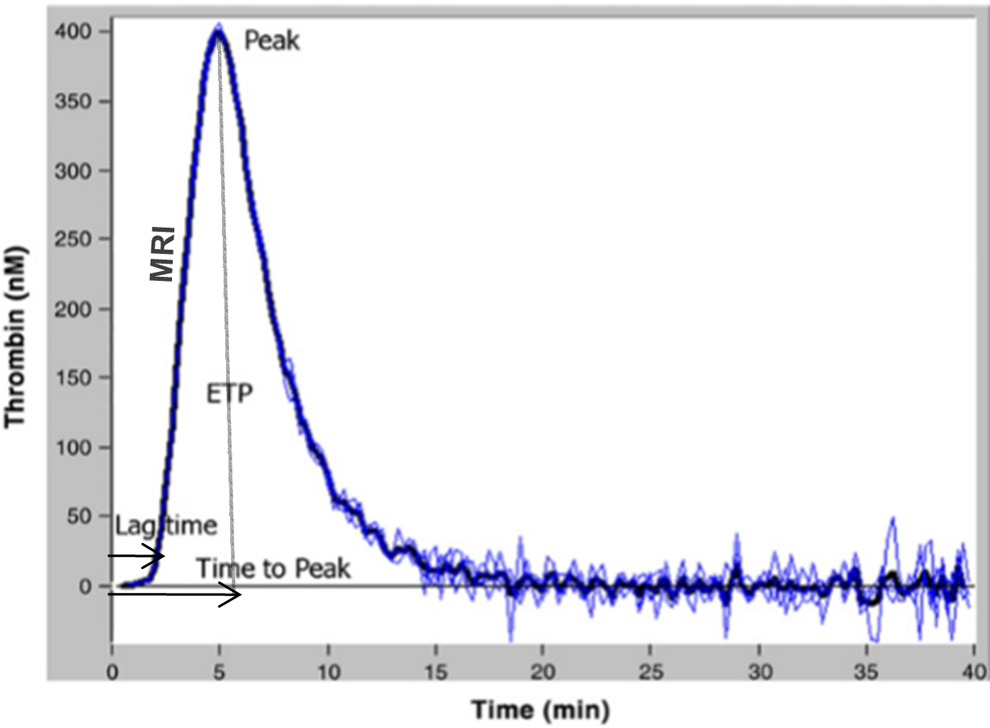
Curve and parameters of thrombin generation assay.
Plasma Lipid Measurements
Total cholesterol, high-density lipoprotein cholesterol (HDL-C), and triglyceride were measured using a Cobas 6000TM analyzer (Roche Diagnostics, Rotkreuz, Switzerland) with reagents recommended by the manufacturer by enzymatic colorimetric methods. The low-density lipoprotein cholesterol (LDL-C) was estimated using the Friedewald formula. Normal ranges for parameters of lipid profile were those performed and adopted in our laboratory: triglycerides (0.5-1.7 mmol/L), total cholesterol (4.4-5.2 mmol/L), HDL-C (≥1.1 mmol/L for male and ≥1.3 mmol/L for female), and LDL-C (≤4 mmol/L).
Statistics
The Kolmogorov-Smirnov test was used to check the normal distribution of continuous variables. Normally distributed variables were presented as mean ± standard deviation (SD) and were compared using student t test. For nonnormally distributed variables, medians were used and compared by nonparametric Wilcoxon test. Pearson correlation coefficients were used to examine the correlation between TG parameters and lipid profile. Data were analyzed using the SPSS software (SPSS Inc, Chicago, Illinois) version 19. P < .05 was considered as the cutoff value for significance.
Results
Patients and controls were 60.67 ± 9.21 and 55.9 ± 7 years, respectively. The number of male was higher than the female participants among patients and controls. Seventeen patients and 17 controls were smokers. The most frequent CVD risk in patients’ group was hypertension (80.6%) then diabetes (63.9%) and dyslipidemia (41.7%). Demographic and clinical characteristics of patients and controls are reported in Table 1.
Demographic and Clinical Characteristics of Healthy Controls and Patients.a
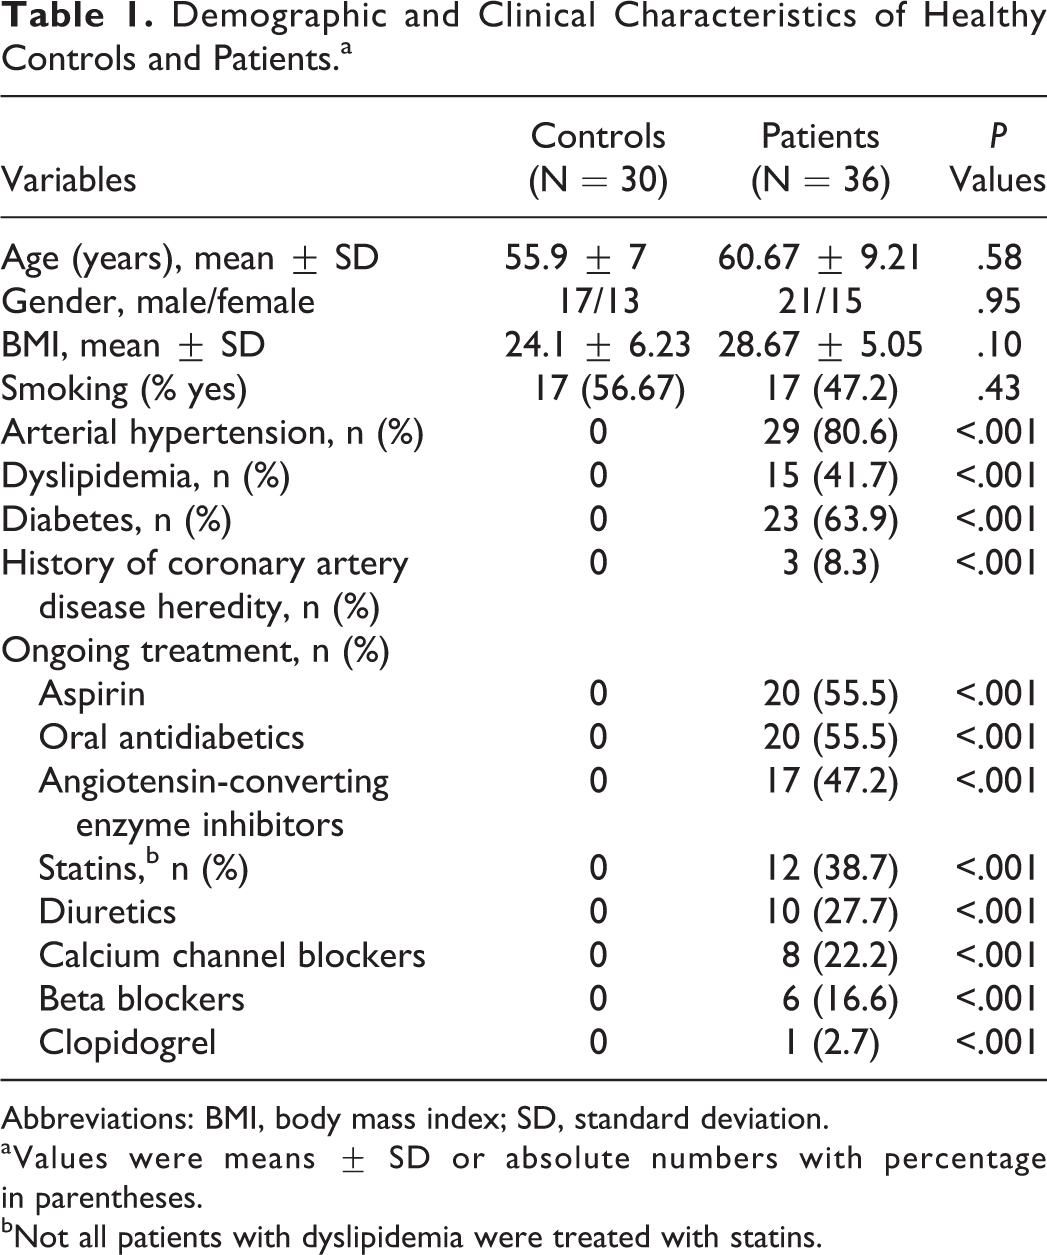
Abbreviations: BMI, body mass index; SD, standard deviation.
aValues were means ± SD or absolute numbers with percentage in parentheses.
bNot all patients with dyslipidemia were treated with statins.
The PT and aPTT of patients before Ramadan and in controls were quite similar (12.66 ± 2.56 seconds vs 12.96 ± 1.78 seconds and 33.6 ± 6.2 seconds vs 31.5 ± 5.1 seconds, respectively). The PT and aPTT values during the last week of Ramadan did not differ from those before Ramadan (12.54 ± 2.68 seconds vs 12.66 ± 2.56 seconds and 33.1 ± 6.9 seconds vs 33.6 ± 8.2 seconds, respectively).
Parameters of the thrombogram in controls and in patients before and during fasting conditions are shown in Table 2. The TG parameters did not differ significantly between controls and patients with CVD risks. In addition, Ramadan fasting did not change TG parameters when compared to those obtained before Ramadan (P > .05).
Thrombin Generation Parameters in Patients Before and During Ramadan Fasting and in Healthy Controls.a
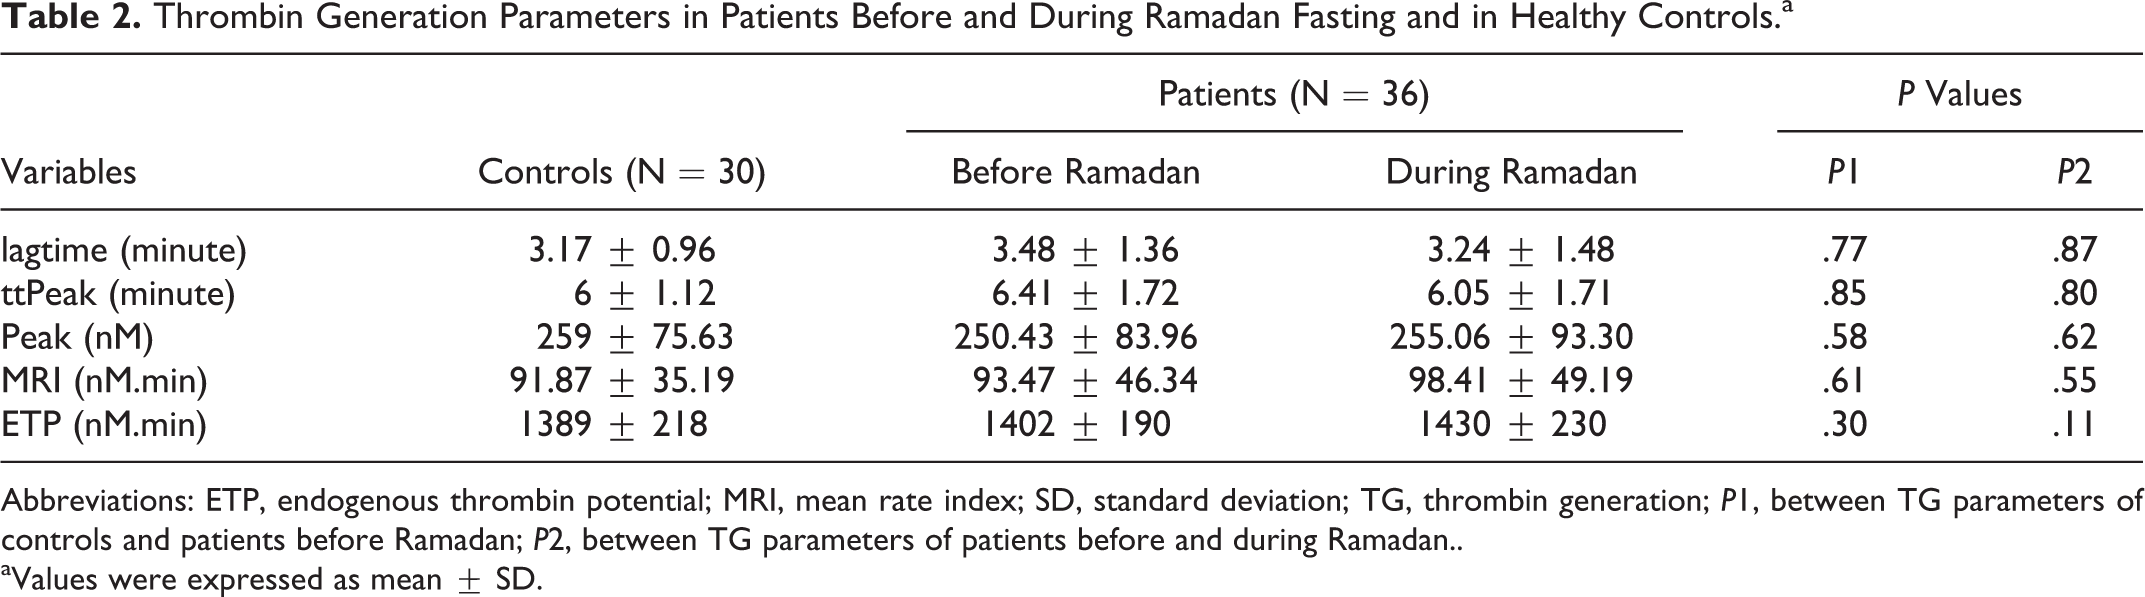
Abbreviations: ETP, endogenous thrombin potential; MRI, mean rate index; SD, standard deviation; TG, thrombin generation; P1, between TG parameters of controls and patients before Ramadan; P2, between TG parameters of patients before and during Ramadan..
aValues were expressed as mean ± SD.
Interestingly, analysis of the MRI parameter showed that it was variably affected by fasting and allowed to distinguish between 3 groups of responders with comparable number of patients: group 1 (n = 11) with no modification of MRI (MRI before Ramadan = 76.72 nM/min vs MRI during Ramadan = 75.72 nM/min; P = .73); group 2 (n = 14) with a significant increase of MRI (MRI before Ramadan = 81.64 vs MRI during Ramadan = 136.07 nM/min; P < .001); and group 3 (n = 11) with a significant decrease of MRI (MRI before Ramadan = 125.27 nM/min vs MRI during Ramadan = 73.18 nM/min; P = .001; Figure 2). The same analysis was not as successful with the other TG parameters (lagtime, ttPeak, peak, and ETP). Comparison between the 3 patient groups did not show any significant differences regarding demographic or clinical characteristics subsequently cited.
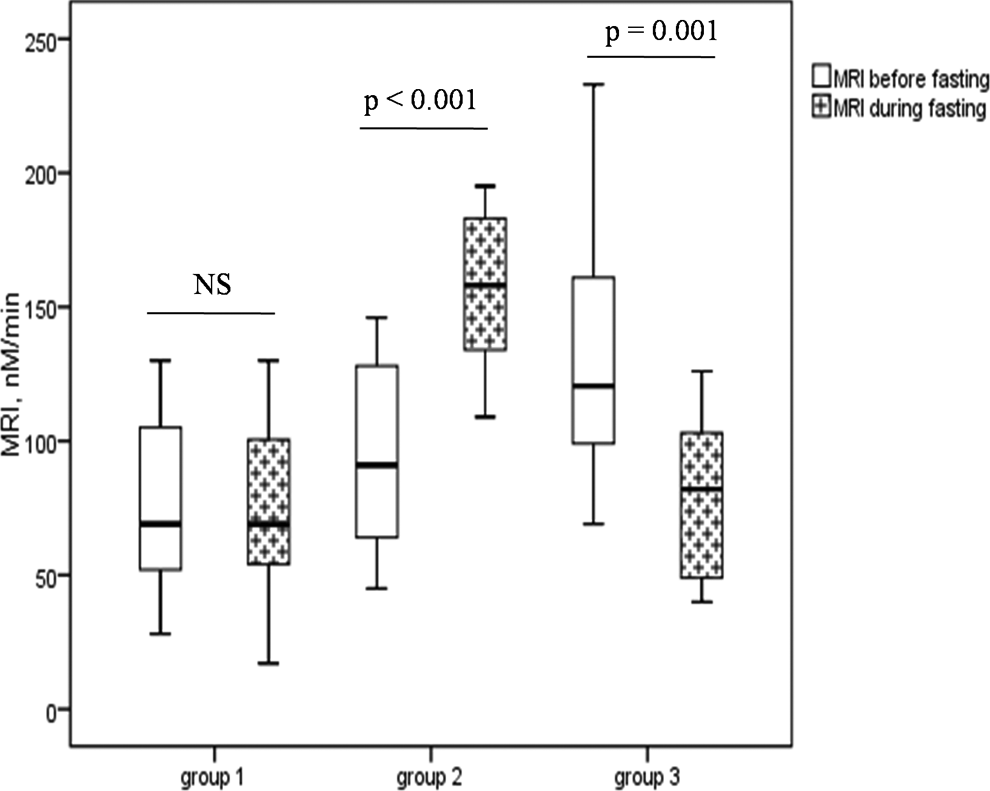
Effect of Ramadan fasting on MRI. Group 1: patients with no modification of MRI; group 2: patients with a significant increase in MRI; group 3: patients with a significant decrease in MRI. The box plot shows median, upper, and lower quartile with extensions to the 5th and 95th percentiles. MRI indicates mean rate index; NS,=not significant.
With regard to lipid profile, no differences were observed between controls and patients with CVD risks. Similarly, there was no significant change in triglycerides, total cholesterol, HDL-C, and LDL-C in patients during Ramadan (Table 3). Correlation analysis in the whole samples of patients (n = 72) revealed that MRI was neither statistically correlated with total cholesterol (r = 0.06, P = .61), HDL-C (r = −0.22, P = .10), and LDL-C (r = 0.17, P = .26), nor by triglycerides (r = −0.13, P = .46). Similarly, no strong association was found between the other TG parameters and lipid profile (r ranging from −0.01 to 0.37). Interestingly, the analysis of lipid profile in the 3 MRI response groups had shown a significant increase in total cholesterol (4.87 ± 0.76 mmol/L vs 5.31 ± 1.05 mmol/L; P = .015; Figure 3B) and LDL-C (2.85 ± 0.56 mmol/L vs 3.15 ± 0.76 mmol/L; P = .038) in group 2 (Figure 3D). However, no significant change was observed in triglycerides (Figure 3A) and HDL-C (Figure 3C). In groups 1 and 3, we did not find a significant change in any of lipids variable.
Lipid Profile in Patients Before and During Ramadan Fasting and in Healthy Controls.a
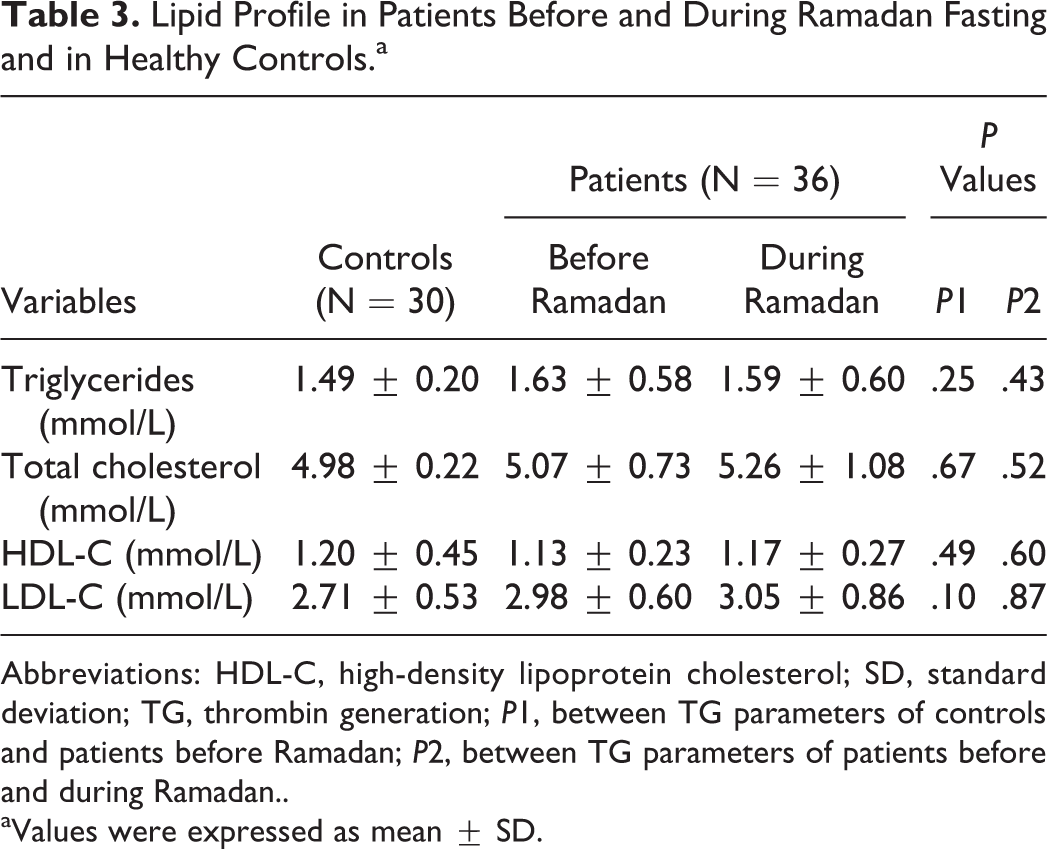
Abbreviations: HDL-C, high-density lipoprotein cholesterol; SD, standard deviation; TG, thrombin generation; P1, between TG parameters of controls and patients before Ramadan; P2, between TG parameters of patients before and during Ramadan..
aValues were expressed as mean ± SD.
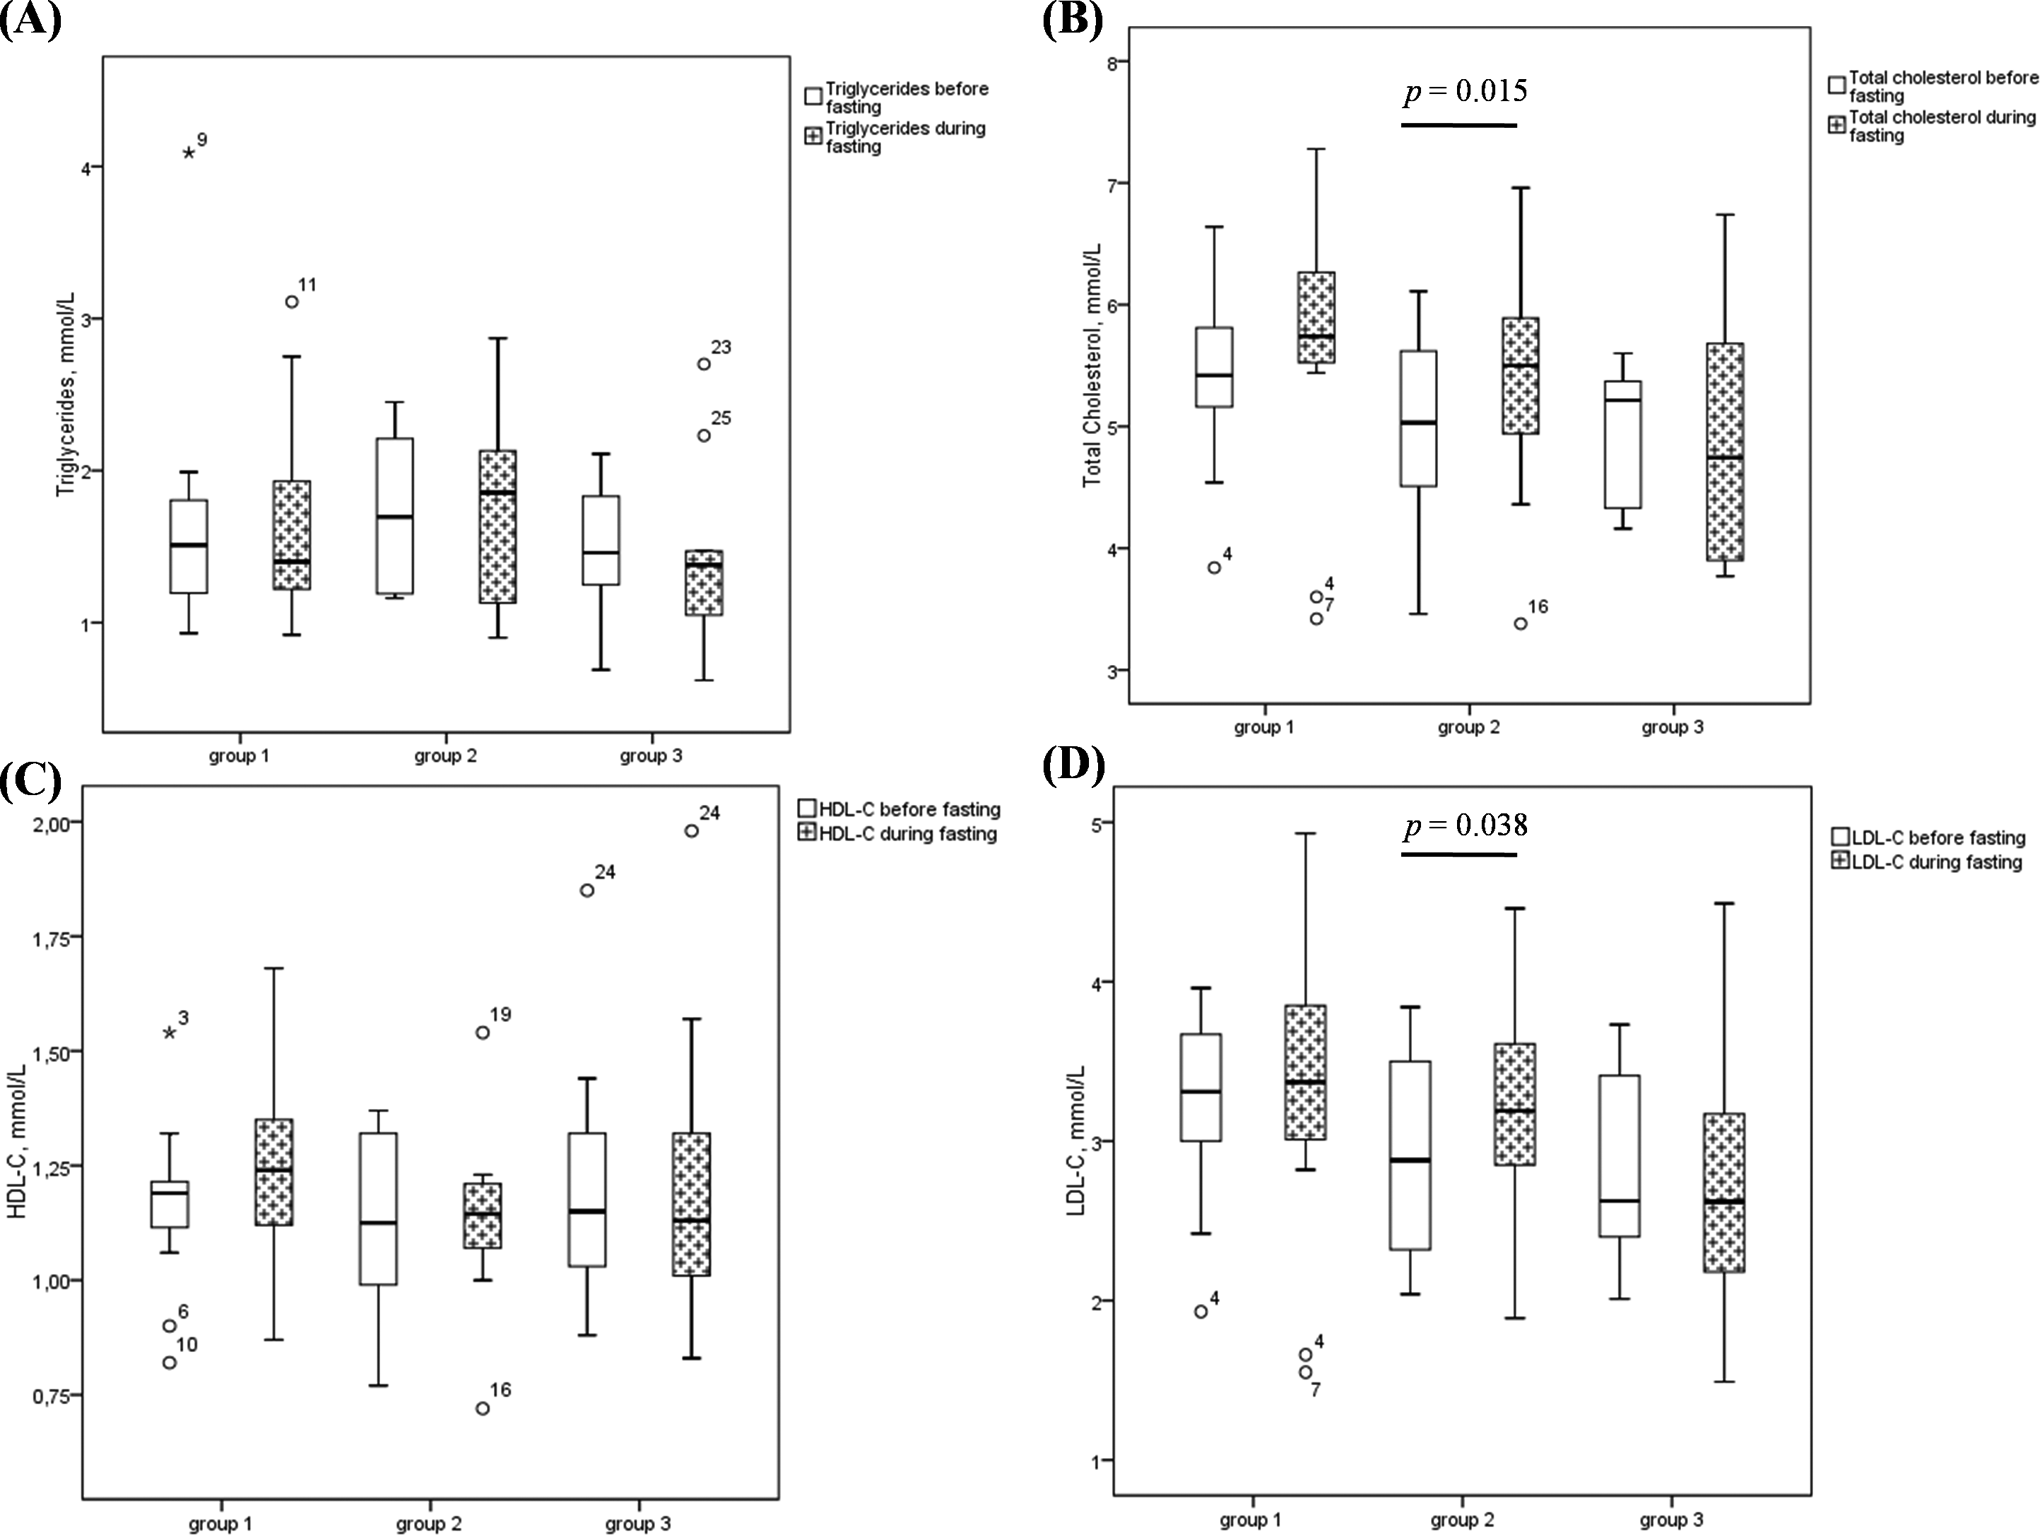
Changes in lipid profile before and during Ramadan in the 3 groups of MRI responders. A, triglycerides. B, total cholesterol. C, HDL-C. D, LDL-C. The box plot shows median, upper, and lower quartile with extensions to the 5th and 95th percentiles. Points further away (*, °) show outliers. HDL-C indicates high-density lipoprotein cholesterol; LDL-C, low-density lipoprotein cholesterol; MRI, mean rate index.
Discussion
Ramadan fasting disturbs the routine dietary habits of people. They refrain from eating and drinking from dawn to dusk. Furthermore, sleep duration and physical activities are reduced. Although fasting is not obligatory for the sick, many patients including those taking multiple medications are motivated to observe Ramadan fasting. There is a remarkable contrast between the large number of patients with CVD risks who participate to Ramadan fasting and the lack of knowledge about the potential risks of occurrence of acute cardiovascular adverse events since they would be exposed to a hypercoagulable state. Some previous clinical findings supported that Ramadan fasting did not increase the incidence of acute cardiovascular adverse events and stroke. 13,14 To our knowledge, this is the first study evaluating the effect of Ramadan fasting on the coagulation pattern of patients with CVD risks using CAT assay.
First, we found that PT and aPTT of patients with CVD risks were not different from those of controls and that Ramadan fasting did not affect the coagulation pattern of plasma when assessed by the classical clotting tests. Results were in accordance with those of Aksungar et al 15 who did not find an effect of Ramadan fasting on clotting times measured on plasma of healthy individuals. However, Saleh et al 16 had investigated the effect of Ramadan fasting on 103 healthy individuals, and they showed a significant decrease in PT but not on aPTT. In another study, Aybak et al 17 showed a significant decrease in clotting times during Ramadan. On the contrary, Huber et al 18 reported that PT and aPTT increased significantly during the 1-week subtotal fasting in healthy individuals but remained within the normal limits. Despite these differences, it is well accepted that these tests have no value in detecting hypercoagulable states.
Then, our study did not find a difference in TG parameters between controls and patients with CVD risks. We also showed that Ramadan fasting had no effect on TG parameters, which suggest that patients with CVD risk factors are not exposed to an increased risk of hypercoagulable state. In the most typical case, hypercoagulable state is manifested by shortened chronometric parameters and increased peak, MRI, and ETP. 19 According to the literature, thrombin formation may contribute to the development of the atheromatous lesion itself. 3,20 So, it is of interest to determine the predictive potential of TG test to estimate arterial thrombosis risk. 19,21 In connection with this subject, elevated thrombin formation (peak and ETP) was observed in atherosclerotic disorders such as echogenic carotid plaques. 6 Skeppholm et al 22 investigated TG during and after an acute coronary syndrome. Data obtained from CAT showed that the peak was higher at admission and after 6 months compared to controls. However, they could not document any increased TG in vivo by (F1+2). As it was explained elsewhere, 23 they argued that coronary thrombus is due to a small coronary arterial lesion, which does not necessarily cause increased TG.
A closer analysis of TG parameters during Ramadan had distinguished between 3 groups of MRI responders with comparable number of patients unlike the other parameters. Each individual’s MRI yielded a particular evolution. The MRI incorporates the velocity at which thrombin is formed and is obtained as the slope of the TG curve. This parameter is very interesting first because it is recognized as thrombosis predictor 8 and then because it is very useful for anticoagulant management. 10 The LMWHs have been widely studied in various clinical trials and have been proven useful in clinical efficacy, safety, and practical characteristics for acute coronary syndrome treatment. 24 The MRI is the most sensitive to the anti-Xa activity of LMWHs. 10
In our study, we found that Ramadan fasting did not generate a significant modification in lipid profile. Our results are not in agreement with several studies. 2 In fact, during Ramadan, not only the eating pattern is altered but also the amount and type of food consumed. Foods that are rich in fat and protein, or that contain large quantities of carbohydrate, are selectively consumed in Ramadan. 25 However, nutrition behavior and life habits that characterize each population may be different. Consequently, there was a great disparity in the available data concerning the influence of fasting on lipid profile ranging from a protective effect to deleterious ones. 2
Interestingly, we showed that the patients, who had significantly increased their MRI during Ramadan, also had a significant increase in total cholesterol and LDL-C. It is already known that LDL-C is implicated in atherosclerotic plaque development. After the lesion of this plaque, the arterial wall exposes TF, a receptor for plasma factor VII which leads to an increase in TG. 26 Otherwise, addition of fat to the diet causes a rapid increase in factor VII coagulant activity and then an increased conversion of the zymogen to factor VIIa. 18 Furthermore, it has been demonstrated that plasma lipoprotein have the capacity to activate platelets and to support the assembly and the activity of the prothrombinase complex. 25,27 –29 Of note, the MRI is influenced by the rate of formation of prothrombinase complex, 10 which explains the relation between the increase in cholesterol levels and MRI during Ramadan fasting. However, no significant relationship with the lipid profile was found in patients who had stable or lowered values of MRI during Ramadan compared to the corresponding values before Ramadan. About the limits of our study, no differences were observed between controls and patients with CVD risks with regard to lipid profile. These results were probably affected by the use of statins. In addition, we require more patients with CVD risks to elucidate our findings and for comparison with healthy controls who observe Ramadan fasting. A food intake survey could also be very useful for patients and controls.
In conclusion, we found that changes in lipid profile during Ramadan fasting did not influence the global coagulation pattern in patients with CVD risks. Concerning TG, patients with CVD risks did not have a hypercoagulable state compared to controls. During Ramadan fasting, a significant increase in the propagation phase of TG was associated with a significant increase in cholesterol levels and especially LDL-C which was not found with the other TG parameters. Thus, the MRI is not the suitable tool to screen hypercoagulable states in patients with CVD risks or probably to monitor LMWHs treatment during Ramadan fasting.
Footnotes
Authors’ Note
Mouna Sassi carried out the TG test, wrote the paper, and provided the article outline. Taher Chakroun and Saoussen Chouchène contributed to the analysis and interpretation of data. Ilhem Hellara carried out biochemical analysis. Hamdi Boubaker, Mohamed Habib Grissa, and Ines Khochtali conducted the statistical analyses and participated in patient recruitment. Mohsen Hassine, Faouzi Addad, Ismail Elalamy, and Semir Nouira designed the research and provided critical input into the manuscript.
Acknowledgments
The authors thank all the members of Ramadan research Group.
Declaration of Conflicting Interests
The author(s) declared no potential conflicts of interest with respect to the research, authorship, and/or publication of this article.
Funding
The author(s) disclosed receipt of the following financial support for the research, authorship, and/or publication of this article: This study was supported by the Research Laboratory LR06SP21, Emergency Department, 5019, Monastir, Tunisia.