
Abstract
Observational and in vitro studies suggest that vitamin D may have antithrombotic activity. This study aimed to examine the relationship between vitamin D supplementation and thrombin generation. Serum 25-hydroxyvitamin D (25(OH)D) and thrombin generation parameters were measured in 73 healthy volunteers. Participants with serum 25(OH)D <50 nmol/L (n = 53) were treated with vitamin D3 and tested for 25(OH)D and thrombin generation at the end of treatment. Lag time and time to peak decreased after treatment by a mean of −0.49 ± 0.51 minute (P < .001) and −0.76 ± 0.70 minute (P < .001), respectively, whereas endogenous thrombin potential and peak height increased after treatment by a mean of 170.1 ± 339.8 nmol/L minute (P = .001) and 34.2 ± 47.8 nmol/L (P < .001), respectively. Treatment with vitamin D supplementation seems to have prothrombotic effect in patients with vitamin D insufficiency. These findings should be interpreted with caution and need to be replicated in future studies.
Introduction
Historically, the function of vitamin D was thought to be limited to keeping normal mineral balance and maintaining bone health. 1 However, recent studies suggest that vitamin D may play a pivotal role in extraskeletal health. 1,2 Clinical and in vitro studies suggest that vitamin D deficiency may be associated with increased risk of thrombosis. Calcitriol was demonstrated to reduce the rate of venous and arterial thrombosis in patients with cancer in a clinical trial, 3 and the risk of venous thromboembolism was found to increase with decreasing serum 25-hydroxyvitamin D (25(OH)D) levels in a large cohort study. 4 Further the risk of ischemic stroke but not hemorrhagic stroke increased with decreasing serum 25(OH)D levels. 5 Nonetheless, no association was found between serum 25(OH)D and venous thromboembolism in 1 study. 6 In addition, low serum 25(OH)D levels were found to be associated with increased risk of myocardial infarction. 7 –9 The molecular mechanisms of this association remain incompletely understood; several mechanisms are suggested including an anticoagulant activity of vitamin D. 10 Indeed, vitamin D receptor (VDR) knockout mice were found to be in a prothrombotic state. 11 1,25-Dihydroxyvitamin D3 (1,25(OH)2D3) induced secretion of tissue plasminogen activator from rat heart microvascular cells 12 and downregulated tissue factor (TF) expression in human myelogenous leukemia cells and monocytes. 13 Tissue factor pathway inhibitor correlated positively with serum 25(OH)D levels. 14 However, these studies used a specific coagulation test, which is not enough informative on the overall thrombotic activity. In recent years, the assessment of thrombin generation, a better indicator for overall thrombotic activity, became available with the calibrated automated thrombogram (CAT). 15,16 In this study, we aimed to examine the relationship between vitamin D supplementation and thrombin generation as a measure of overall thrombotic activity.
Materials and Methods
The study was conducted in Ha'emek Medical Center, in the northeastern area of Israel. The study was approved by the local institutional review board and ethics committee. All participants gave written informed consent prior to the study.
Study Population and Data Collection
Individuals who were eligible for enrollment in the study were healthy volunteers selected from health care workers of the Ha'emek Medical Center. Inclusions criteria were age older than 18 years and a written informed consent form. Exclusion criteria were pregnancy, chronic medication use, and existence of comorbidities. Data that were obtained from the participants’ interview include demographic characteristics (age at the time of the interview, gender, and ethnicity [Jews and Arabs]) and sector in the hospital (nurse, physician, and others). Smoking habits were classified into 3 categories (current, past, and never). Weight and height were measured at the time of the interview, and body mass index (BMI) was calculated (weight [kg]/height2 [cm]). At the time of enrollment (from April 2013 to June 2013), all participants also provided a blood sample to assess the baseline serum 25(OH)D levels and thrombin generation parameters. Participants with baseline serum 25(OH)D levels of less than 50 nmol/L were treated with vitamin D supplements (cholecalciferol 2000 IU/d) for 90 days (from September 2013 to December 2013). At the end of treatment (December 2013), all participants provided a second blood sample to assess serum 25(OH)D levels and thrombin generation parameters.
The 25(OH)D was tested using LIAISON 25(OH)D TOTAL assay (DiaSorin, Stillwater, MN, USA), a competitive 2-step chemiluminescence assay. In accordance with the Institute of Medicine (IOM) recommendations, serum 25(OH)D levels ≥50 nmol/L were defined as sufficient levels. 17,18 The first and second (after intervention) blood samples for thrombin generation were stored at −70°C and analyzed at the end of the study by the same technician. Thrombin generation was tested on platelet-poor plasma with the CAT technique using 5 pmol/L TF and 4 pmol/L phospholipids. The thrombogram curves yielded 4 parameters: (1) lag time, (2) endogenous thrombin potential (ETP), (3) peak height, and (4) time to peak. Short lag time/time to peak and high ETP/peak height point at hypercoagulable (prothrombotic) state and vice versa prolonged lag time/time to peak and decreased ETP/peak height indicate a hypocoagulable (prohemorrhagic) state. 16
Statistical Analyses
Normal distribution was assessed by visual inspection of histograms with normal curves, visual inspection of boxplots, and using the Shapiro-Wilk test. Continuous variables are summarized with means and standard deviation, along with medians and interquartile ranges (IQRs); categorical variables are summarized with numbers and proportions. For cross-sectional comparison, serum 25(OH)D levels at study entry was classified into the following 2 categories: (1) serum 25(OH)D <50 nmol/L and (2) serum 25(OH)D ≥50 nmol/L. Thrombin generation parameters (lag time, ETP, peak height, and time to peak) were compared between the 2 vitamin D categories using the unpaired Student t-test or the Mann-Whitney U test as appropriate. Multiple linear regression analysis, using backward selection, was used to assess the association between vitamin D status and the thrombogram parameters controlling for age, gender, BMI, and smoking. For this purpose, skewed variable were logarithmically transformed. Comparison of the thrombin generation parameters before and after treatment with vitamin D supplements was performed with the paired Student t-test or the Wilcoxon signed rank test as appropriate. Pearson r correlation coefficient and Spearman rank ρ correlation coefficient were used as appropriate to test the relation between continuous variables. P value of less than .05 for the 2-tailed tests was considered statistically significant. All statistical analyses were performed using IBM SPSS Statistics 21.0.
Results
A total of 73 healthy volunteers, health workers, were enrolled in the study. The mean age at the study entry was 36.0 ± 8.9 years, and 31 (42.5%) were females. The mean serum 25(OH)D level was 38.2 ± 15.7 nmol/L, and 57 (78.1%) of participants had serum 25(OH)D levels less than 50 nmol/L. The baseline characteristics of the participants at the time of enrollment are summarized in Table 1. The highest correlation between the thrombogram parameters was observed between lag time and TTP (ρ = .87, P < .001) and between ETP and peak height (r = .71, P < .001).
Baseline Demographic, Anthropometric, and Laboratory Characteristics of the Study Participants Presented Separately for All Participants and for the Intervention Group.
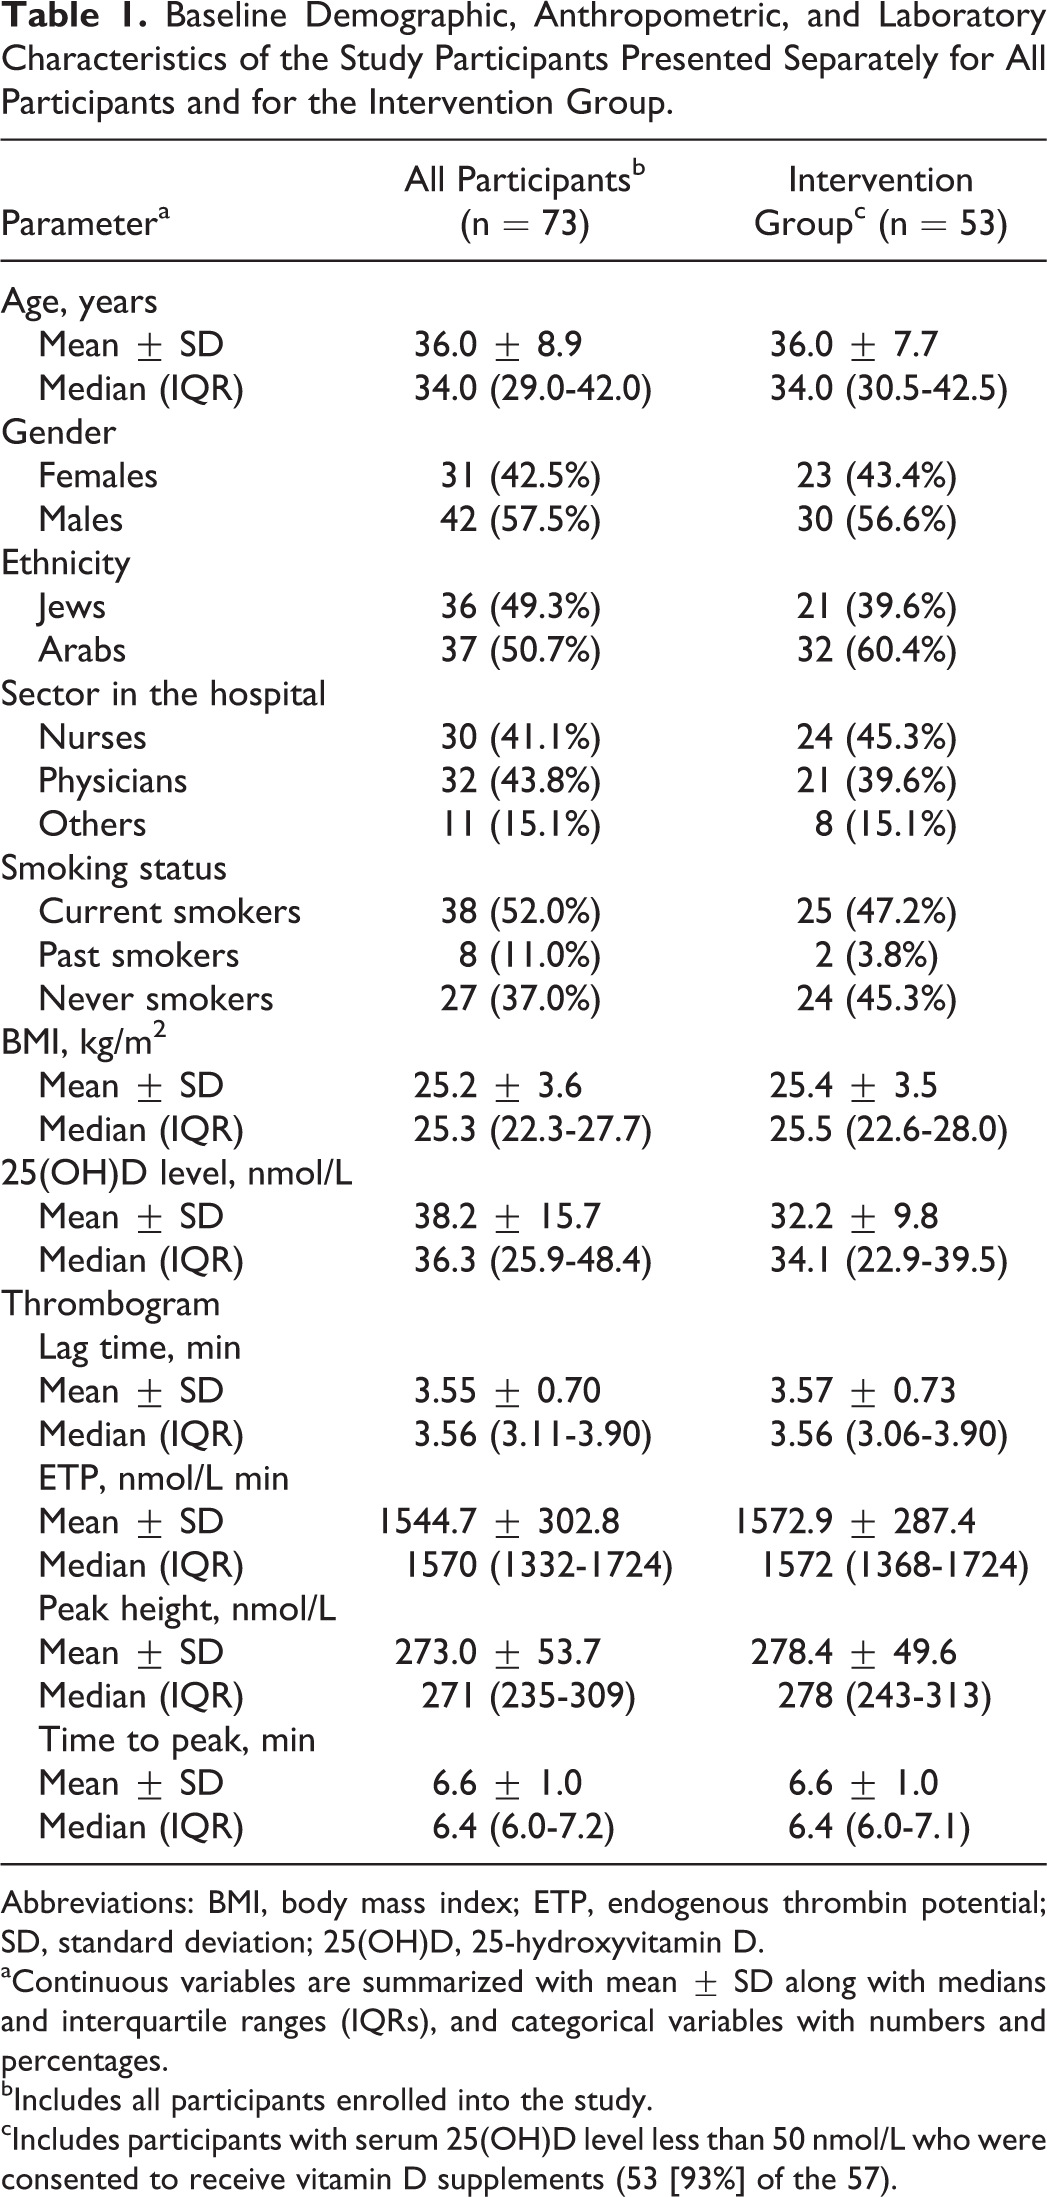
Abbreviations: BMI, body mass index; ETP, endogenous thrombin potential; SD, standard deviation; 25(OH)D, 25-hydroxyvitamin D.
aContinuous variables are summarized with mean ± SD along with medians and interquartile ranges (IQRs), and categorical variables with numbers and percentages.
bIncludes all participants enrolled into the study.
cIncludes participants with serum 25(OH)D level less than 50 nmol/L who were consented to receive vitamin D supplements (53 [93%] of the 57).
At baseline, univariate analyses showed that the mean ETP was significantly higher in patients with serum 25(OH)D levels <50 nmol/L compared to those with serum 25(OH)D ≥50 nmol/L (P = .038). The peak height was also higher in patients with serum 25(OH)D levels <50 nmol/L compared to those with serum 25(OH)D ≥50 nmol/L but did not reach statistical significance (P = .059; Table 2). However, on multiple linear regressions analyses, none of the thrombogram parameters was statistically different between patients with serum 25(OH)D levels <50 nmol/L and patients with serum 25(OH)D ≥50 nmol/L at baseline (Table 2).
Cross-Sectional Comparison of the Thrombogram Parameters at Baseline Between Participants With Serum 25(OH)D <50 nmol/L and Participants With Serum Levels ≥50 nmol/L.
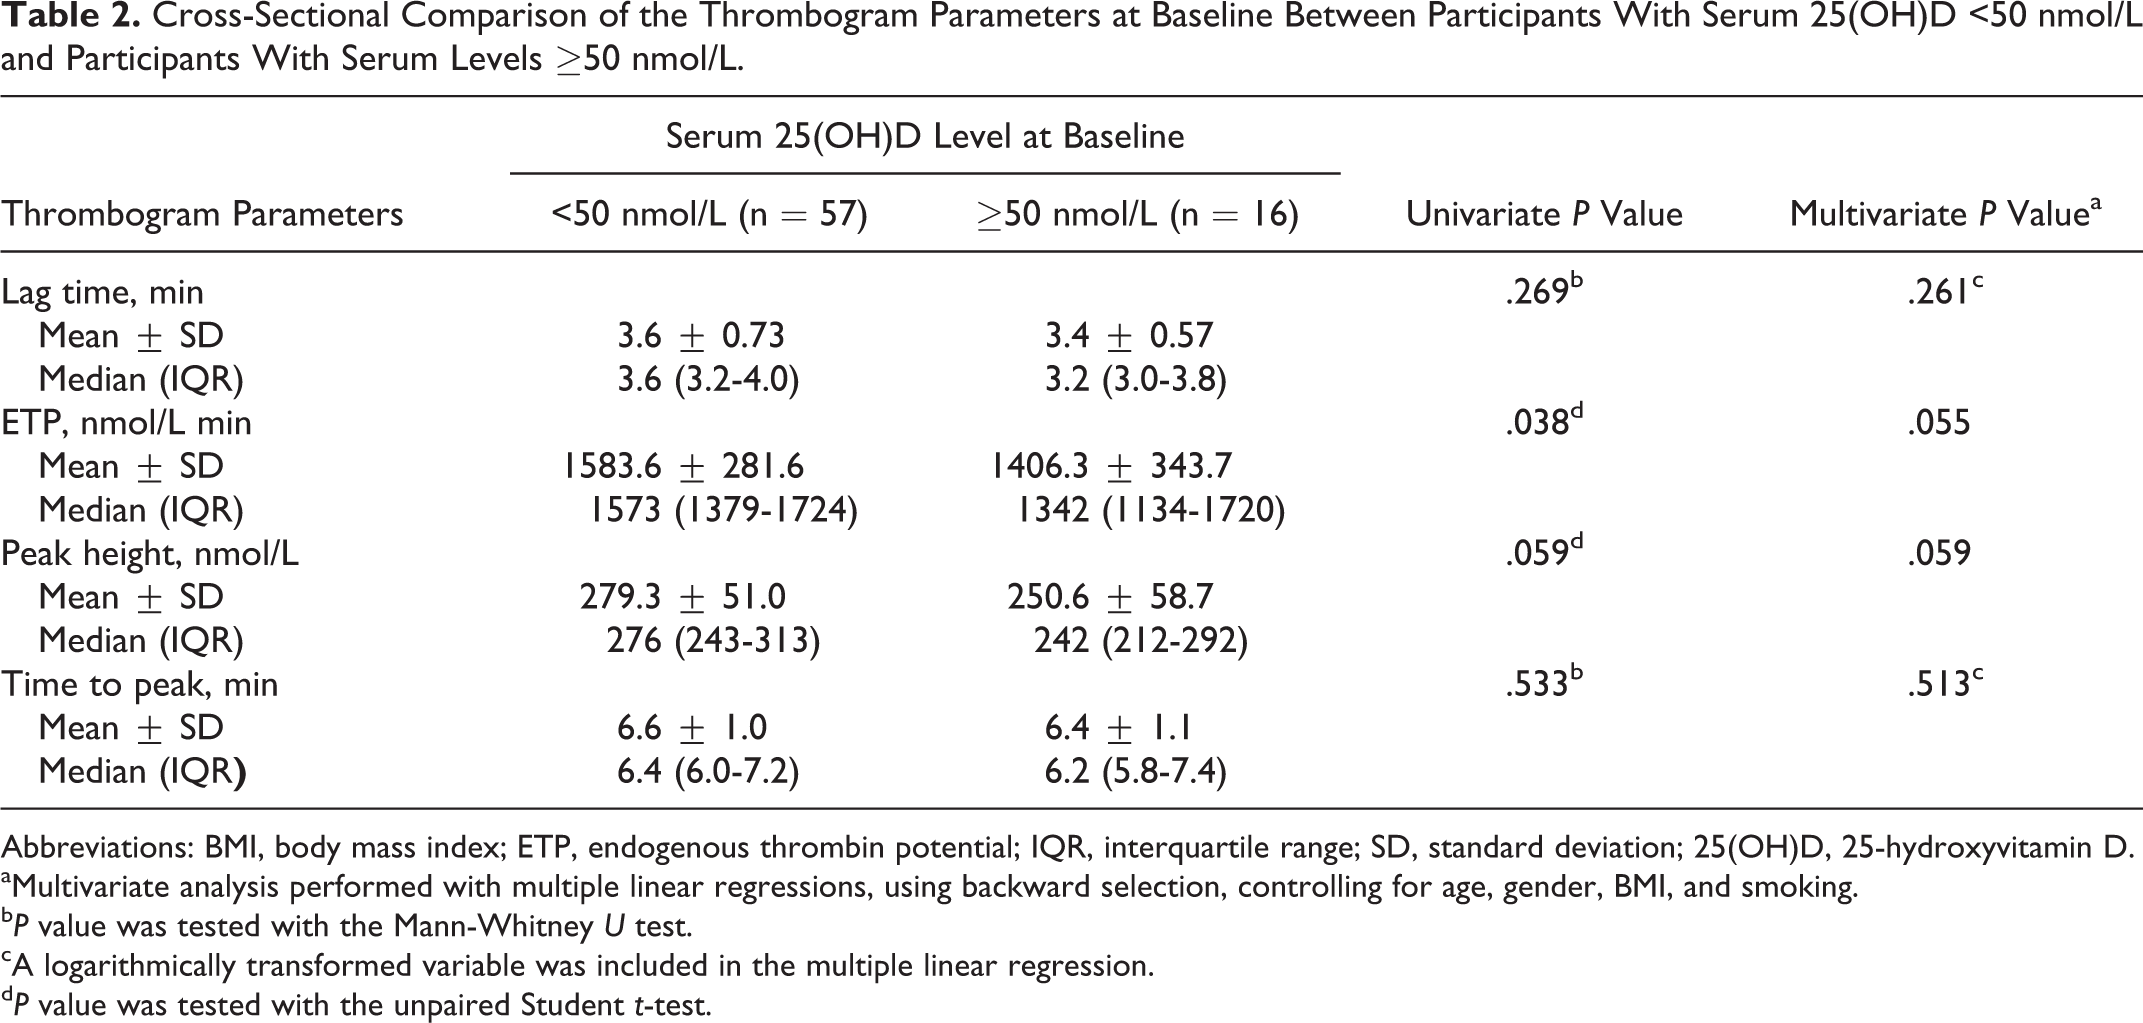
Abbreviations: BMI, body mass index; ETP, endogenous thrombin potential; IQR, interquartile range; SD, standard deviation; 25(OH)D, 25-hydroxyvitamin D.
aMultivariate analysis performed with multiple linear regressions, using backward selection, controlling for age, gender, BMI, and smoking.
b P value was tested with the Mann-Whitney U test.
cA logarithmically transformed variable was included in the multiple linear regression.
d P value was tested with the unpaired Student t-test.
Of the 57 patients with serum 25(OH)D <50 nmol/L, 4 patients declined to continue the study, and 53 (93%) patients were treated with vitamin D supplements for 90 days (intervention group). The mean age in the intervention group was 36.0 ± 7.7 years and 23 (43.4%) were females (Table 1). In 83% of these patients, the first blood sample (at the time of enrollment) was collected in April, 5.7% in May, and 11.3% in June, whereas the second blood sample (at the end of treatment) was collected in December in all patients. The mean serum 25(OH)D level was 32.2 ± 9.8 nmol/L before treatment and increased to 52.0 ± 19.7 nmol/L at the end of vitamin D treatment (P < .001; Table 3). A significant decrease in lag time and time to peak was observed after treatment with a mean difference of −0.49 ± 0.51 minutes (P < .001) and −0.76 ± 0.70 minutes (P < .001), respectively. A significant increase in ETP and peak height was observed after treatment with a mean difference of 170.1 ± 339.8 nmol/L minute (P = .001) and 34.2 ± 47.8 nmol/L (P < .001), respectively (Table 3). Similar results were reached on stratified analysis by ethnic group, the P value was <.05 for all thrombogram parameters both in Arabs (n = 32) and in Jews (n = 21) except for ETP that reached only borderline significance in Jews (P = .066). The extent of change in all the thrombogram parameters after treatment was not different between Arabs and Jews. The results were similar in patients with BMI <25 kg/m2 and in patients with BMI ≥25 kg/m2, and the extent of change in all of the thrombogram parameters after treatment was not different between the 2 BMI categories (Table 4).
Comparison of Thrombogram Parameters at Baseline and 3-Month After Treatment With Vitamin D Supplements.a
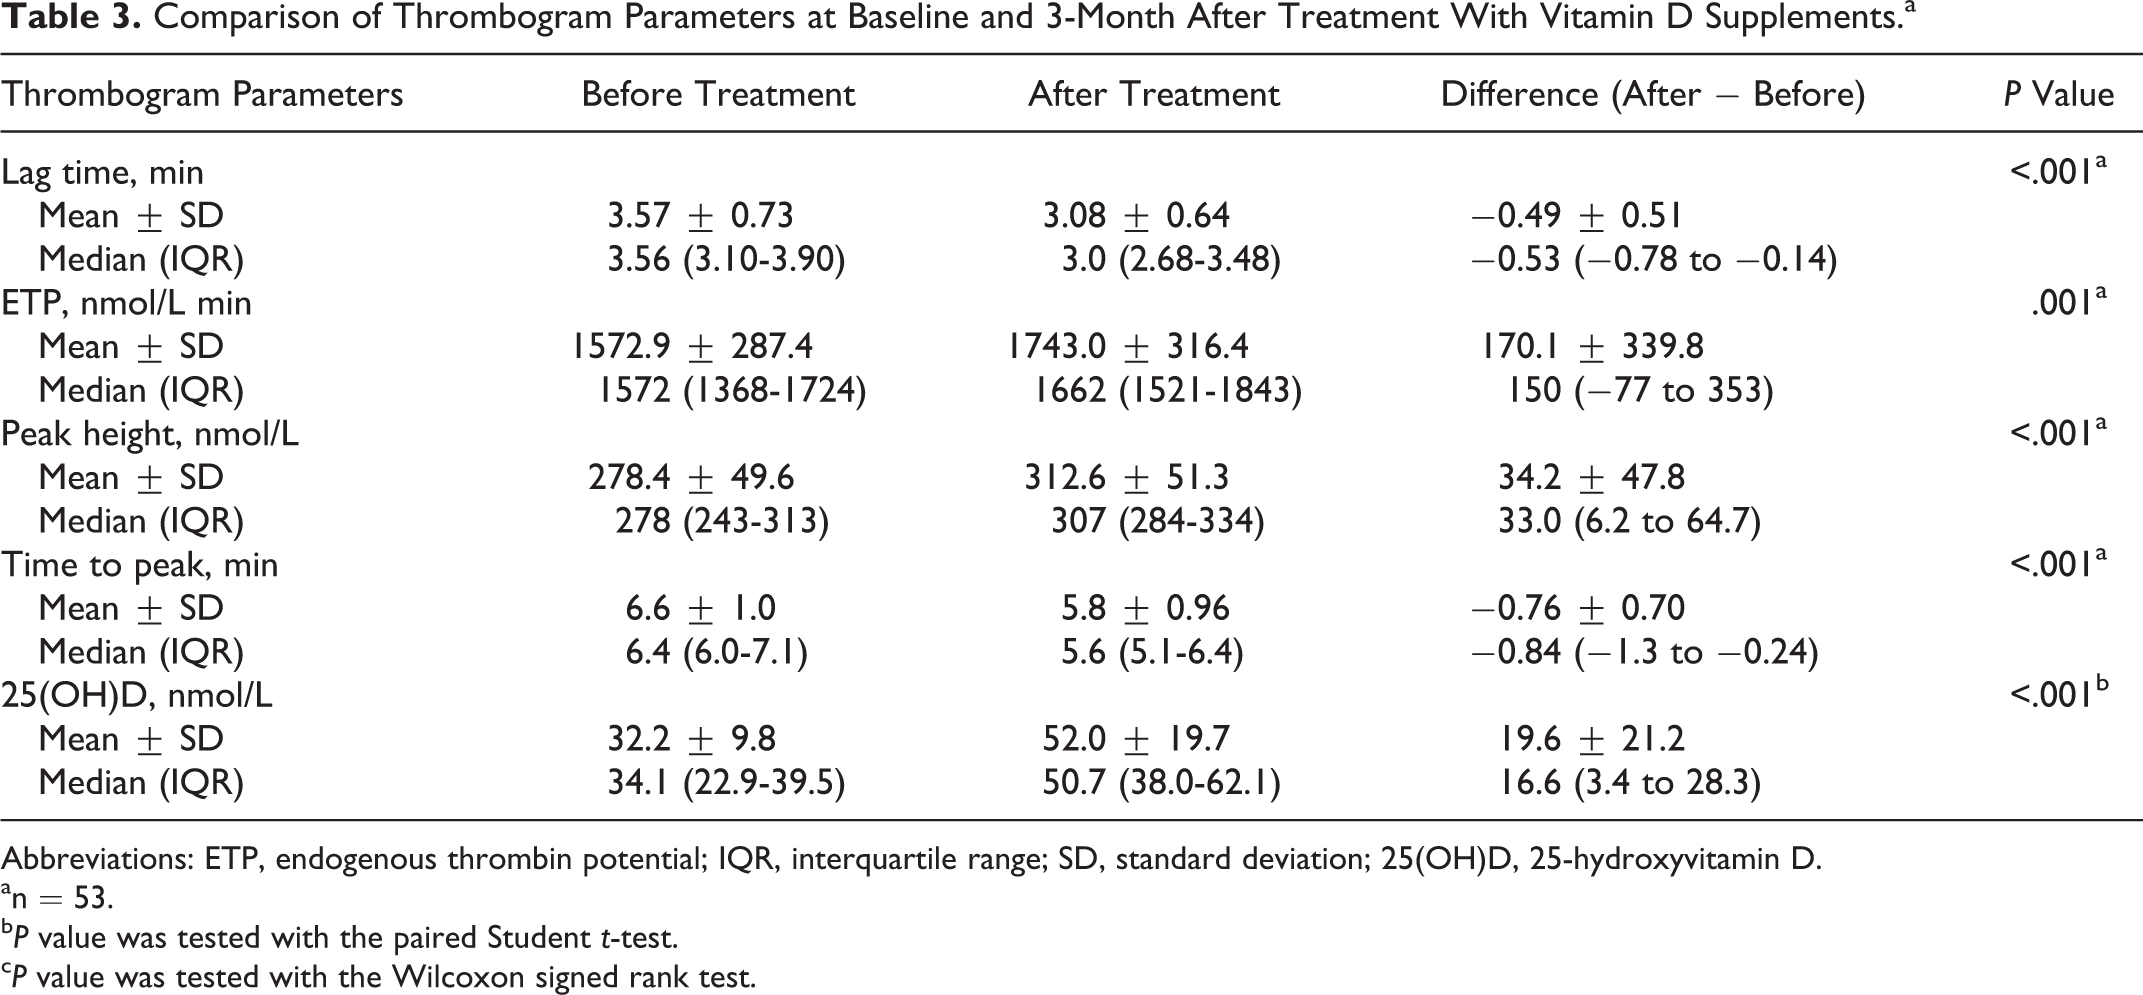
Abbreviations: ETP, endogenous thrombin potential; IQR, interquartile range; SD, standard deviation; 25(OH)D, 25-hydroxyvitamin D.
an = 53.
b P value was tested with the paired Student t-test.
c P value was tested with the Wilcoxon signed rank test.
Comparison of the Change in Thrombogram Parameters After Treatment With Vitamin D Supplements (After vs Before) Between Patients With BMI <25 kg/m2 and Patients With BMI ≥25 kg/m2.a
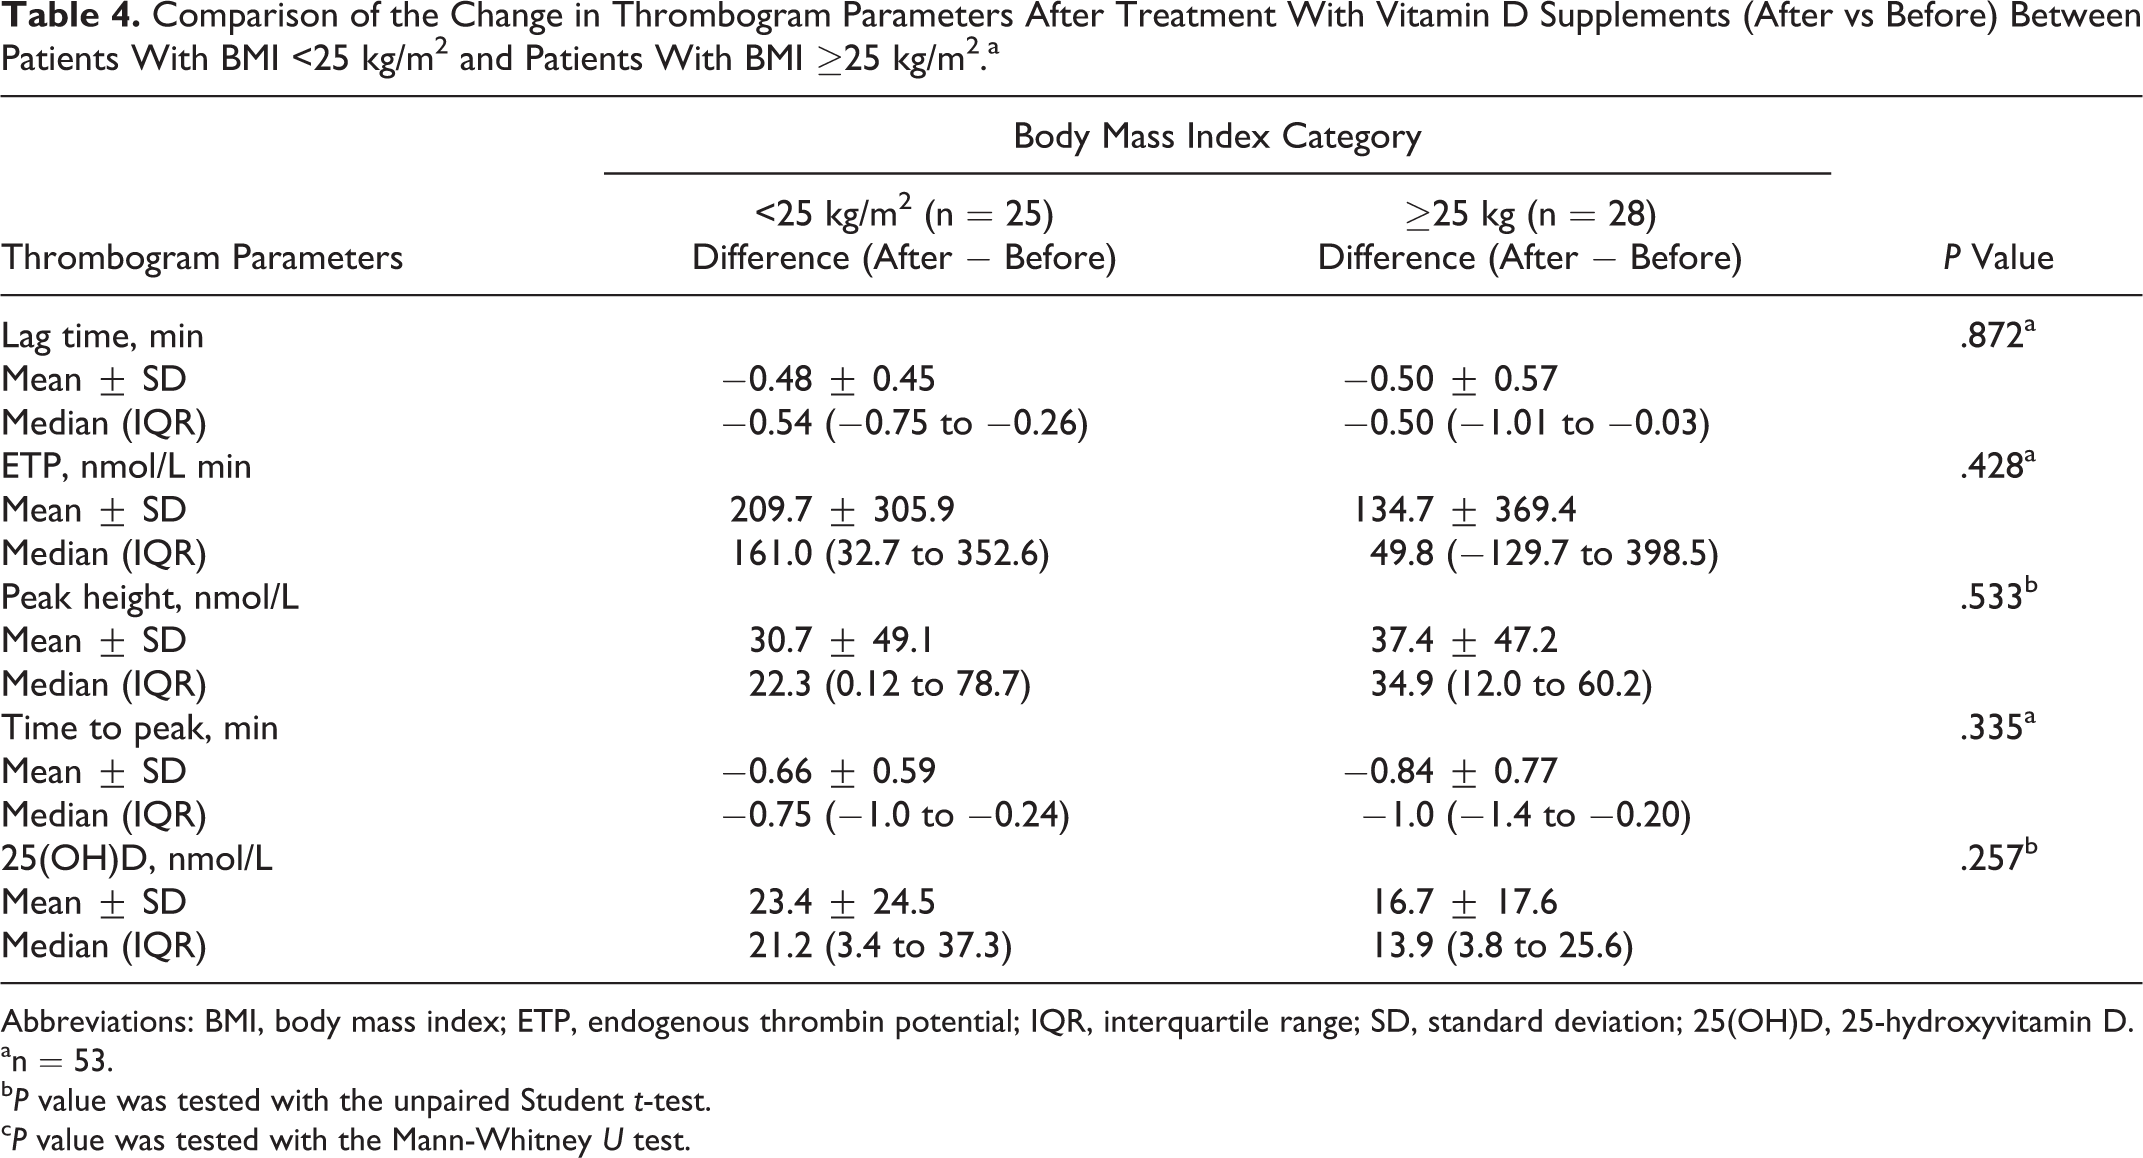
Abbreviations: BMI, body mass index; ETP, endogenous thrombin potential; IQR, interquartile range; SD, standard deviation; 25(OH)D, 25-hydroxyvitamin D.
an = 53.
b P value was tested with the unpaired Student t-test.
c P value was tested with the Mann-Whitney U test.
Discussion
Serum 25(OH)D levels <50 nmol/L were highly prevalent among the participants of our study (78.1%) compared to that in the general population of Israel(49.9%). 19 This may be partially explained by the higher prevalence of Arabs in our study (50.7%), who were found to have higher prevalence of vitamin D insufficiency. 19 Several potential causes may contribute to vitamin D insufficiency in the intervention group of the study, including (1) high prevalence of pigmented skin color, (2) dressing customs, particularly among Arabs, characterized by long clothes that cover large surface of the skin, and (3) reduced outdoor activity for cultural and religious reasons, particularly among Arabs. Furthermore, food fortification with vitamin D is not used in Israel. 19 None of these factors seem to affect thrombin generation and are unlikely to influence the results of our study.
In this study, we have shown that, on cross-sectional analysis, vitamin D sufficiency seems to have antithrombotic effect as evidenced by the lower ETP in patients with vitamin D sufficiency, although no difference was observed after adjustment for confounders. This finding is in line with previous in vitro studies that showed vitamin D to have antithrombotic effect. 12,13,20 Nevertheless, contrary to our finding, thrombin generation was found to increase with increasing serum 25(OH)D levels in cross-sectional analyses that persisted on multivariate analyses suggesting that vitamin D may have prothrombotic effect. 21
Notably, the treatment with vitamin D in patients with serum 25(OH)D <50 nmol/L resulted in increased thrombin generation, which was consistent in all the 4 thrombogram parameters (Table 3). Increased thrombin generation was found to be associated with increased risk of venous thromboembolism. 22 –25 Hence, based on our finding, it may be suggested that vitamin D treatment may have prothrombotic effect and may be associated with increased risk of thrombosis. Vitamin D is important to maintaining calcium balance, 1 and calcium ions have a critical role in that many of the component reaction in blood coagulation are either calcium dependent or require calcium for the interaction of proteins with membrane surfaces. 26 Thus, it may be reasonable to think that vitamin D may have prothrombotic effect in vitamin D insufficient patients with impaired calcium balance. However, a previous study didn’t found a significant difference in delta values of the thrombogram parameters in a subgroup of obese participants in a 1-year study comparing high-dose vitamin D versus placebo with weigh change as primary end point. 21 However, as stated by the authors, the main drawback of that study was that all participants were obese and had a high serum 25(OH)D levels at baseline (61.8 nmol/L) and increased to extreme levels (145.6 nmol/L) with high dose of cholecalciferol (40 000 IU/wk). Further, both the vitamin D and the placebo group were given daily supplements with 500 mg calcium, thus if the effect of vitamin D in the coagulation system is mediated by its effect on calcium, obviously no difference would be expected between placebo and vitamin D.
The results of our study are not in line with the results of 2 large cohort studies, the Tromsø and the Atherosclerosis Risk in Communities (ARIC) study that found no association between vitamin D status and venous thromboembolism. 6,27 However, these studies are not comparable to our study as we assessed a laboratory outcome, whereas these 2 cohorts assessed a clinical outcome. Furthermore, according to Virchow, thrombosis is caused by change in blood flow (stasis), change in the state of vessel wall (endothelial activation), and/or change in blood composition (hypercoagulability). 28 Based on the fact that thrombin generation is a global test that measures the overall tendency of plasma to form thrombin after initiation of coagulation, 16 it is clear that thrombin generation assay examines hypercoagulability which is only 1 component of the Virchow triad. Hence, a possible explanation of this discrepancy might be that vitamin D not only increases thrombin generation but also affects endothelial function, resulting ultimately in no clinical effect. Indeed, vitamin D downregulates TF expression and correlates positively with TF pathway inhibitor. 13,14
Expression changes in 1,25(OH)2D3 target genes observed from vitamin D intervention studies showed a large interindividual variation in the efficiency of vitamin D supplementation. It has been suggested that genetic polymorphism in the VDR determines the response to vitamin D supplementation. 29 Future studies that examine biomarkers of target gene expression in order to evaluate the responsiveness to vitamin D supplementation may be helpful to better assess the association between thrombin generation and vitamin D supplementation. The findings of our study should be interpreted with caution; due to the lack of control group, one may argue that temporal changes such as changes in lifestyle and dietary habits, and not necessarily vitamin D treatment, resulted in increased thrombin generation. Although, the participants of the study did not report a change in their lifestyle and dietary habits during the treatment period, dietary changes cannot be definitely excluded. Hence, our findings are insufficient to establish a cause-and-effect relationship between vitamin D treatment and thrombin generation. Furthermore, they do not provide evidence of increased risk of thrombosis as no clinical outcome was investigated in our study.
Our study has other limitations including the small number of participants included in the study and the short follow-up. Furthermore, our study includes middle-aged healthy volunteer’s health workers from single medical center, which is highly selective and may not be representative of the general population. This selection bias may influence the results of our study and affect the external validity of our findings. In addition, we could not ascertain the extent of compliance with vitamin D treatment, although the participants in our study have reported a high compliance. Further the first blood sample was collected mostly in April and the second blood sample was collected in December, which may affect the degree of increase in serum 25(OH)D levels in response to vitamin supplements. However, this is less likely, in a previous study we have shown that among untreated large sample of the Israeli population, serum 25(OH)D levels were very similar during April and December. 19 In addition, we didn’t have calcium and PTH levels, thus we cannot state whether calcium levels increased in our study patients to support calcium-mediated prothrombotic effect of vitamin D. We have no data on markers of metabolic dysregulation such as glucose and lipid levels, hence we cannot exclude that changes in these markers, during treatment with vitamin D, are implicated in the increased thrombin generation. Another limitation of our study is that only 28 (52.8%) participants in the intervention group reached sufficient vitamin D level, thus it may be argued that different results would have been reached if vitamin D sufficiency was attained in all participants; future studies are needed to clarify this issue. In addition, the daily dose of cholecalciferol (2000 IU) used in our study is higher than the recommended daily dose of 600 IU/d for ages 1 to 70 years and 800 IU/day for ages 71 years or older by the IOM. 17,18 Hence, the effect of lower doses vitamin D on thrombin generation cannot be addressed from this study. Furthermore, we did not include in the intervention group patients with sufficient vitamin D levels; therefore, we cannot draw any conclusion about the effect of vitamin D on thrombin generation in patients with sufficient vitamin D levels.
Conclusions
Treatment with vitamin D in vitamin D insufficient healthy participant seems to have prothrombotic effect. The clinical significance of this association is unclear. These findings need to be interpreted with caution considering the lack of control group, the small number of participants, and the short follow-up in our study. Larger controlled studies with more representative sample and longer follow-up are needed to better assess the relationship between vitamin D supplements and thrombin generation and the clinical occurrence of thromboembolic disease.
Footnotes
Declaration of Conflicting Interests
The author(s) declared no potential conflicts of interest with respect to the research, authorship, and/or publication of this article.
Funding
The author(s) received no financial support for the research, authorship, and/or publication of this article.