
Abstract
Background:
Assessment of venous thromboembolism (VTE) risk is important to determine optimal primary prophylaxis in hospitalized patients. The Padua score helps to recognize patients with high VTE risk, but quantifying a VTE risk is often challenging in medical patients. Thrombin generation assay (TGA) reflects the pro-/anticoagulant balance and thus could help to better quantify VTE risk in medical hospitalized patients.
Aim:
To analyze the relation between TGA and VTE risk according to Padua score in medical hospitalized patients.
Methods:
Between May and October 2013, 105 patients were included in an unselected cohort group of patients admitted to an internal medicine department in a large, university hospital. Within the 36 hours after admission and before any anticoagulant therapy, Padua score was calculated and sample for TGA was collected for each patient. Thrombin generation assay (velocity, peak, and endogenous thrombin potential [ETP]) was performed with 1 and 5 picomol/l (pM) tissue factor (TF) reagent.
Results:
In patients with high Padua score (n = 29), velocity, peak, and ETP differed from patients with low Padua score. This difference was present at 1 and 5 pM TF, in ETP (P < .0001 and P = .003 respectively), in peak (P < .0001 in both conditions), and in velocity (P < .0001). According to multivariate analysis, myeloid disorders, older age, higher body mass index, myocardial infarction, C-reactive protein >5 mg/L, reduced mobility with bed rest significantly increased velocity 1 pM TF value.
Conclusion:
Single thrombin generation measurement could help to identify patients at risk of VTE in medical hospitalized patients.
Keywords
Introduction
Venous thromboembolism (VTE) is a common disease, and its incidence is more than 100 times higher in hospitalized patients when compared to control population. 1 Seventy to eighty percent of deaths related to VTE occur in hospitalized nonsurgical patients, 2 and 10% to 20% of patients hospitalized for medical reasons present a VTE during hospitalization. 3,4 Risk factors for VTE are numerous and more difficult to characterize in medical than in surgical patients. Therefore, physicians may have difficulty to assess VTE risk. However, identification of VTE risk is essential, since more than 75% of fatal pulmonary embolism (PE) occur in medical patients, 5 and since VTE prophylaxis reduces about 50% of the VTE risk in these patients. 6,7 Different studies have shown that only 35% to 45% of high VTE risk medical patients receive an appropriated VTE prophylactic treatment. 3,8 –11 Currently, the American College of Chest Physicians (ACCP) 7 recommends thromboprophylaxis for medical patients at high risk of VTE according to the Padua score. 12 Venous thromboembolism is in part mediated by increased blood thrombogenicity, and therefore, a global coagulation test like the thrombin generation assay (TGA) could be useful to assess the VTE risk level and to better identify patients requiring thromboprophylaxis. The TGA is a global coagulation ex vivo test that quantifies thrombin generation and its kinetics in a plasma sample. Several studies have demonstrated a strong relation between prothrombotic state and elevated TGA, 13 –17 and TGA could especially identify patients with high risk of first thrombosis. 18 However, very few studies focused on TGA and VTE risk factors. Tripodi et al have shown that clinical assessment of VTE risk (low, moderate or high based on thrombosis history or thrombophilia) was correlated with TGA values with thrombomodulin. 19
This study aimed to examine the relation between Padua prediction score and TGA with 1 and 5 pM tissue factor (TF) reagent and to determine the best TGA parameter to assess VTE risk according to Padua score in an unselected cohort group of patients admitted to an internal medicine department in a large, university hospital. No relevant limitations with regard to illnesses were made. We hypothesized that TGA could complete the use of the Padua score in order to better identify VTE risk.
Materials and Methods
Patients
Patients included in this study were hospitalized for nonsurgical reasons, in the internal medicine department of the University Hospital of Nantes, France, between May and October 2013. Pregnant women, patients receiving anticoagulant therapy, patients hospitalized for acute VTE, patients with activated partial thromboplastin time (APTT) ratio >1.2, patients with prothrombin time rate <70%, and minor patients were excluded. Study protocol was approved by the local medical ethics committee, and patient’s written informed consent was required for inclusion. Each patient was examined in the first 36 hours of the hospitalization, and 46 items of VTE risk factors were collected: sex, age, body mass index, and permanent risk factors for VTE (taking estrogen–progestin contraceptive, menopause hormonal treatment, or antiplatelet drug); personal history of DVT or PE; family history of VTE; biological thrombophilia (defects of antithrombin, protein C or S, factor V Leiden, and G20210A prothrombin mutation), venous insufficiency; postphlebitis syndrome; recurrent hospitalization (at least 3 hospitalizations in 3 months); bedridden patient; postpartum; lymphoid disorders; myeloproliferative syndrome; myeloid disorders; lupus; granulomatosis with polyangiitis; cryoglobulinemia; antiphospholipid syndrome; and chronic inflammatory bowel diseases. Acute VTE risk factors were collected: acute infectious disease, acute rheumatologic disease, acute limb ischemia, active cancer (treated with chemotherapy and / or radiotherapy for less than 6 months), surgery less than 1 month, trauma less than 1 month, nephrotic syndrome, acute dehydration, acute heart failure, acute respiratory failure, acute myocardial infarction, stroke, and reduced mobility (bed rest at least 3 days). Ambulation of the patients was evaluated in 4 categories: walk unaided, walk with assistance outside his room (chair or bed 50% of the day), walk with assistance only inside his room (chair or bed + 50% of the day), and does not walk (chair, bed permanently). Moreover, at the start of hospitalization (in the 36 first hours) C-reactive protein (CRP), fibrinogen, APTT, PT-INR, and platelets were measured. Patients were classified in 2 groups according to VTE risk defined by Padua score 12 : low VTE risk (Padua score <4) or high VTE risk (Padua score ≥4; Table S1).
Blood Collection and Plasma Preparation
Within the 48 hours after admission, before any anticoagulant therapy, venous blood sample was collected using a butterfly needle, into Sarstedt Monovette tubes, in a 0.1 volume of 0.106 mol/L trisodium citrate and corn trypsin inhibitor (CTI; Innovative Research, Peary Court, USA) 1.45 µmol/L (final concentration). Platelet-poor plasma (PPP) was prepared by 2 centrifugation at 2.500 g for 15 minutes at 18°C. Plasma aliquots were stored at –70°C until use. All samples were thawed at 37°C for 15 minutes before analysis.
Thrombin Generation Measurements
Thrombin generation in TF-triggered PPP was measured by means of the Calibrated Automated Thrombogram method (Thrombinoscope BV, Maastricht, The Netherlands). In order to correct for inner filter effects and substrate consumption, each thrombin generation measurement was calibrated against the fluorescence curve obtained in the same plasma with a fixed amount of thrombin-α2-macroglobulin complex (Thrombin Calibrator, Stago, Maastricht, The Netherlands). Fluorescence was read in an Ascent Reader (Thermolabsystems, Thermo Fisher Scientific, Waltham, MA USA), and thrombin generation curves were calculated with the Thrombinoscope software (Thrombinoscope BV). Each plasma sample was analyzed within 2 to 30 days after blood collection. All samples were tested in triplicate and thrombin generation was determined under 2 experimental conditions (final plasma concentrations): PPP Reagent low (Stago; 1 pM TF and 4 μmol/L phospholipids [PL]) and PPP Reagent (Stago; 5 pM TF and 4 μmol/L PL). Four parameters were derived from the thrombin generation curves: lag time, time to peak, peak height, and endogenous thrombin potential (ETP; area under the curve). Velocity was calculated as follows: Peak/[(time to peak) − (lag time)].
Statistical Analysis
The relations between TGA and VTE risk factor using Padua score were performed using boxplots to explain each parameter of TGA (velocity, peak height, and ETP) as a function of Padua score. Analyses of variance (ANOVAs) were run in order to compare the groups of patients on indices of TGA. The relations between patient characteristics and VTE risk factor using Padua score were defined using ANOVAs to explain each patient characteristics in 2 groups of patients (Padua score < 4 vs ≥ 4). Receiver–operator curves (ROC) were constructed explaining groups of patients with low/high risk (Padua score < 4 vs ≥ 4) as the function of each parameter of TGA. Areas under the ROC can be interpreted as an indicator of the discrimination between the 2 groups of patients: the best indicator is the one having the greater area under the ROC. Velocity 1 pM TF was explained using univariate and multivariate linear models including clinical biological acute or permanent VTE risk factors or motor skills. In multivariate models, variables were selected using forward selection. All the tests were performed with a significant level defined at 5%. Statistical analyses were performed using Stata 13 software (StataCorp, College Station, Texas).
Results
One hundred and five patients were included, and mean age was 61 and sex ratio (male/female) was 0.78. Main patients’ characteristics according to high or low risk of VTE with Padua score are summarized in Table 1. None had acute VTE and neither suspicion of acute VTE. Velocity, peak height, and ETP were statistically different between patients with high Padua score (≥ 4) and patients with low Padua score (<4). This statistically significant differences were observed at 1 and 5 pM TF, for ETP (P < .0001 and P = .003 respectively), for peak height (P < .0001 for 1 and 5 pM) and for velocity (P < .0001 for 1 and 5 pM; Figures 1 and 2).
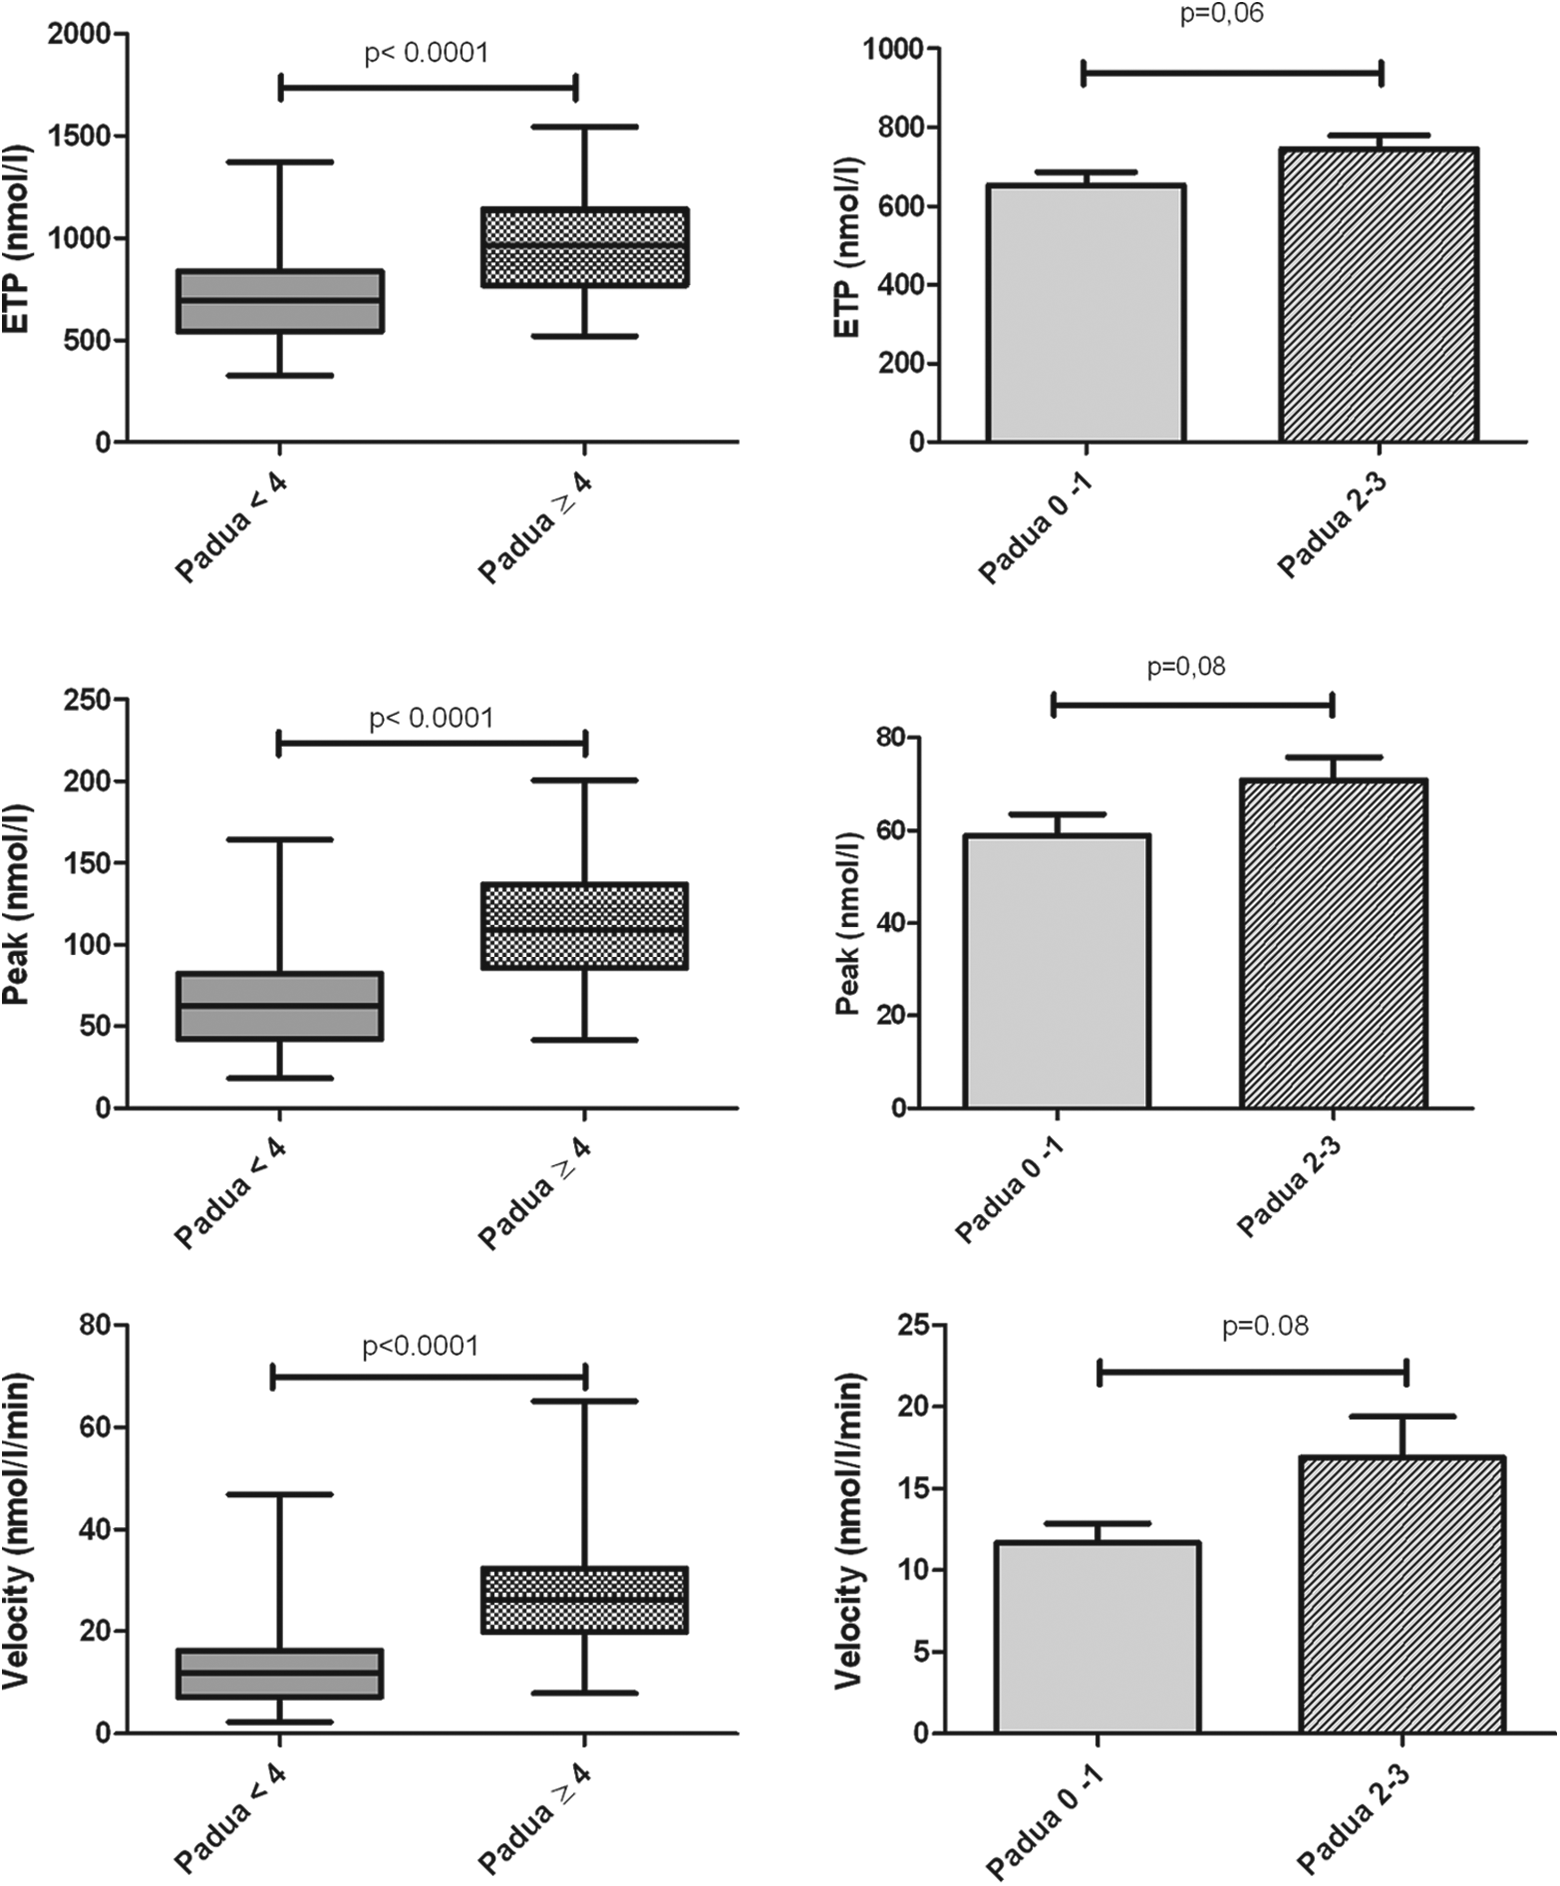
Endogenous thrombin potential (ETP), peak, and velocity with 1 pM (tissue factor) TF in controls and in patients according to Padua score.
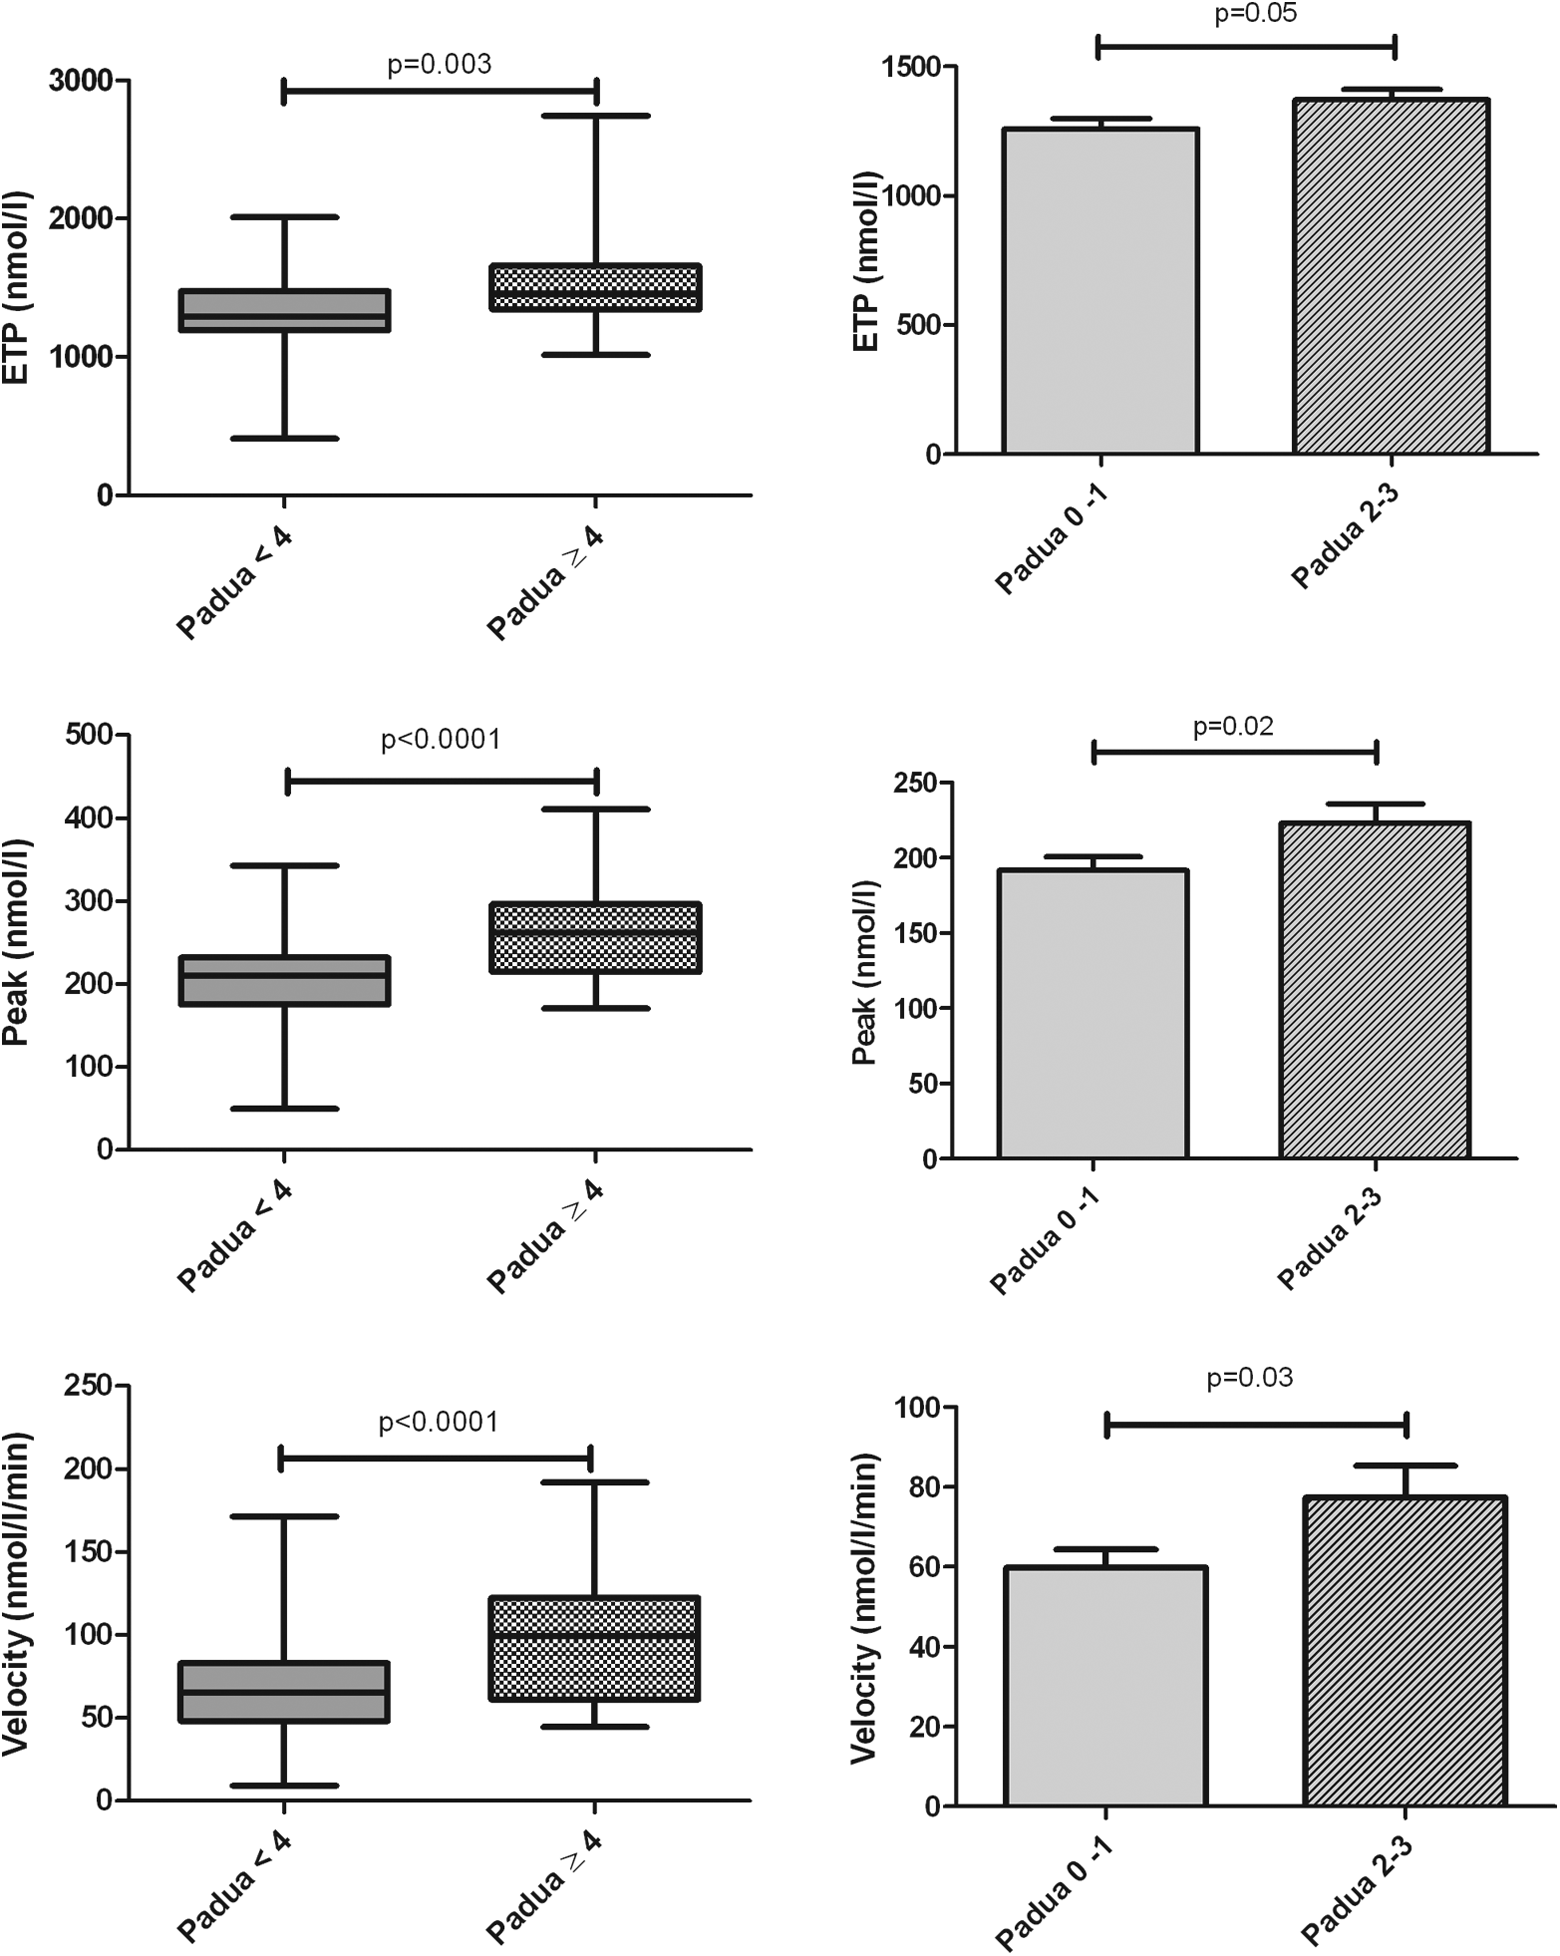
Endogenous thrombin potential (ETP), peak, and velocity with 5 pM tissue factor (TF) in controls and in patients according to Padua score.
Patients’s Characteristics and Hospitalization Patterns.
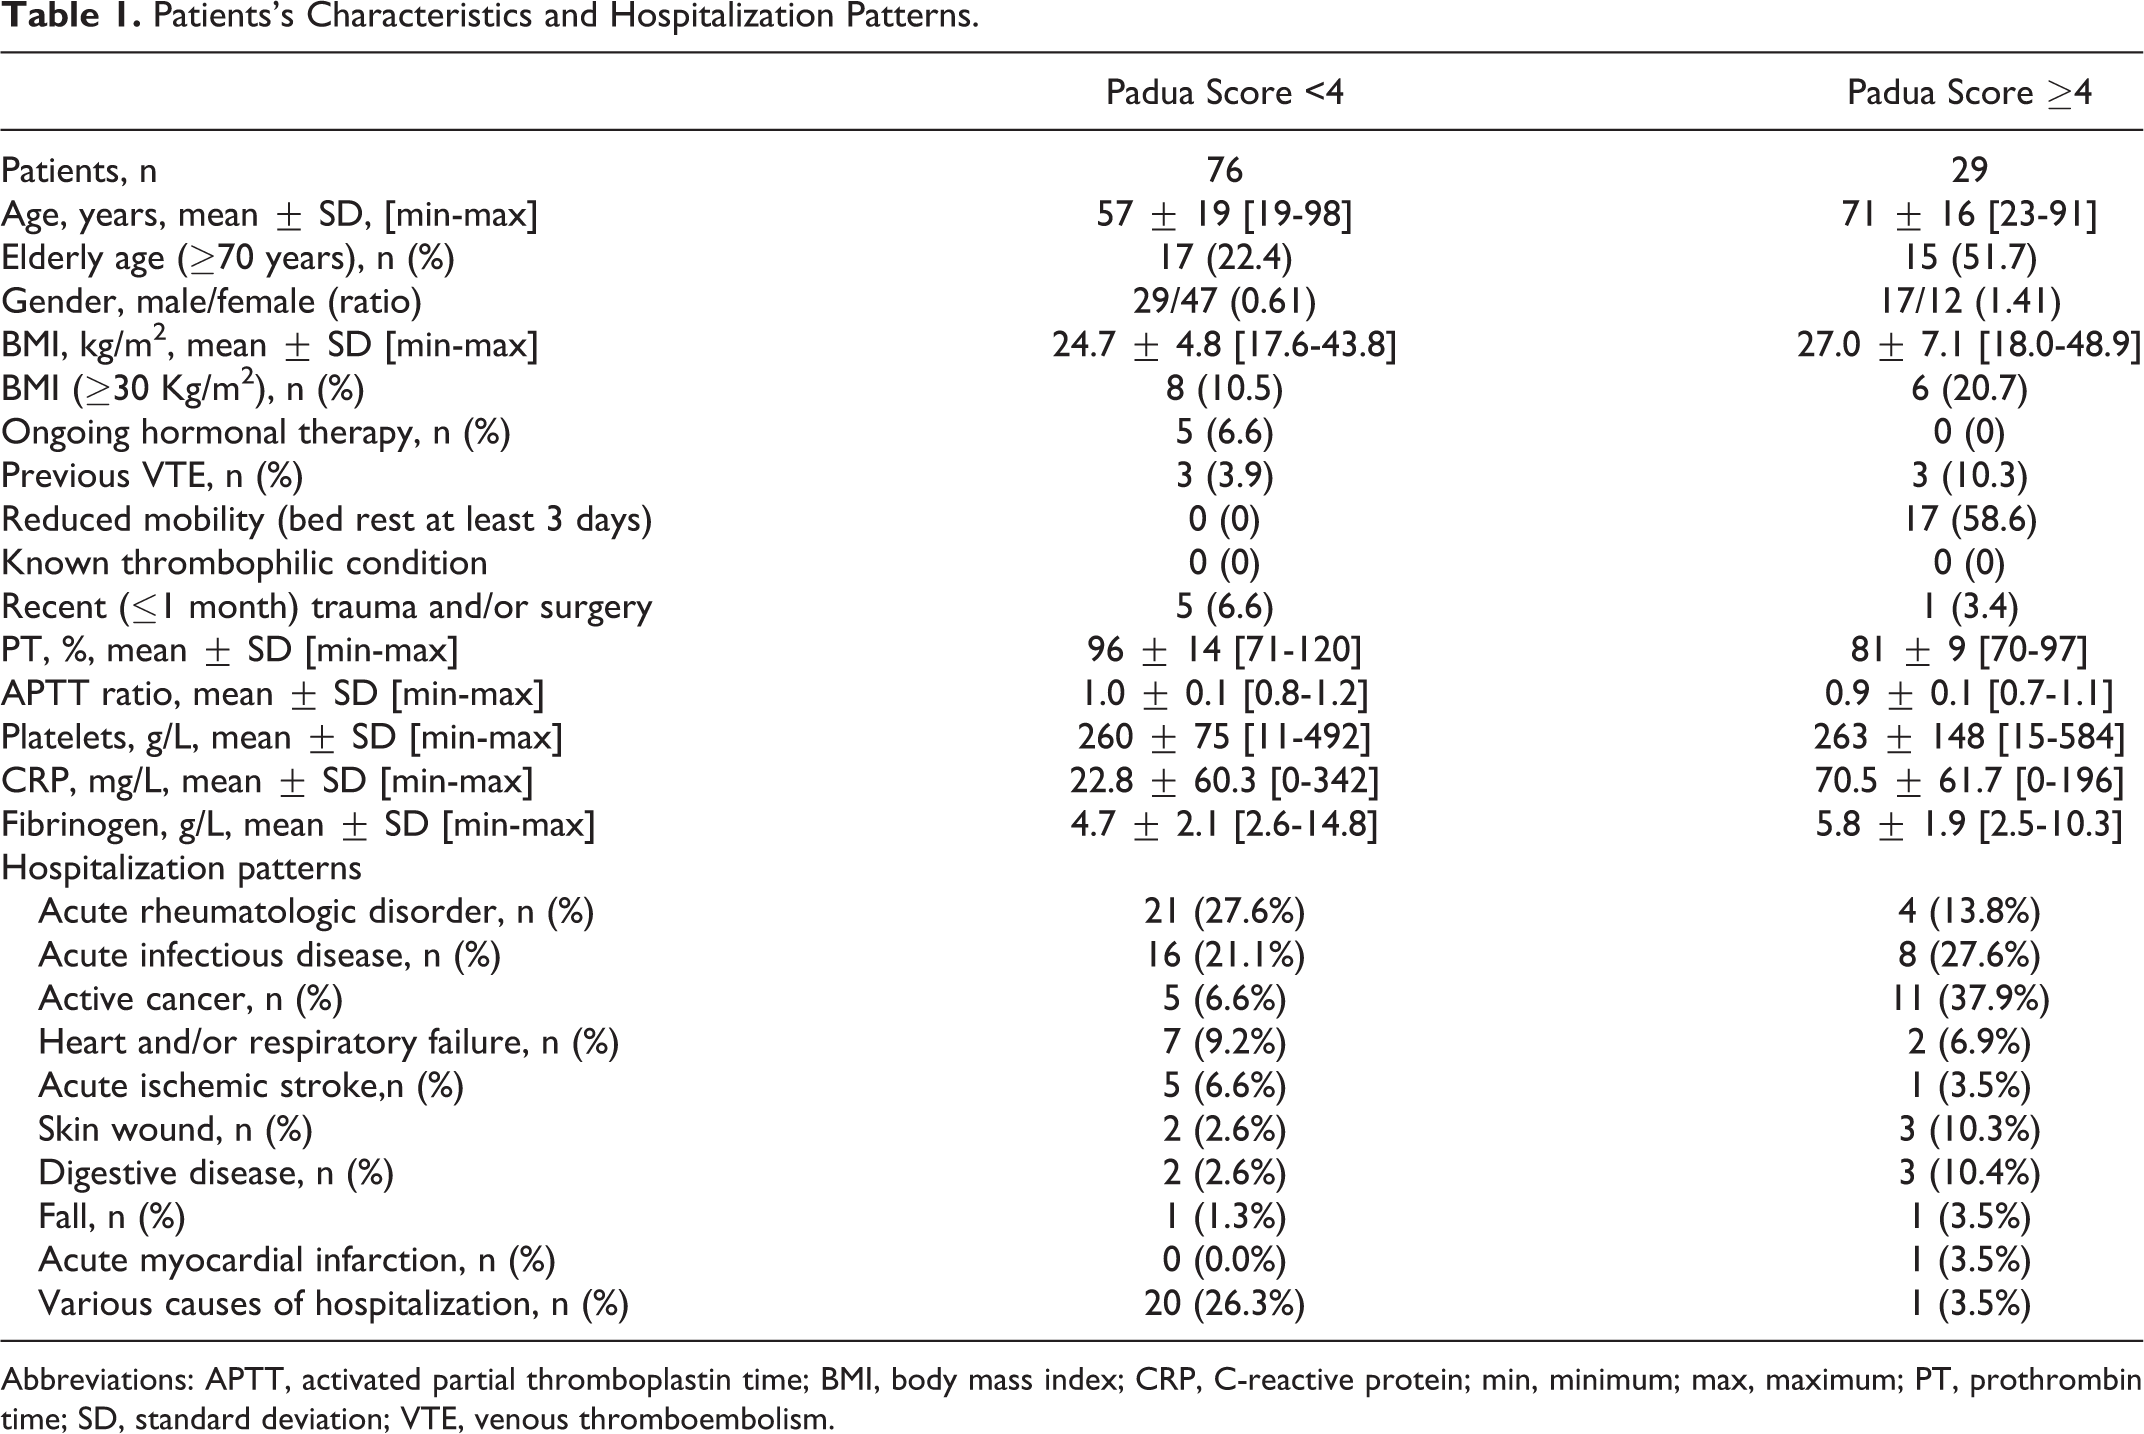
Abbreviations: APTT, activated partial thromboplastin time; BMI, body mass index; CRP, C-reactive protein; min, minimum; max, maximum; PT, prothrombin time; SD, standard deviation; VTE, venous thromboembolism.
Among the low VTE risk group (Padua score < 4), ETP, peak height, and velocity of patients with 0 to 1 Padua score (n = 36) were statistically different from those patients with scores of 2 to 3 (n = 40) at 5 pM TF (P = .05, P = .02, and P = .03, respectively). At 1 pM TF, these 3 measures were not significantly different (Figures 1 and 2).
The ROC curves were performed to determine the best criterion to distinguish high and low VTE risk patients defined by the Padua score. Areas under curve were of 0.85, 0.84, and 0.81, respectively, for velocity, peak height, and ETP at 1 pM TF and of 0.75, 0.75, and 0.66, respectively, at 5 pM TF. A threshold of 19 for velocity 1 pM appeared relevant to discriminate patients with low/high VTE risk, with both sensitivity and specificity at 83%.
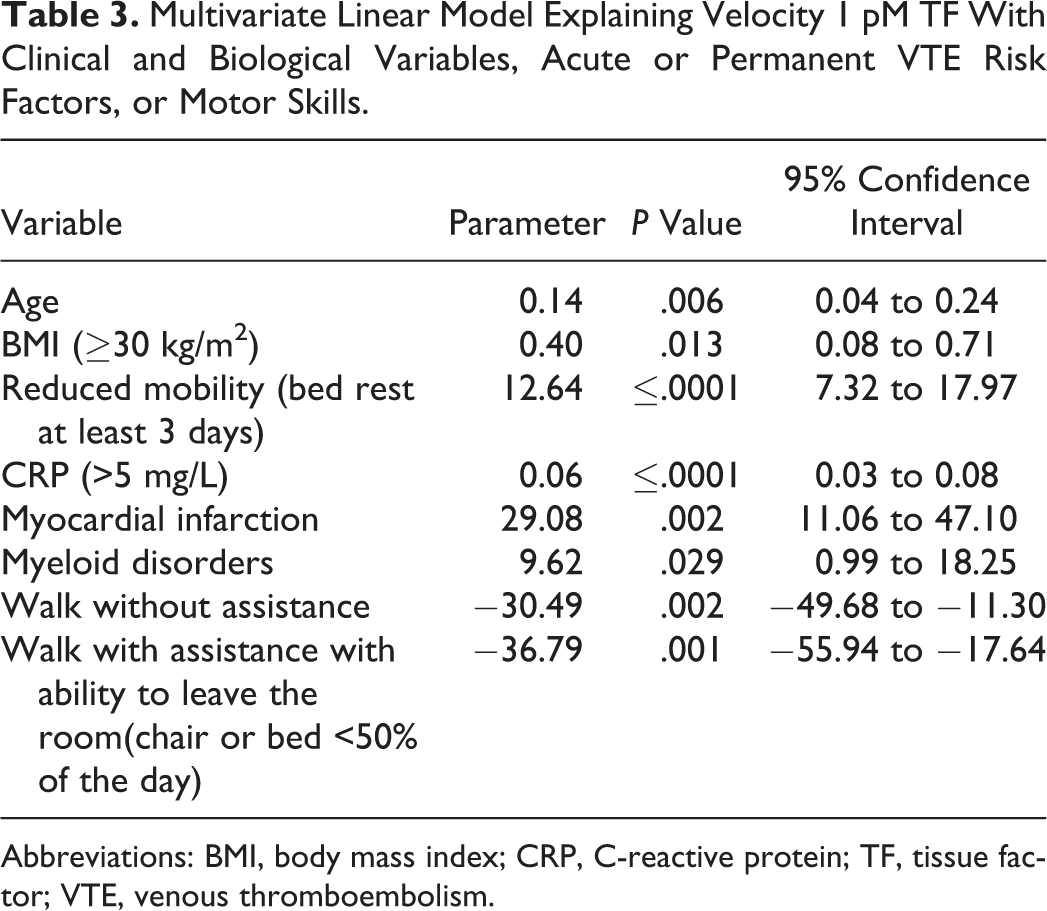
In univariate linear analysis, velocity 1 pM TF value increased with age, BMI, presence of antiplatelet drug, acute infection, myocardial infarction, bed rest, elevated fibrinogen, elevated CRP, and presence of VTE acute factors (Table 2). In contrast, patients with only permanent VTE risk factors had lower velocity 1 pM values (Table 2). In multivariate linear analysis, selected variables explained 57% of velocity 1 pM TF variance. Velocity 1 pM TF values increased with myeloid disorders, older age, higher BMI, reduced mobility associated with bed rest, myocardial infarction, and CRP >5 mg/L. Conversely, the ability to walk outside the hospital room (alone or with assistance) was significantly correlated with reduced velocity 1 pM values (Table 3).
Univariate Linear Model Explaining Velocity 1 pM TF With Clinical and Biological Variables, Acute or Permanent VTE Risk Factors, or Motor Skills (Only Significant Effects).
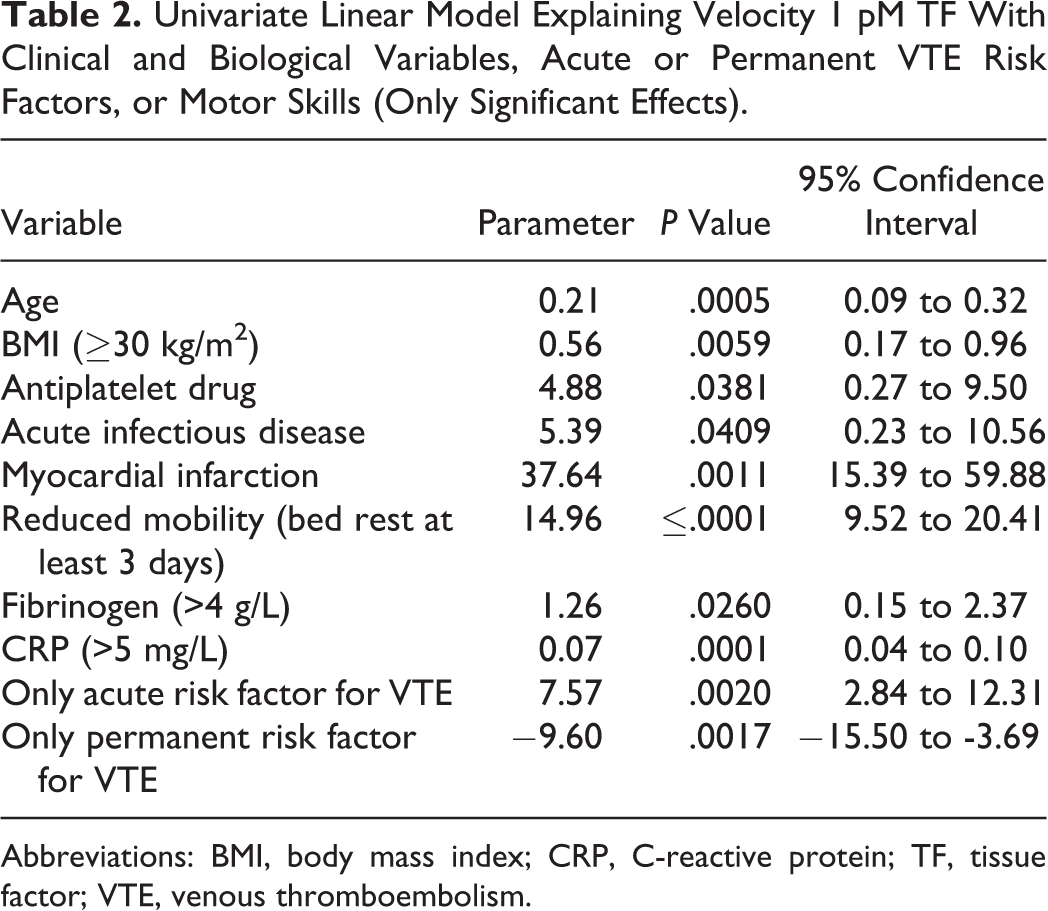
Abbreviations: BMI, body mass index; CRP, C-reactive protein; TF, tissue factor; VTE, venous thromboembolism.
Multivariate Linear Model Explaining Velocity 1 pM TF With Clinical and Biological Variables, Acute or Permanent VTE Risk Factors, or Motor Skills.
Abbreviations: BMI, body mass index; CRP, C-reactive protein; TF, tissue factor; VTE, venous thromboembolism.
Discussion
Venous thromboembolism is a multifactorial disorder, and risk factors are so numerous that assessing the individual risk of VTE is complex. The objective of this study was to evaluate the relation between VTE risk level and TGA in a population of hospitalized medical patients. According to our findings, TGA could be a tool for assessing high or low VTE risk ranked by Padua score in hospitalized medical patients. In patients with high VTE risk, 1 and 5 pM TF velocity, ETP, and peak height were higher than in patients with low VTE risk. This is the first study which shows a close relation between TGA and VTE risk in medical hospitalized patients. Recently, Saliba et al found no differences on TGA parameters between patients with high and low VTE risk according to Padua score. 20 This inconsistency with our findings may be explained by differences in technical approach. In our study, samples were performed with CTI which inhibits activation of contact phase during sampling. It has been shown that the results of thrombin generation assay were highly related to the TF concentration used to trigger the assay, with a high intra- and interassay variability up to 25% at 1 pM of tissue factor. 21,22 The CTI reduces this variability to less than 5%. 23 Moreover, our patients and those studied by Saliba et al were quiet different which may explain different results. Hence, our population comprised more women (57% vs 25% in Saliba’s study), more infectious and/or rheumatic diseases (46.6% vs 25.3%), more active cancers (15.2% vs 6.2%), and less obese patients (13.3% vs 33.6%). In addition, diseases increasing blood coagulation factor concentrations such as inflammatory syndrome were common in our study, whereas stasis and endothelial dysfunction were more frequent in the study reported by Saliba et al. In another study assessing the relation between ETP and VTE risk, 19 it was shown that ETP, in presence of thrombomodulin (TM), was increased in patients with high VTE risk defined by VTE history and congenital or circumstantial VTE risk factors. In that study, there were no differences in ETP (without TM) according to the VTE risk level, but TGA was performed without CTI in nonhospitalized patients and with a different VTE risk classification.
In our study, 1 pM TF was the most interesting concentration to distinguish high (Padua score≥4) or low (Padua score<4) VTE risk patients. Higher TF concentrations may decrease test sensitivity by saturating inhibiting systems, leading to excessive coagulation activation, thereby reducing differences between risk groups. According to our analyses, velocity 1 pM TF is the best TGA parameter in terms of ROC curve (area under the curve 0.85) to differentiate high or low VTE risk patients as defined by the Padua score, and the 19 nmol/L/min threshold allows at best to classify patients with high or low VTE risk.
Moreover, it has been established that well-known VTE risk factors such as older age, obesity, myocardial infarction, bed rest, and biological inflammatory syndrome influence TGA at velocity 1 pM TF. In this study, immobility was the main factor influencing velocity 1 pM TF. It may reflect the severity of the disease that led to hospital, but it could also be a resultant of all patients’ comorbidities. Among the low VTE risk population (Padua score <4), peak and velocity 5 pM were significantly different in patients with 0 or 1 Padua score and in patients with 2 or 3 Padua score, and VTE risk between these 2 groups is unknown. Such differences were not seen at 1 pM TF because low TF concentration is unable to induce sufficient activation of the cascade coagulation, given the small quantity of clotting factor in this group of patients. Although TGA appears as an interesting tool for the identification of patients with very low VTE risk, our data need to be confirmed by specific studies. The present pilot study of TGA in medical patients has some limitations. First, we excluded patients with APTT ratio >1.2 or with prothrombin time rate <70%. This choice was made in order to study a homogeneous group of patients. Second, we selected a specific population of medical patients hospitalized in an internal medicine department, where acute rheumatologic disorders and acute infectious diseases were frequent (23.8% and 22.9%, respectively). Third, in our unselected cohort group of patients, the small number (n = 29) of patients with high risk of VTE (Padua score ≥4) might have resulted in an underestimation of TGA values. Finally, this study analyzed the association between TGA and Padua score, which defines a VTE risk in medical hospitalized patients. However, we did not analyze the relation between TGA and the real occurrence of VTE, as the patients were not prospectively followed after TGA testing. In our opinion, TGA may be useful for patients whose VTE risk is difficult to assess. It would be of interest to compare TGA and Padua score to determine which risk assessment strategy allows the optimal thromboprophylaxis. Other studies are required to confirm our results and to analyze the association between TGA and VTE incidence.
Conclusion
This is the first study which demonstrates that medical hospitalized patients with high VTE risk according to Padua score also have TGA disturbances characterized by higher velocity, ETP, and peak at 1 and 5 pM TF than patients with low VTE risk. The TGA at 5 pM TF seems to be able to identify patients with intermediate VTE risk in which thromboprophylaxis has to be evaluated. The TGA could be useful for assessing VTE risk in medical hospitalized patients, but its utility in clinical practise remains to be prospectively established.
Footnotes
Declaration of Conflicting Interests
The author(s) declared no potential conflicts of interest with respect to the research, authorship, and/or publication of this article.
Funding
The author(s) received no financial support for the research, authorship, and/or publication of this article.