
Abstract
We aimed to assess the impact of meteorological variables on coronary blood flow (CBF). Coronary blood flow was evaluated using the thrombolysis in myocardial infarction frame count (TFC). The association of CBF with meteorological parameters such as temperature, relative humidity, total solar radiation, atmospheric pressure, wind velocity, and total sunshine duration were investigated as well as demographic, clinical, and laboratory characteristics. Assessment of 1206 patients (median age = 53 years, 723 females) revealed the presence of slow coronary flow (SCF) in 196 patients. Daily maximum temperature [odds ratio = 0.951, 95% confidence interval = 0.916-0.986, P = .007] was the only independent predictor of the presence of SCF, whereas systolic blood pressure (β = −0.139, P = .026), hematocrit level (β = 0.128, P = .044), and daily maximum temperature (β = −1.479, P = .049) were independent predictors of log10 (mean TFC). Findings of the present study suggest a role of meteorological parameters in CBF regulation.
Keywords
Introduction
Since the first appraisal of conventional atherosclerotic risk factors, many studies have been conducted to assess the predictive role of several clinical and laboratory parameters including meteorological parameters in cardiovascular mortality and morbidity. Cold weather in winter months was reported to be related to increased risk of acute coronary syndromes including myocardial infarction, 1 increased blood pressure, 2 increased risk of atrial fibrillation paroxysm, 3 and acute heart failure exacerbations, 4 besides increased risk of cerebrovascular events, 5 eclampsia, 6 and accordingly, increased risk of mortality 1 with divergent mechanisms. On the other hand, hot weather in summer months was also reported to be associated with increased risk of myocardial infarction, 7 cerebrovascular events, 8 and increased blood pressure, 9 and, consequently, increased risk of mortality. 10 Besides temperature, humidity, 11 atmospheric pressure, 1 and wind velocity 12 were also reported as other meteorological variables that might influence cardiovascular health.
As a unique clinical scenario, the angiographic slow coronary flow (SCF) phenomenon has been the subject of several preclinical and clinical studies. Previous publications have underlined significant associations between SCF development and atherosclerotic involvement of epicardial coronary arteries and 13 microvasculature 14 and of carotid arteries, 15 endothelial dysfunction, inflammation, and oxidative stress, 16 –20 although the precise pathophysiologic mechanisms remain to be established. Coronary blood flow (CBF) and the presence/absence of SCF can be accurately and easily evaluated using a simple, reproducible, and objective diagnostic method, thrombolysis in myocardial infarction frame count (TFC). 21
Owing to the lack of previously published trials assessing the potential relationship between meteorological characteristics and CBF, we hypothesized that either cold weather or hot weather, as well as several other meteorological variables such as humidity, atmospheric pressure, wind velocity, and so on, would influence CBF. Accordingly, in the present study, we aimed to evaluate the association of daily meteorological variables and CBF in patients with SCF in comparison to cases with normal CBF.
Methods
Study Population
The study population included 1206 consecutive patients with angiographically normal (0% stenosis) coronary arteries determined by elective coronary angiography performed with the suspicion of coronary artery disease, during a 7-year period (December 2003-December 2010). The indications for coronary angiography were the presence of typical angina pectoris and suggestive findings of myocardial ischemia on noninvasive tests (exercise stress electrocardiography or nuclear cardiac imaging). This observational retrospective cohort study was conducted in agreement with the ethical principles on human investigations reported in Second Declaration of Helsinki, and our institutional ethics review board reviewed and approved the study protocol.
The following exclusion criteria were proposed for the present study: presence of coronary artery disease on coronary angiography, admission with acute coronary syndromes, history of past acute coronary syndromes such as acute myocardial infarction and unstable angina pectoris, and established (known) left ventricular dysfunction, left ventricular hypertrophy, myocardial, valvular, or pericardial disease, or presence of atrial fibrillation on electrocardiography. Patients with acute/chronic renal (serum creatinine level ≥1.5 mg/dL) or hepatic dysfunction, hemolytic disorders, inflammatory disorders including infections and/or autoimmune diseases and neoplastic diseases, psychiatric disorders, systemic disorders, recent major surgical interventions, and patients taking nitrates were also excluded from the study.
Baseline Demographic and Clinical Characteristics
Baseline demographic and clinical variables such as age, gender, personal history of smoking, hypertension, and diabetes mellitus and current use of medications, weight, height, waist and hip circumferences, systolic and diastolic blood pressure, and heart rate were gathered from institutional records. Body mass index was calculated by dividing weight in kilograms by the height in meters squared (kg/m2).
Evaluation of Coronary Angiography and CBF
Selective coronary angiography was performed with the Judkins technique using the Philips Angioscop Xray (Integris HM3000, Philips Medical Systems, Best, the Netherlands) and Toshiba Infinix (CSi, Tochigi, Japan). Two observers blinded to the clinical details of individual participants independently quantified the CBF using the TFC method as described previously, 21 a third author evaluated CBF in case of discrepancy between 2 authors, and final TFC was determined by consensus among 3 authors. Right anterior oblique projection with caudal angulation was used for the evaluation of TFC in the left anterior descending (LAD) and left circumflex (LCx) arteries, whereas the left anterior oblique projection with cranial angulation was used for evaluation of TFC in the right coronary artery (RCA). The TFC was calculated by counting the cineangiographic frames (recorded at 25 frames/s) from proximal to distal predetermined landmarks on each epicardial coronary artery. Complete opacification of the proximal artery lumen at both edges of the lumen with an angiographic contrast agent with forward motion down the artery indicated the first frame. Opacification of the distal predefined landmark branch without the requirement for full opacification indicated the final frame, and these landmarks were as follows 21 : the most distal bifurcation of the LAD which is called pitchfork, the mustache, or whale’s tail; the distal branch of the lateral left ventricular wall artery that descends the largest total distance from the coronary ostium for the LCx; and the first branch of the posterolateral artery for the RCA. Nearest well-visualized landmark at close proximity to these landmarks was chosen in case of poor visualization. The presence of SCF was stated as a TFC greater than 2 standard deviations from the normal published range for any 1 of the 3 vessels (>40.6 frames for LAD, >29.8 frames for LCx, and >27.3 frames for RCA). 21 Increased LAD TFC—mainly due to longer LAD territory—compared to LCx and RCA necessitated a correction by dividing by 1.7 to derive the corrected LAD TFC. 21 Calculating the sum of TFC for corrected LAD, LCx, and RCA and then dividing this sum by 3 revealed the mean TFC for each participant. Inter- and intra-assay coefficients of variations were 6% and 3%, respectively.
Biochemical Variables
Biochemical variables (assessed on index admission) such as fasting glucose, triglyceride (TG), total cholesterol, low-density lipoprotein (LDL) cholesterol and high-density lipoprotein (HDL) cholesterol and urea, creatinine, uric acid, hematocrit level, mean corpuscular volume (MCV), white blood cell and platelet count, and mean platelet volume (MPV) were obtained from institutional records.
Commercially available assay kits (Abbott; Abbott Park, North Chicago, Illinois) with an auto-analyzer (Abbott; Abbott Park) were used for biochemical analysis, whereas an Abbott Cell-Dyne 4000 cell counter (Abbott; Abbott Park) was used for complete blood count at our institution.
Meteorological Data
Meteorological data including daily mean, minimum and maximum temperature (in °C), daily mean, minimum and maximum relative humidity (in %), daily total solar radiation (in MJ/m2), daily mean atmospheric pressure (in hPa, daily mean wind velocity (in m/s), and daily total sunshine duration (in hours) were obtained from archives of Sanliurfa Regional Weather Service (latitude: 37°16′ north; longitude: 38°79′ east; altitude: 550 m), which is located around 250 m from the angiography laboratory of our institution.
Statistical Analysis
All statistical analyses were performed using SPSS for Windows version 17.0 (SPSS, Chicago, Illinois). One-sample Kolmogorov-Smirnov test was used to test the normality of continuous data distribution and revealed normal distribution only for hematocrit levels. We have also tested whether all continuous variables [except for daily mean and minimum temperature which include negative (<0) values] are lognormally distributed after logarithmic (logarithm10 [log10]) conversion, and the statistical analysis revealed lognormal distribution of mean TFC, serum total cholesterol, HDL cholesterol, TG levels, white blood cell count, and MPV. Therefore, we used log10 of the above-mentioned parameters with lognormal distribution. Accordingly, continuous variables were expressed as median ± standard deviation (except for hematocrit, log10 [mean TFC], log10 [total cholesterol], log10 [HDL cholesterol], log10 [triglycerides], log10 [white blood cell count], and log10 [MPV] which were expressed as mean ± standard deviation), whereas categorical variables were expressed as percentages. Comparisons of categorical and continuous variables between the 2 groups were performed using the chi-square test and Mann-Whitney U test (independent samples t test for hematocrit, log10 [mean TFC], log10 [total cholesterol], log10 [HDL cholesterol], log10 [triglycerides], log10 [white blood cell count], and log10 [MPV]), respectively. Independent predictors of SCF was analyzed with multiple logistic regression analysis by including the parameters, which were significantly different between the SCF and the control groups in bivariate analysis. Odds ratio (OR), 95% confidence interval (CI) values, and significance for multiple logistic regression analysis were reported.
The correlation between log10 (mean TFC) and clinical, laboratory, and meteorological parameters was assessed by the Spearman correlation test (except for hematocrit, log10 [total cholesterol], log10 [HDL cholesterol], log10 [triglycerides], log10 [white blood cell count], and log10 [MPV] which were assessed with Pearson correlation analysis). Multiple linear regression analysis was performed to identify the parameters that were independently associated with log10 (mean TFC) by including the parameters that were correlated with log10 (mean TFC) in bivariate analysis. Standardized β regression coefficients and the significance of multiple linear regression analysis were reported.
The study population was also arbitrarily grouped according to the date of coronary angiography: winter months (October 15-April 14) and summer months (April 15-October 14). Patients who underwent coronary angiography during the winter months were then compared to patients who underwent coronary angiography during summer months with regard to clinical and angiographic characteristics. To independently determine different variables between the 2 groups, multiple logistic regression analysis was performed by including the parameters that were significantly different between the 2 groups in bivariate analysis. The OR, 95% CI values, and significance of multiple logistic regression analysis were reported. A 2-sided P value <.05 was considered statistically significant.
Results
A total of 1206 patients (median age = 53 years, 723 [60%] female) were included in the present study.
Assessment of CBF and Comparison of Normal CBF and SCF Groups
Assessment of coronary angiographies revealed SCF in LAD in 154 cases, in RCA in 12 cases, in LAD and LCx in 9 cases, in LAD and RCA in 15 cases, in LCx and RCA in 1 case, and in all 3 coronary arteries in 5 cases. Accordingly, 196 cases were diagnosed as SCF, whereas 1010 cases were diagnosed as normal CBF.
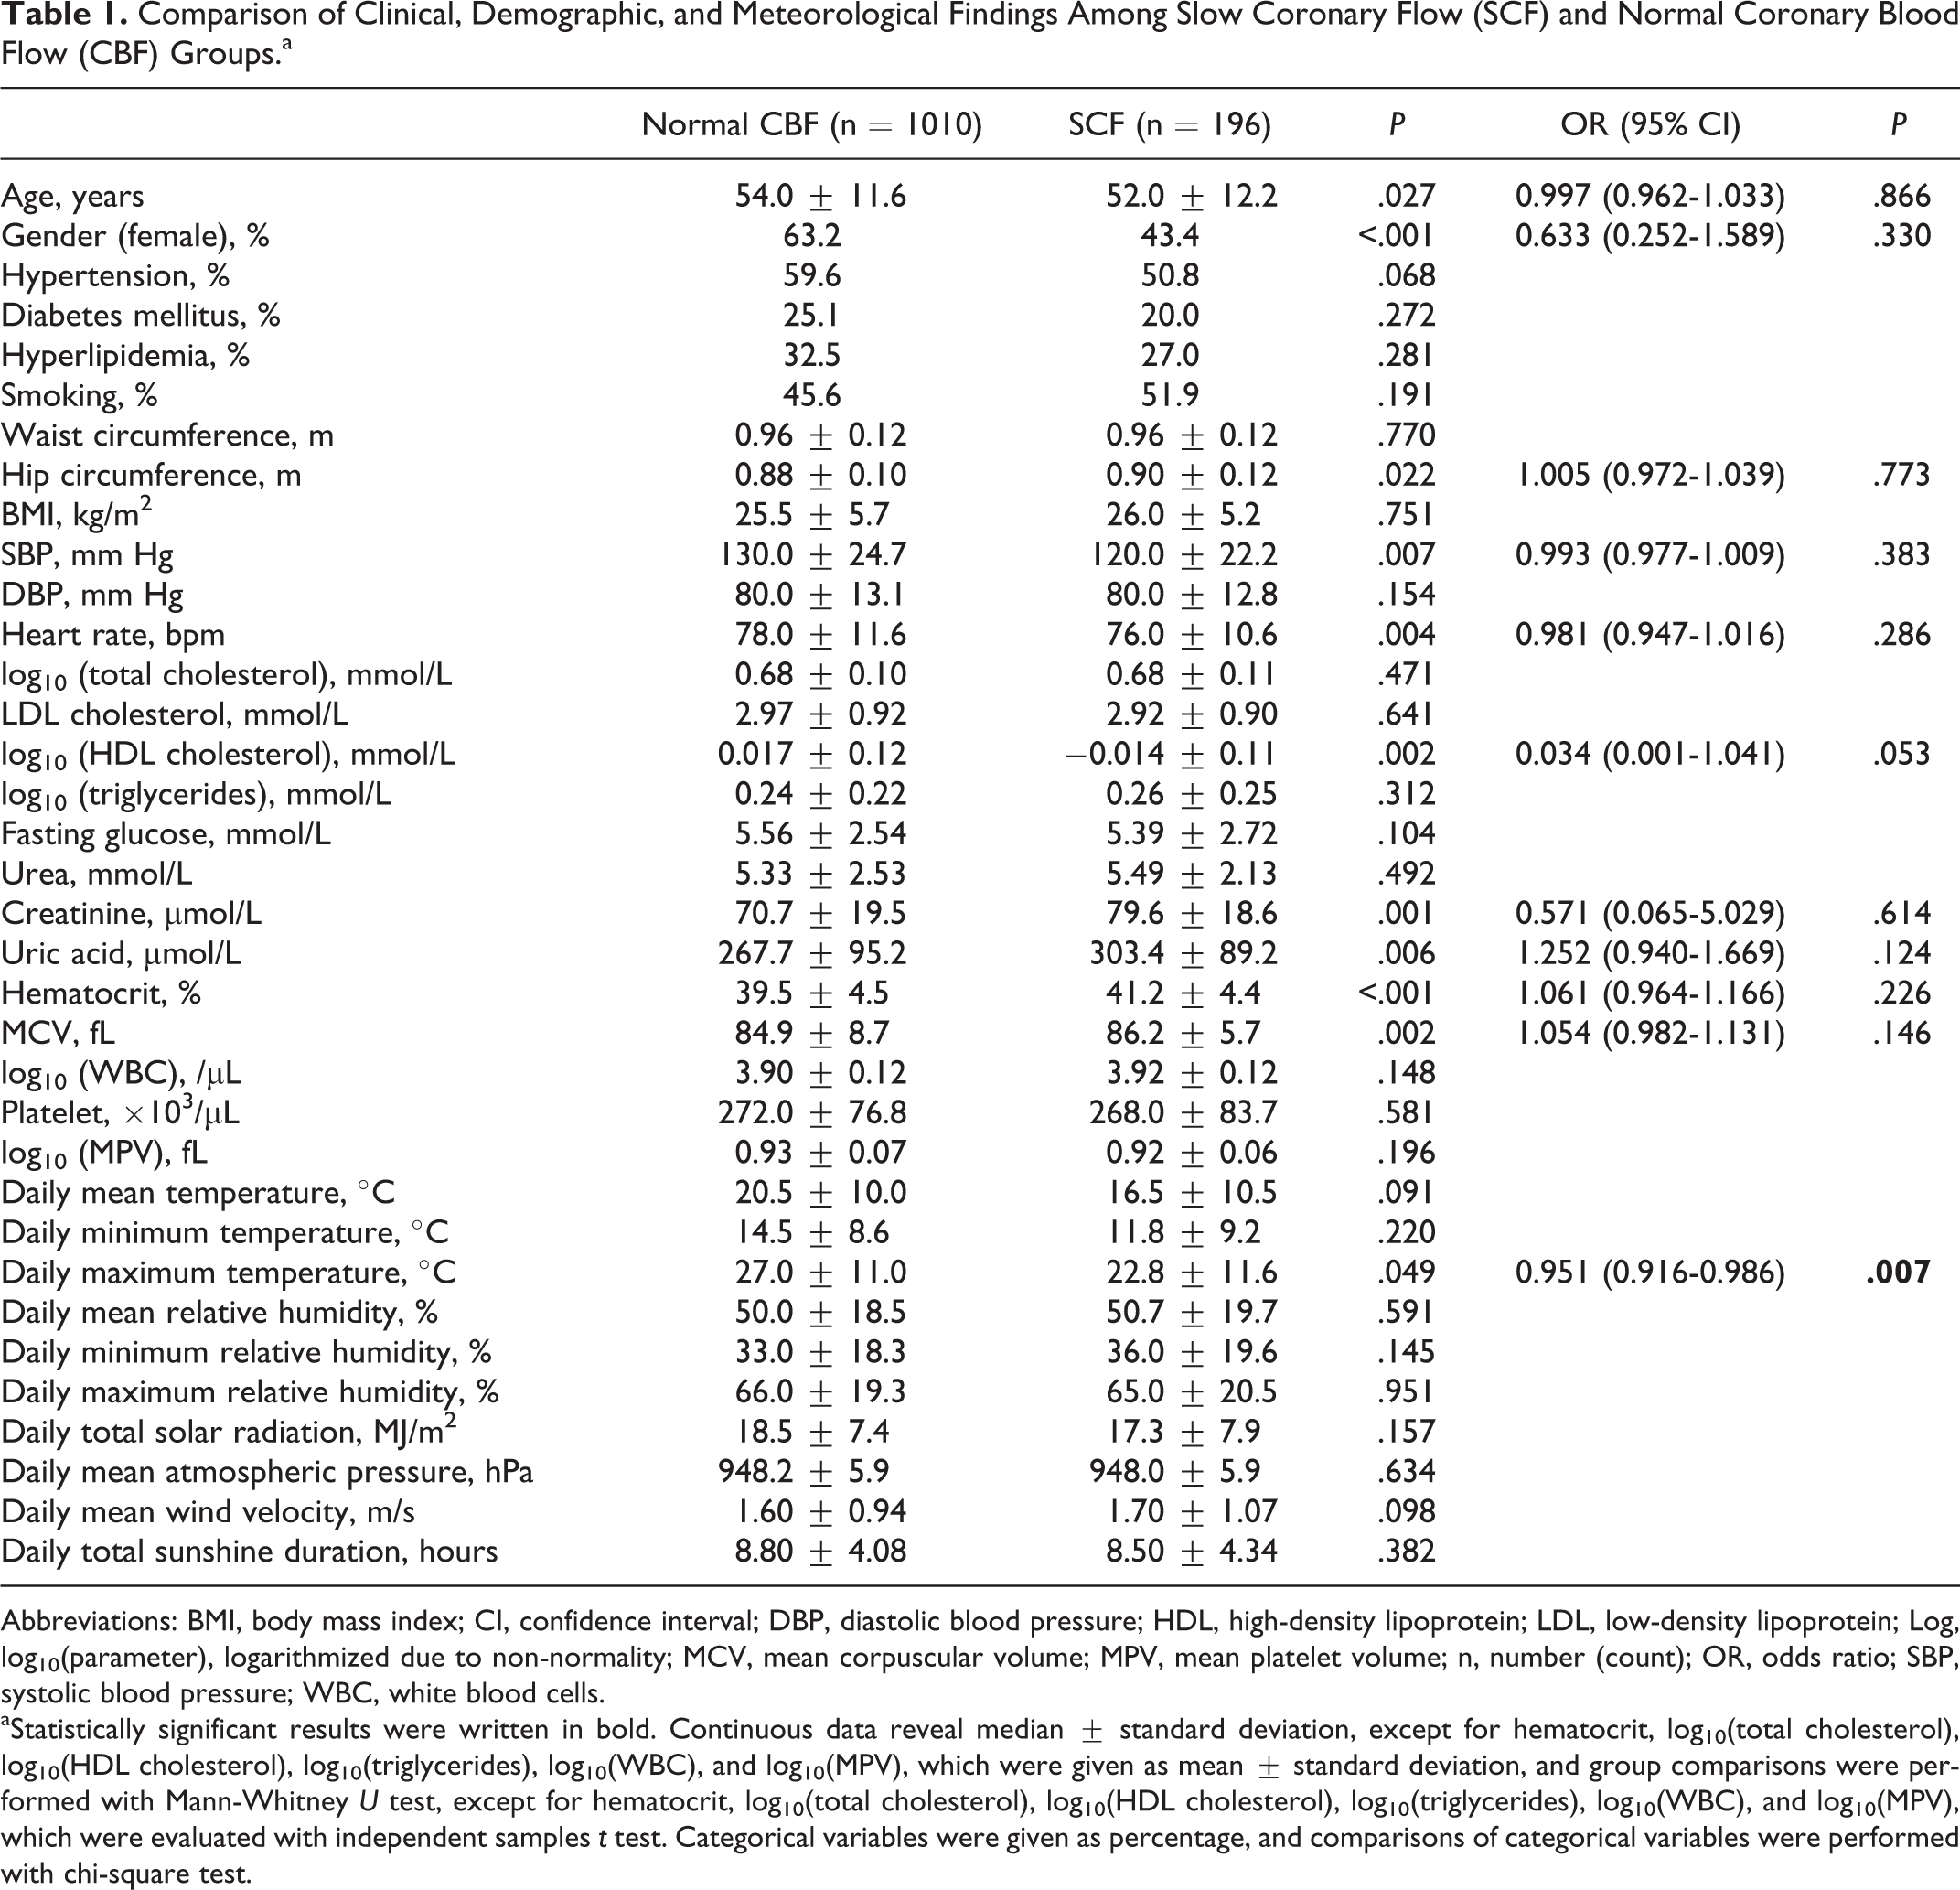
Comparison of the normal CBF group with the SCF group revealed increased age, frequency of male gender, hip circumference, serum creatinine and uric acid levels, hematocrit and MCV values and decreased systolic blood pressure, heart rate, log10 (HDL cholesterol), and daily maximum temperature (Figure 1) in the SCF group, whereas only daily maximum temperature was independently associated with the presence of SCF (Table 1).
Diagram illustrating a statistically significant decrease in daily maximum temperature in the slow coronary flow group compared to the normal coronary blood flow group (P = .049 for comparison). CI indicates confidence interval; CBF, coronary blood flow; SCF, slow coronary flow. Comparison of Clinical, Demographic, and Meteorological Findings Among Slow Coronary Flow (SCF) and Normal Coronary Blood Flow (CBF) Groups.a
Abbreviations: BMI, body mass index; CI, confidence interval; DBP, diastolic blood pressure; HDL, high-density lipoprotein; LDL, low-density lipoprotein; Log, log10(parameter), logarithmized due to non-normality; MCV, mean corpuscular volume; MPV, mean platelet volume; n, number (count); OR, odds ratio; SBP, systolic blood pressure; WBC, white blood cells.
aStatistically significant results were written in bold. Continuous data reveal median ± standard deviation, except for hematocrit, log10(total cholesterol), log10(HDL cholesterol), log10(triglycerides), log10(WBC), and log10(MPV), which were given as mean ± standard deviation, and group comparisons were performed with Mann-Whitney U test, except for hematocrit, log10(total cholesterol), log10(HDL cholesterol), log10(triglycerides), log10(WBC), and log10(MPV), which were evaluated with independent samples t test. Categorical variables were given as percentage, and comparisons of categorical variables were performed with chi-square test.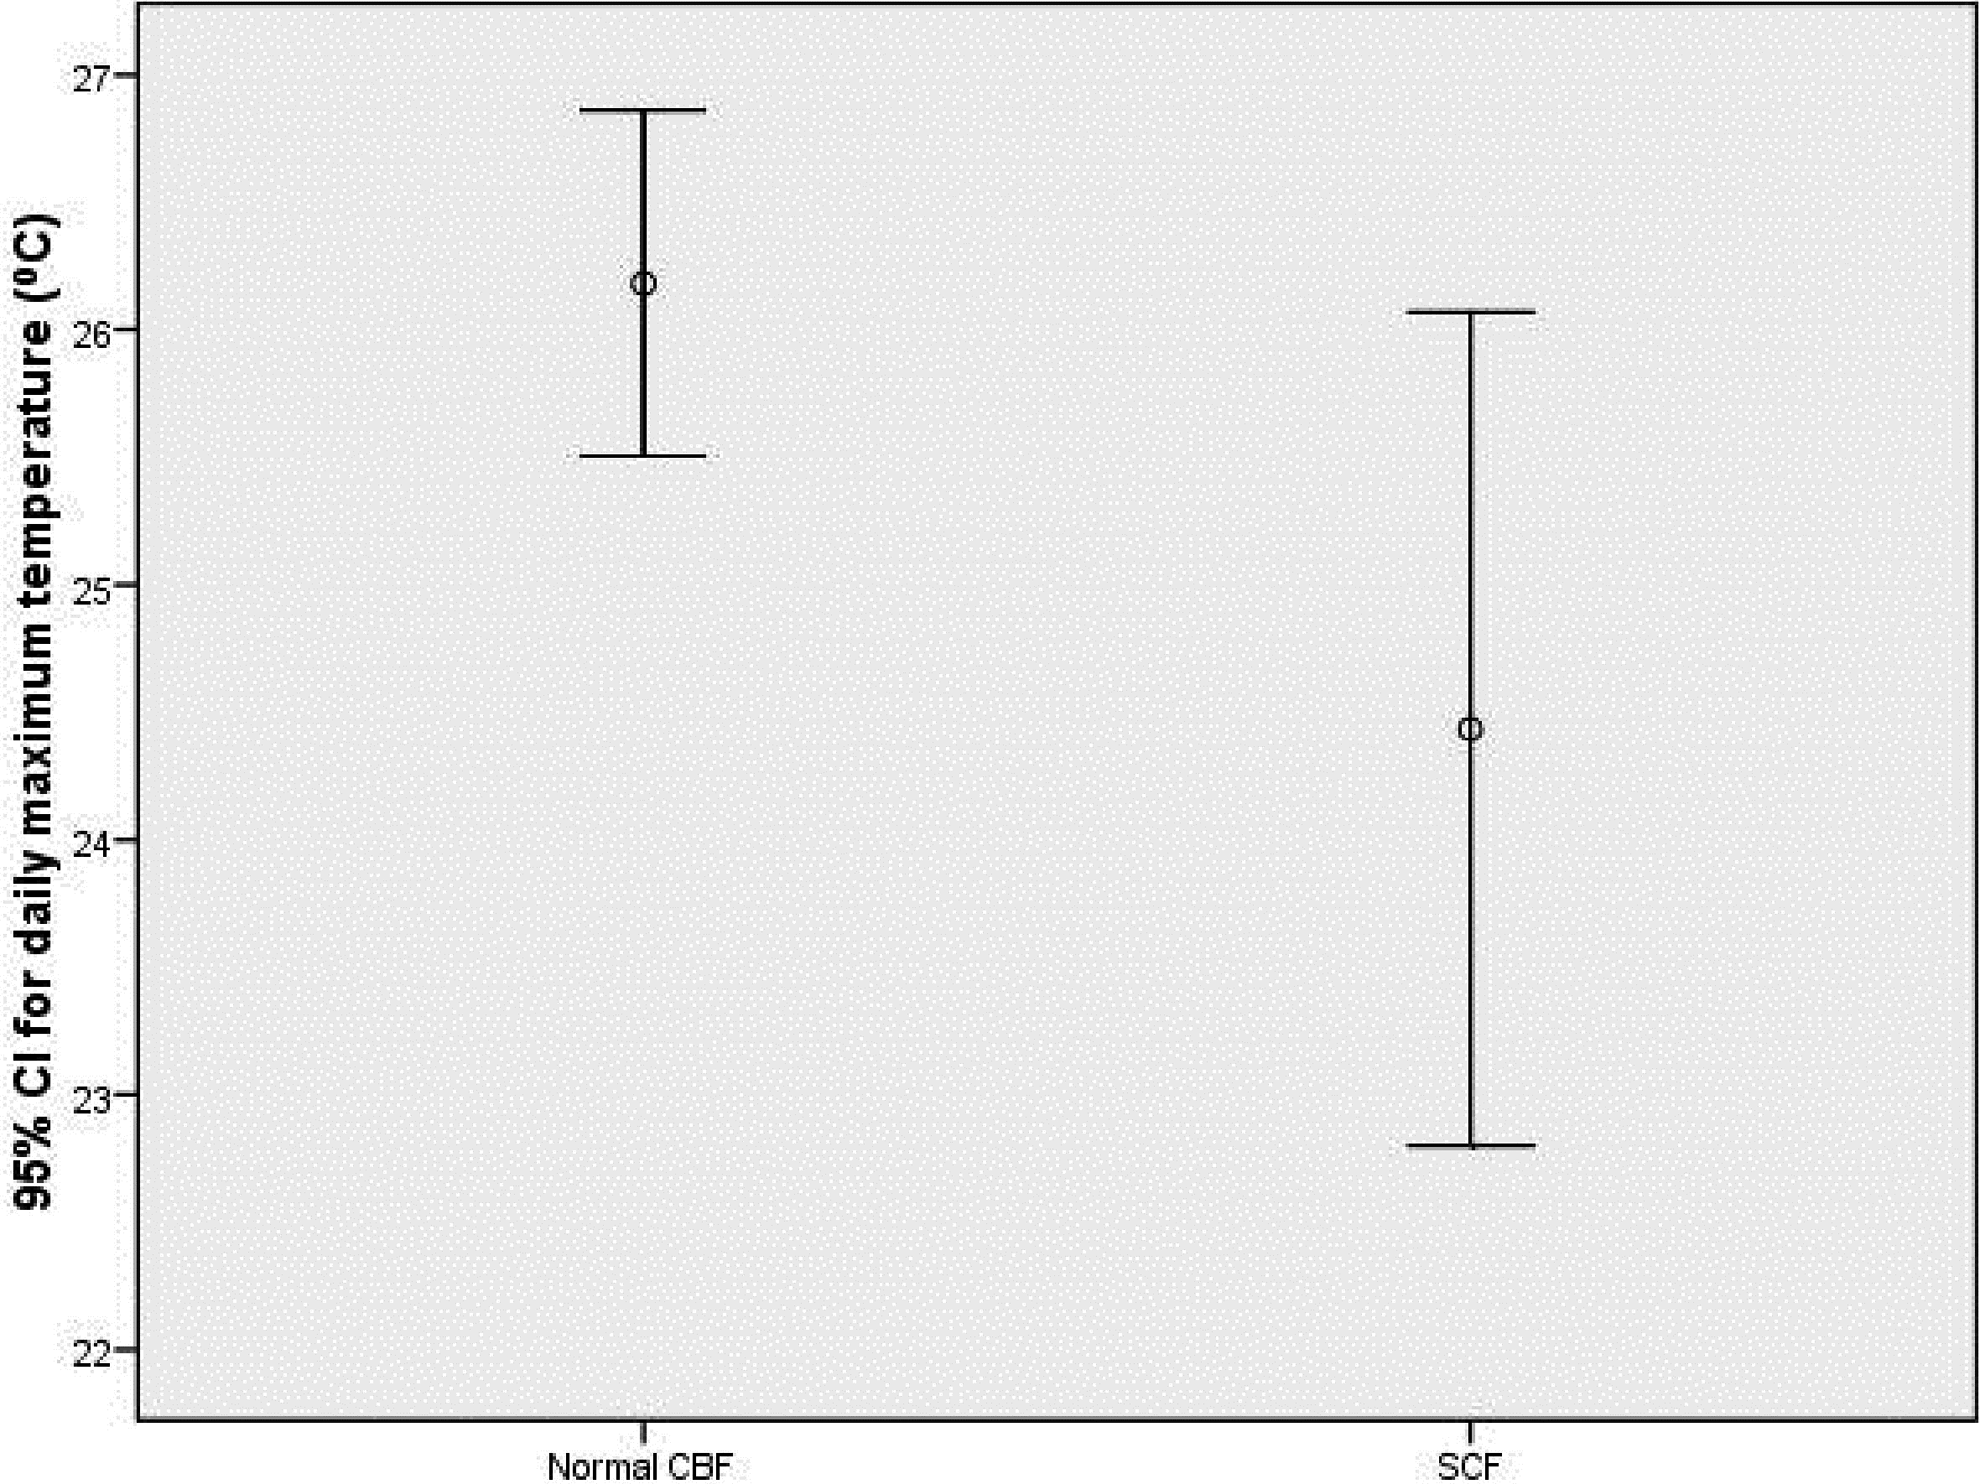
Correlation of Mean TFC and Clinical, Laboratory, and Meteorological Parameters
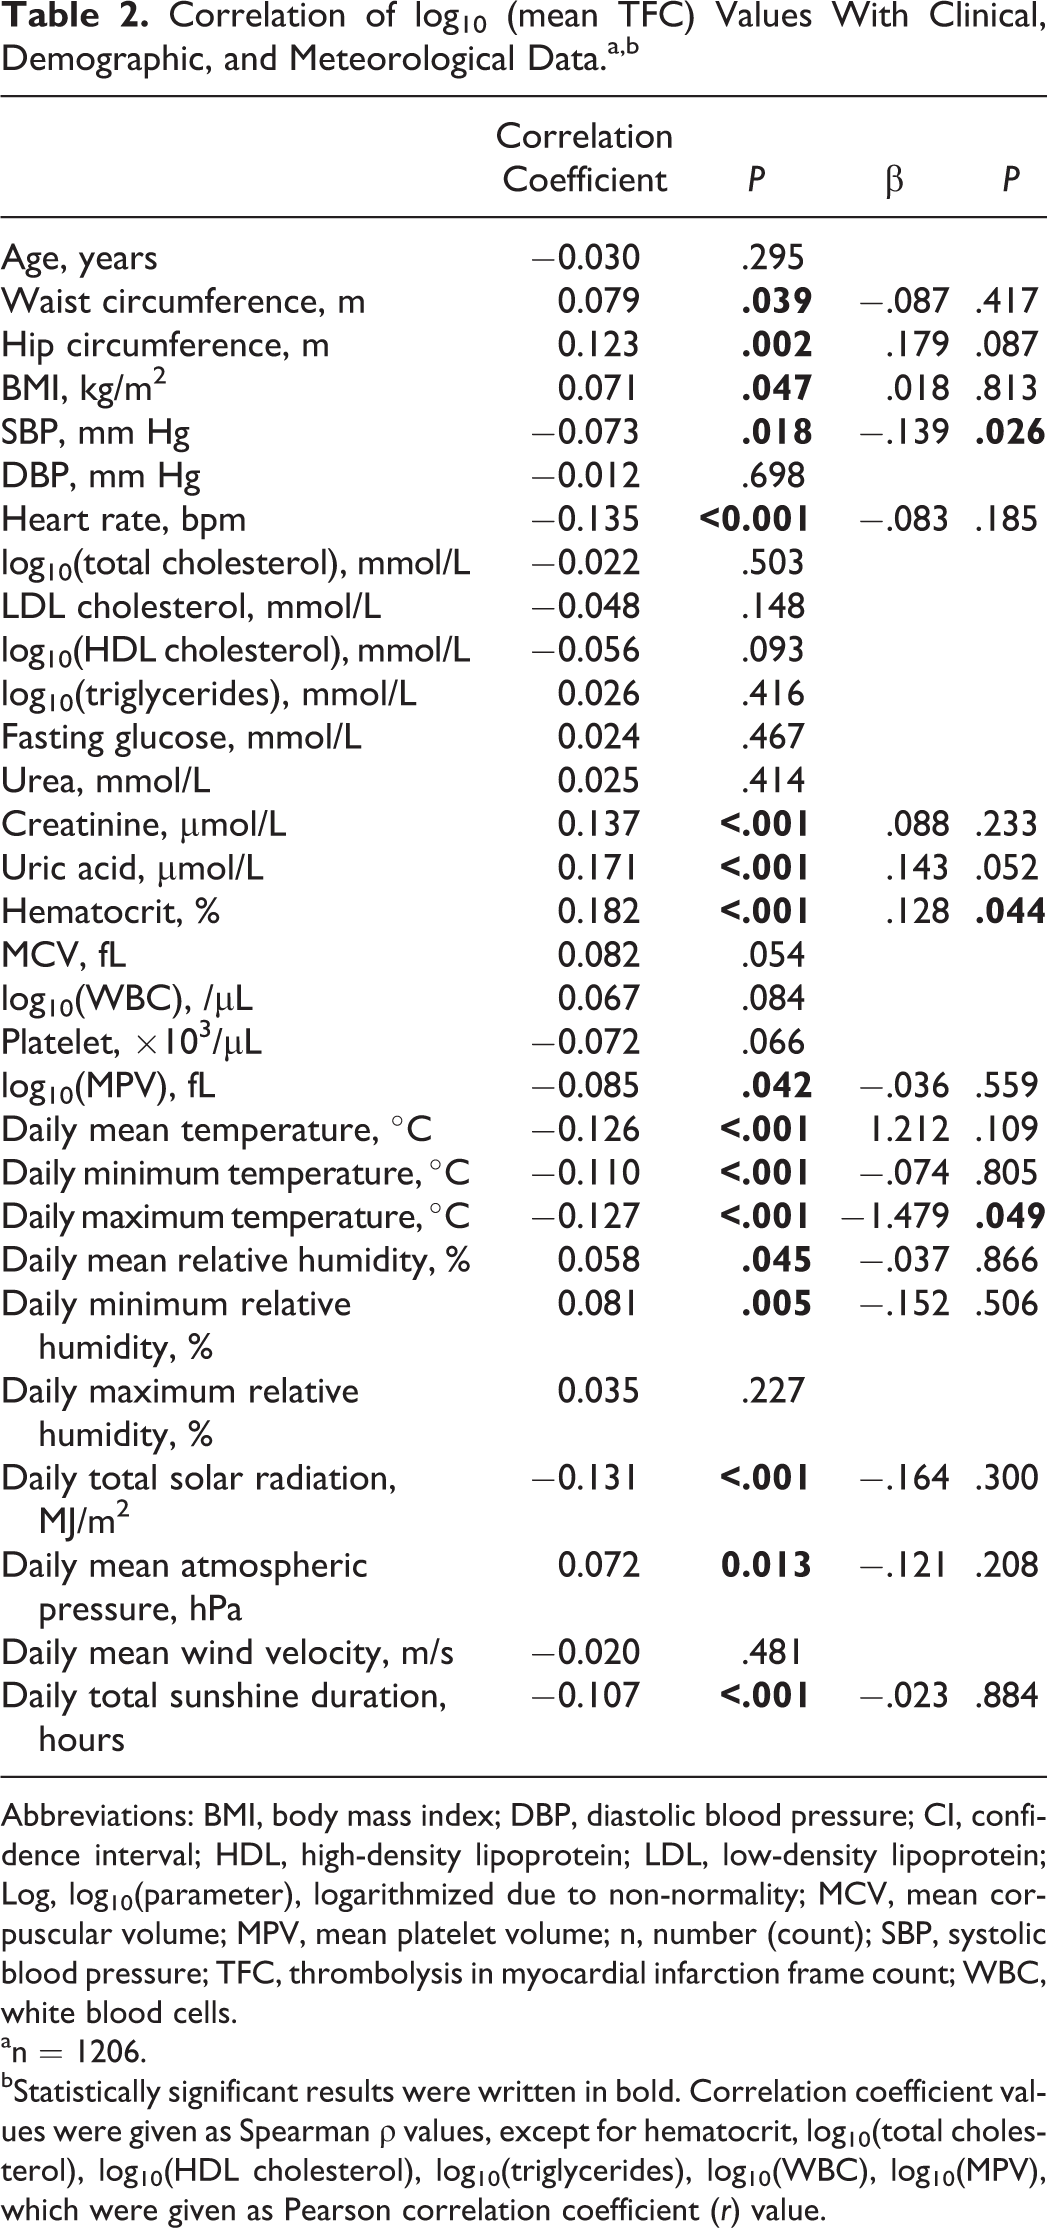
Correlation analysis revealed a significant association of log10 (mean TFC) and waist and hip circumference, BMI, systolic blood pressure, heart rate, serum creatinine and uric acid levels, hematocrit levels, and log10 (MPV), besides daily mean, minimum, and maximum temperature (Figure 2), daily mean and minimum relative humidity, daily total solar radiation, daily mean atmospheric pressure, and daily total sunshine duration. Independent predictors of log10 (mean TFC), excluding the impact of analyzed confounding factors, were systolic blood pressure, hematocrit level, and daily maximum temperature (Table 2).
Diagram illustrating statistically significant negative correlation of log10 (mean thrombolysis in myocardial infarction [TIMI] frame count [TFC]; log10 [mean TFC]) and daily maximum temperature (Spearman ρ = −.127; P < .001). Log10 (mean TFC) indicates log10 of mean TFC logarithmized due to nonnormality, Mean TFC: mean thrombolysis in myocardial infarction (TIMI) frame count. Correlation of log10 (mean TFC) Values With Clinical, Demographic, and Meteorological Data.a,b
Abbreviations: BMI, body mass index; DBP, diastolic blood pressure; CI, confidence interval; HDL, high-density lipoprotein; LDL, low-density lipoprotein; Log, log10(parameter), logarithmized due to non-normality; MCV, mean corpuscular volume; MPV, mean platelet volume; n, number (count); SBP, systolic blood pressure; TFC, thrombolysis in myocardial infarction frame count; WBC, white blood cells.
an = 1206.
bStatistically significant results were written in bold. Correlation coefficient values were given as Spearman ρ values, except for hematocrit, log10(total cholesterol), log10(HDL cholesterol), log10(triglycerides), log10(WBC), log10(MPV), which were given as Pearson correlation coefficient (r) value.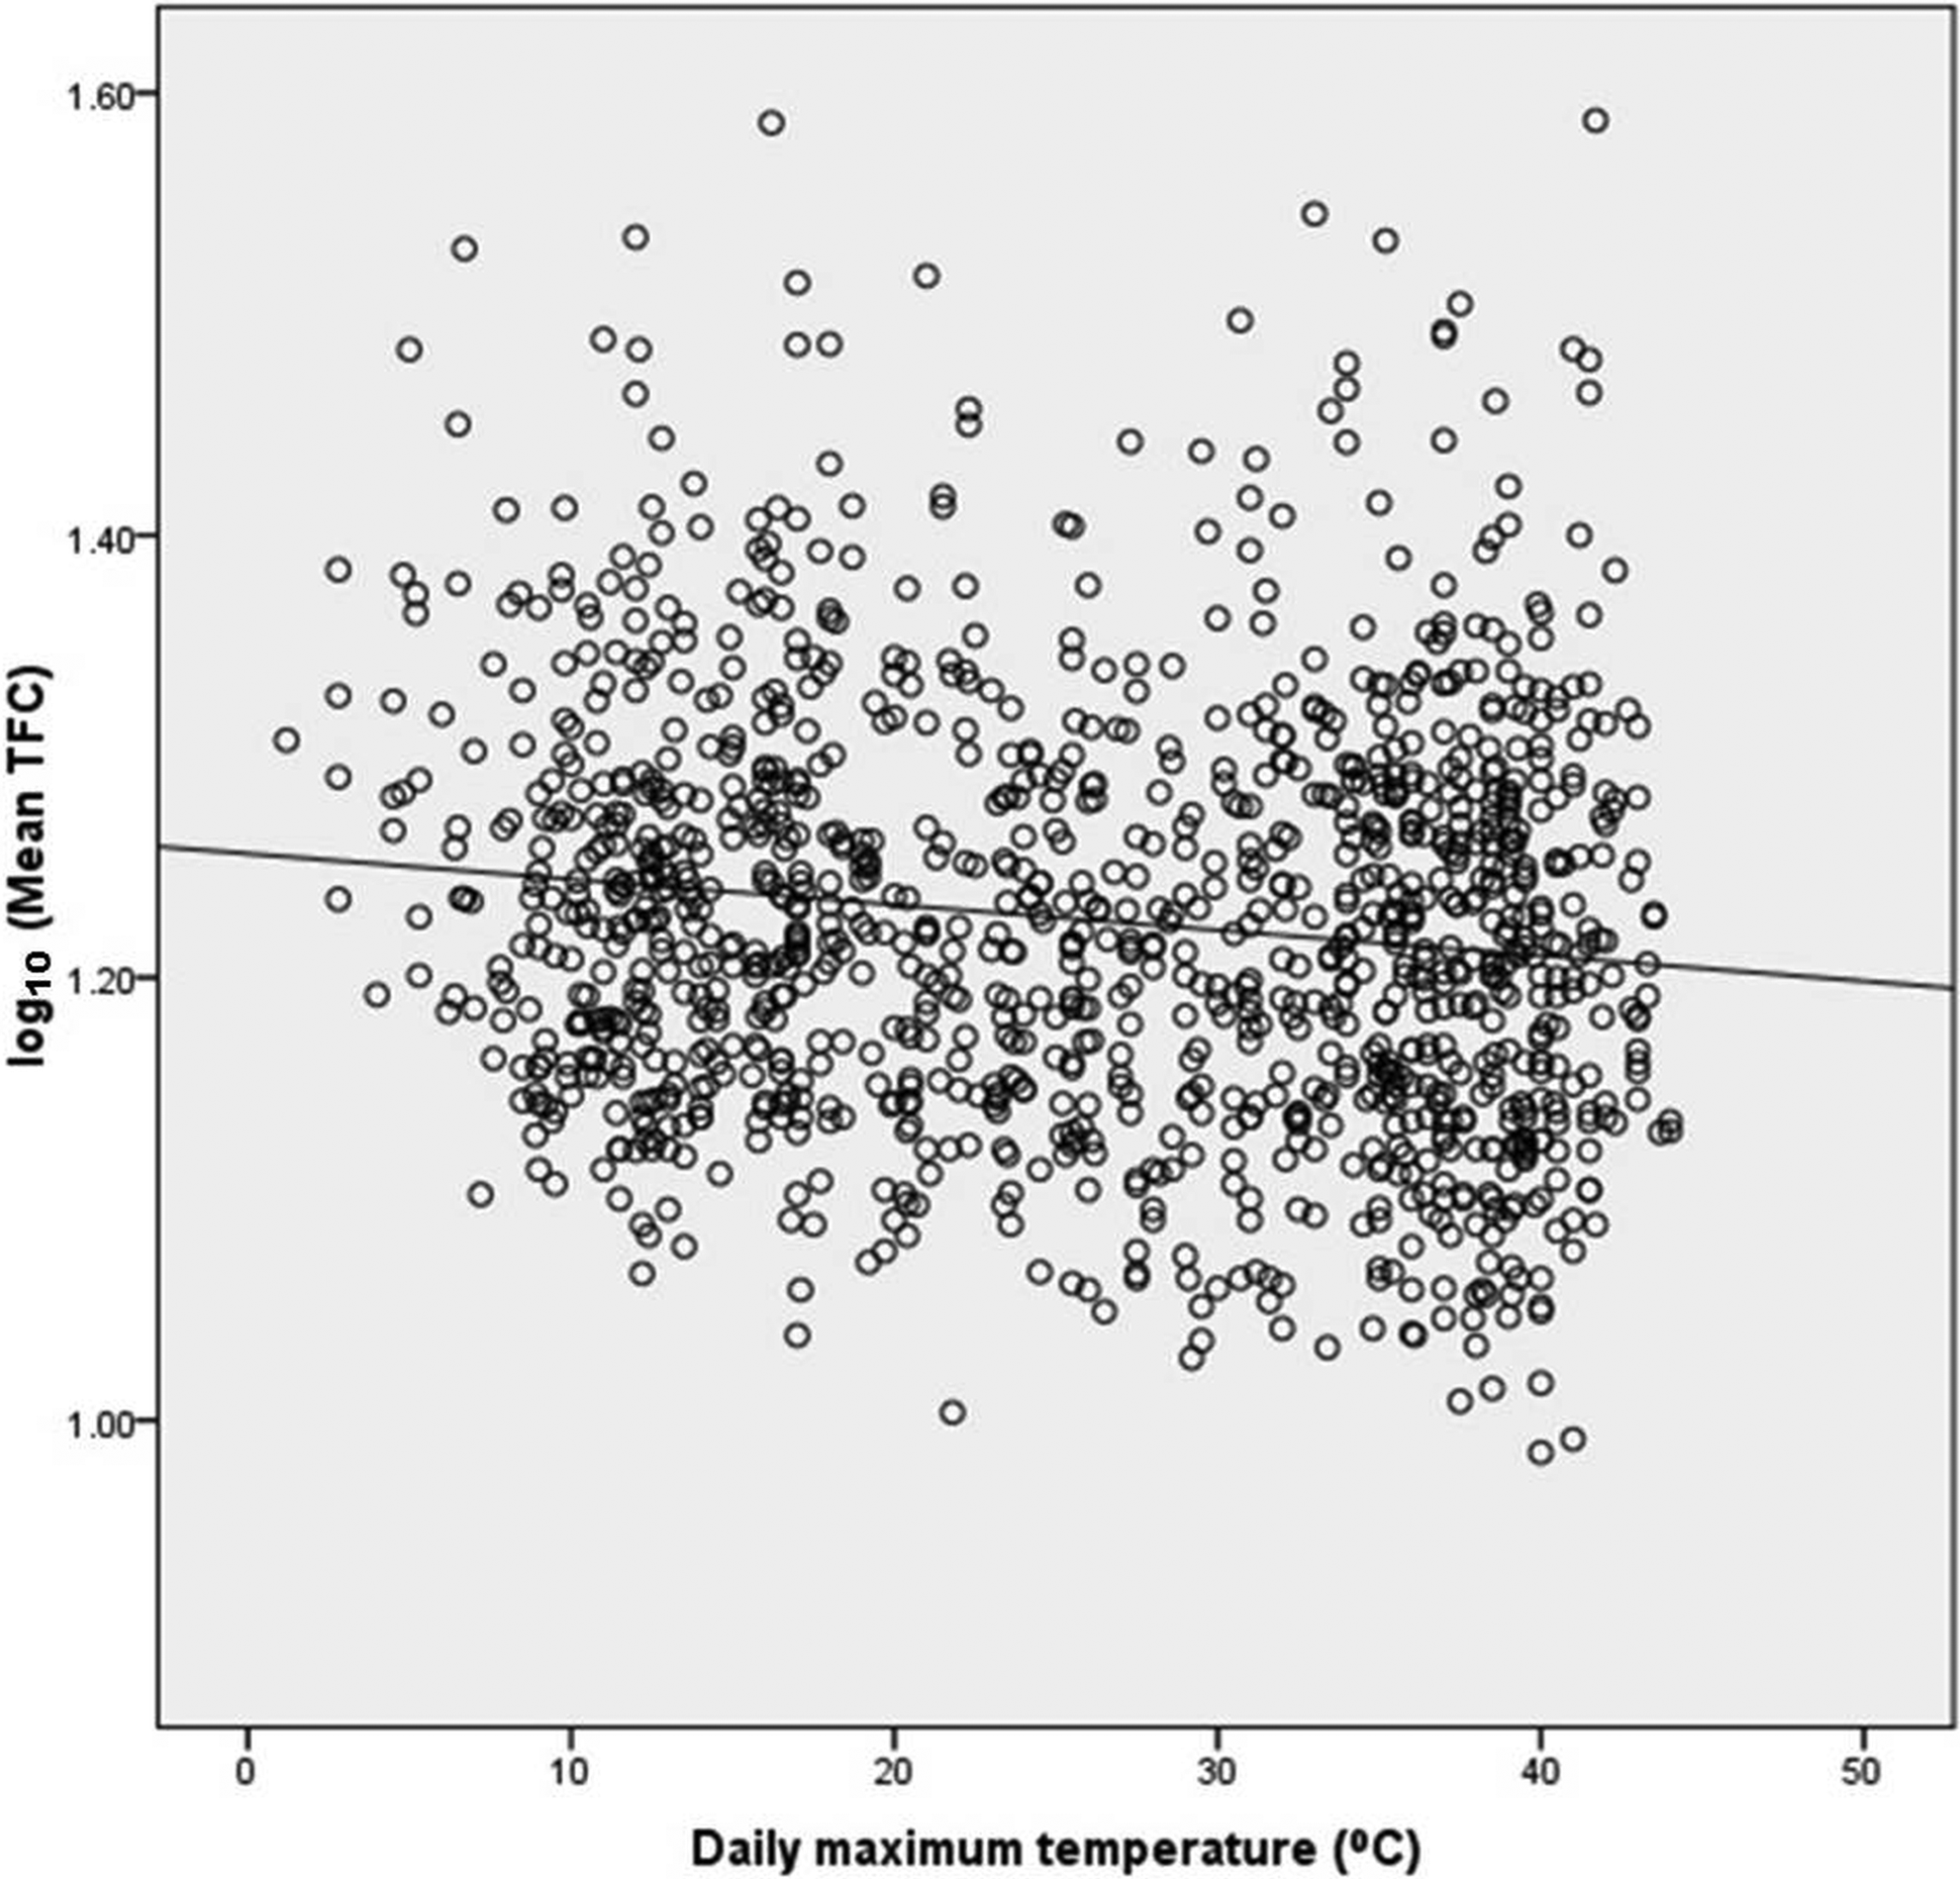
Comparison of Clinical, Demographic, and Angiographic Findings Among Cold Winter and Hot Summer Months
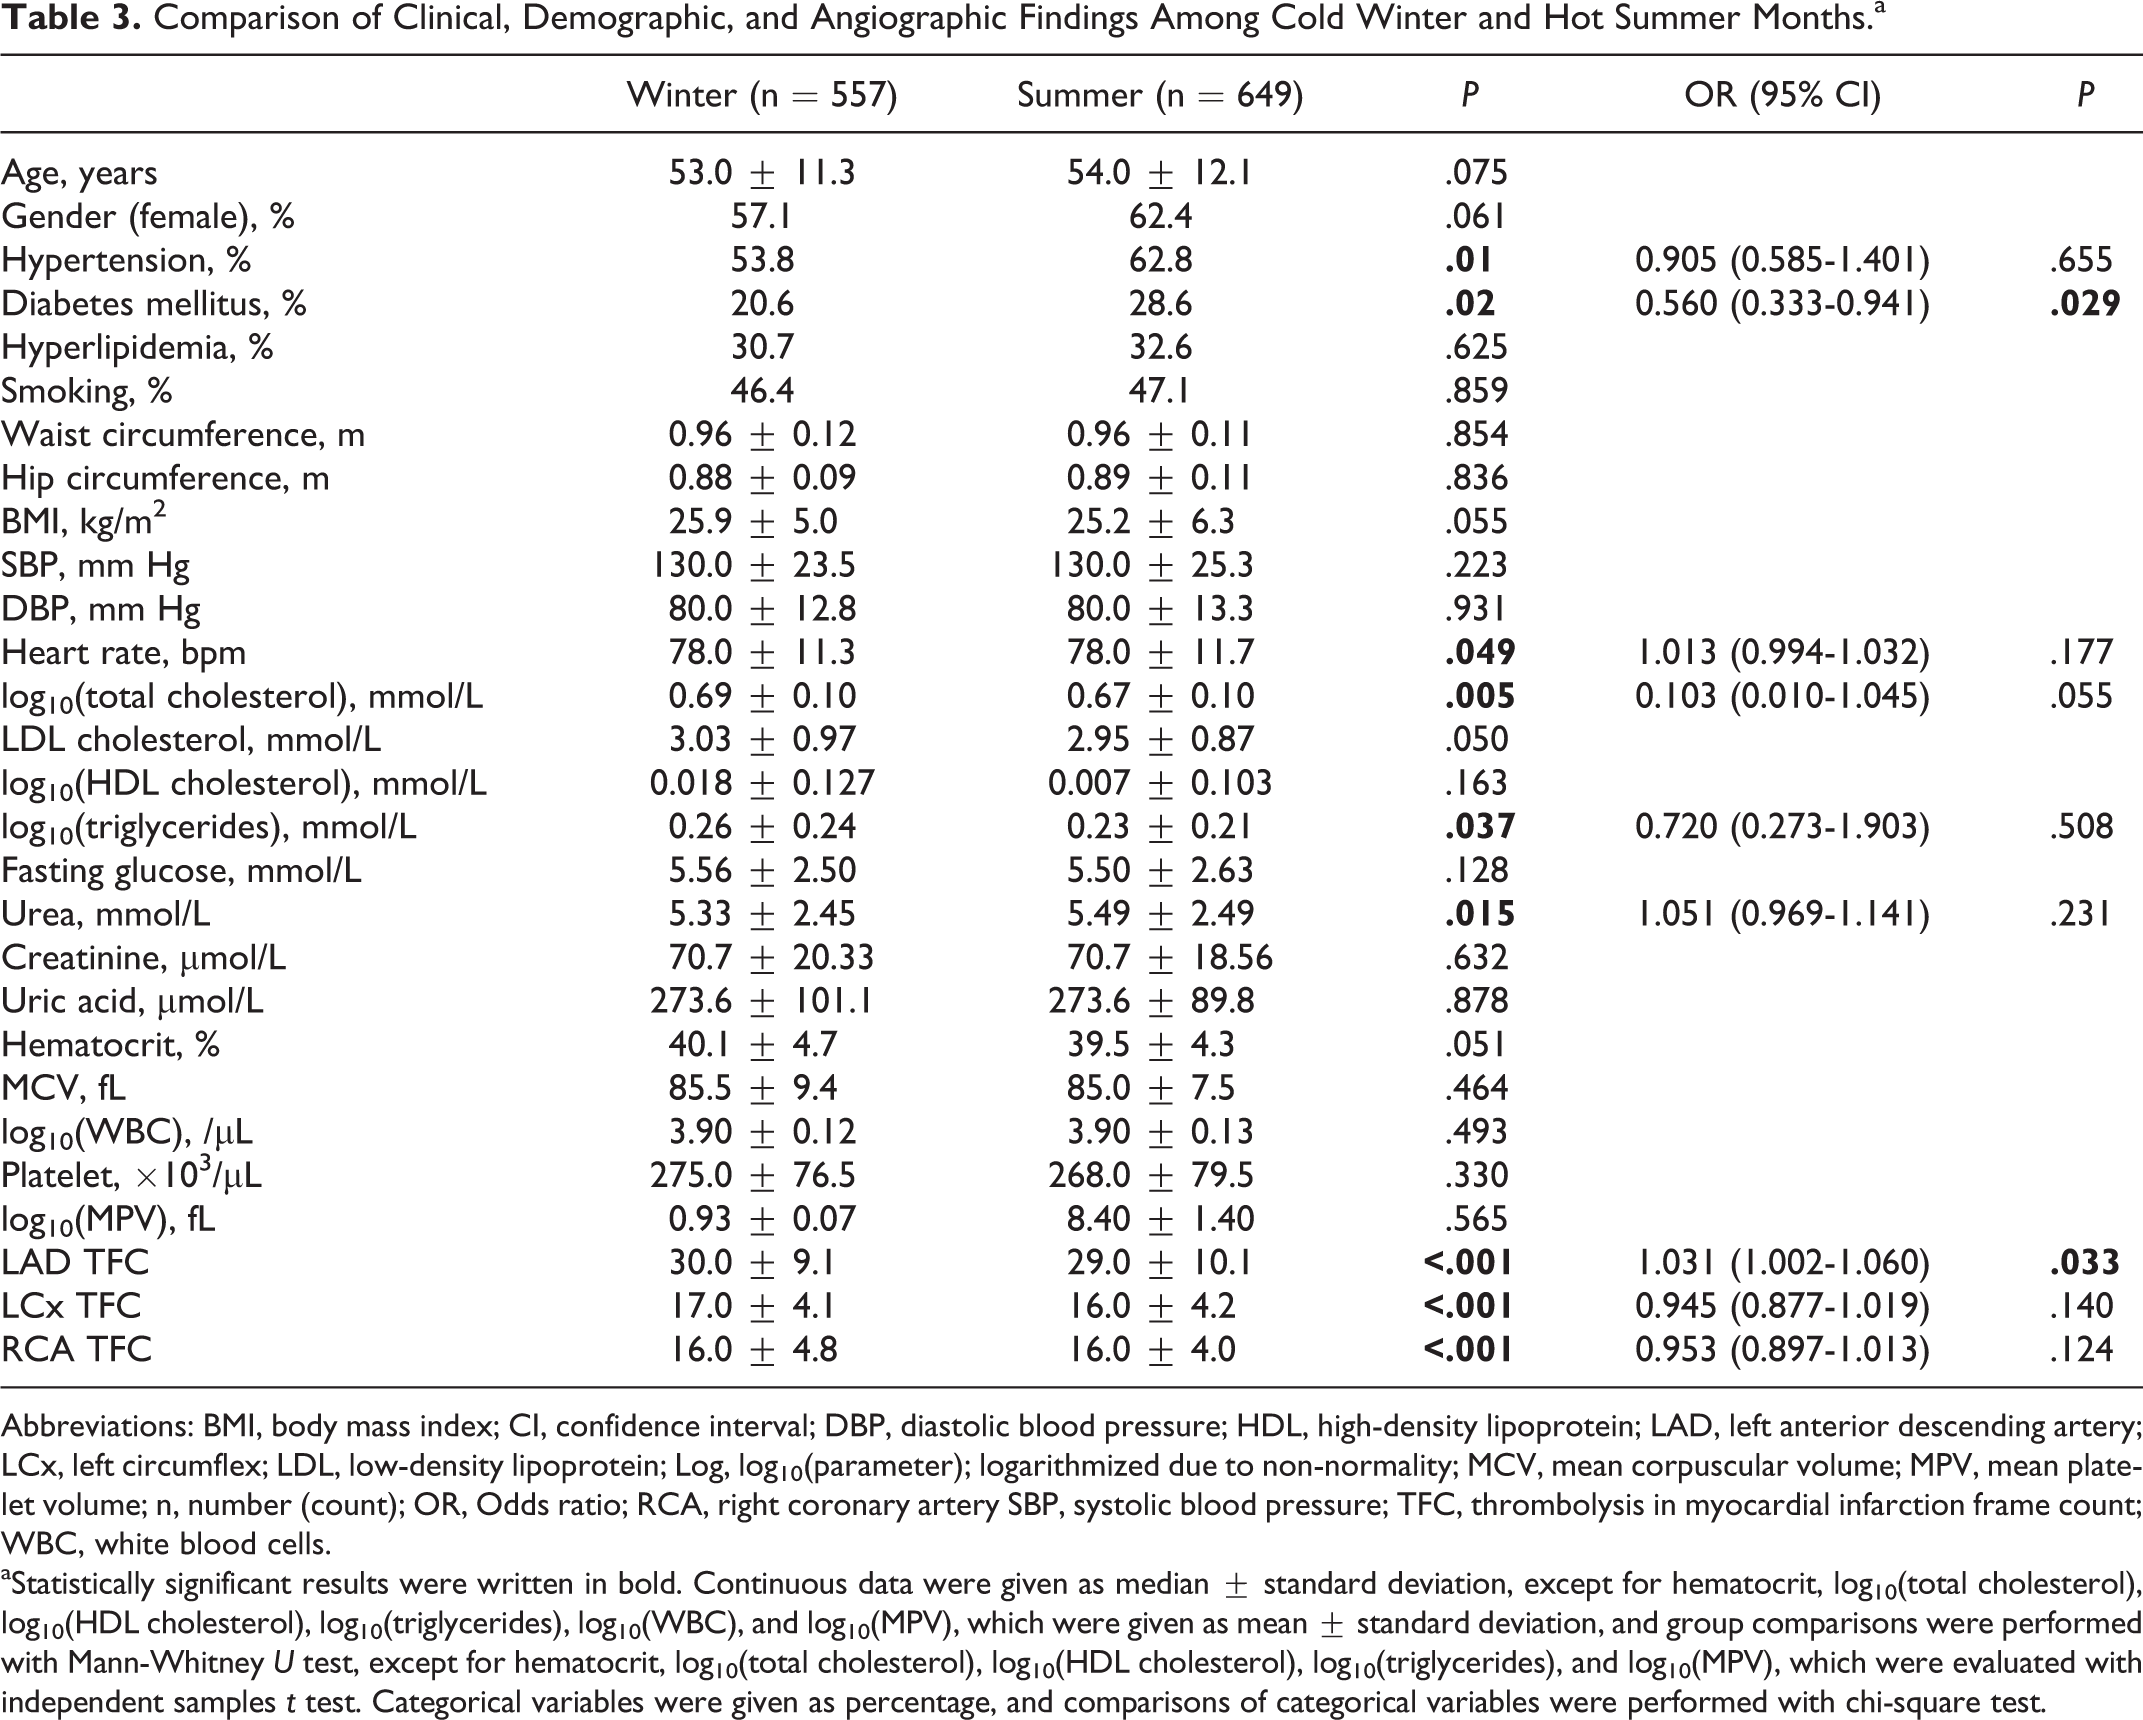
Comparison of patients who underwent coronary angiography during winter months (October 15-April 14) to those who underwent coronary angiography during summer months (April 15-October 14) with regard to clinical and angiographic characteristics revealed decreased frequency of hypertension and diabetes mellitus, decreased heart rate and serum urea level, increased log10 (total cholesterol) and log10 (triglyceride), and increased LAD (Figure 3), LCX, and RCA TFC during cold winter months compared to during hot summer months, although the independent difference was present only the frequency of diabetes mellitus and in the LAD TFC (Table 3).
Diagram illustrating a statistically significant increase in left anterior descending artery thrombolysis in myocardial infarction (TIMI) frame count (TFC) in winter months compared to summer months (P < .001 for comparison). CI indicates confidence interval; LAD, left anterior descending artery; TFC, thrombolysis in myocardial infarction (TIMI) frame count. Comparison of Clinical, Demographic, and Angiographic Findings Among Cold Winter and Hot Summer Months.a
Abbreviations: BMI, body mass index; CI, confidence interval; DBP, diastolic blood pressure; HDL, high-density lipoprotein; LAD, left anterior descending artery; LCx, left circumflex; LDL, low-density lipoprotein; Log, log10(parameter); logarithmized due to non-normality; MCV, mean corpuscular volume; MPV, mean platelet volume; n, number (count); OR, Odds ratio; RCA, right coronary artery SBP, systolic blood pressure; TFC, thrombolysis in myocardial infarction frame count; WBC, white blood cells.
aStatistically significant results were written in bold. Continuous data were given as median ± standard deviation, except for hematocrit, log10(total cholesterol), log10(HDL cholesterol), log10(triglycerides), log10(WBC), and log10(MPV), which were given as mean ± standard deviation, and group comparisons were performed with Mann-Whitney U test, except for hematocrit, log10(total cholesterol), log10(HDL cholesterol), log10(triglycerides), and log10(MPV), which were evaluated with independent samples t test. Categorical variables were given as percentage, and comparisons of categorical variables were performed with chi-square test.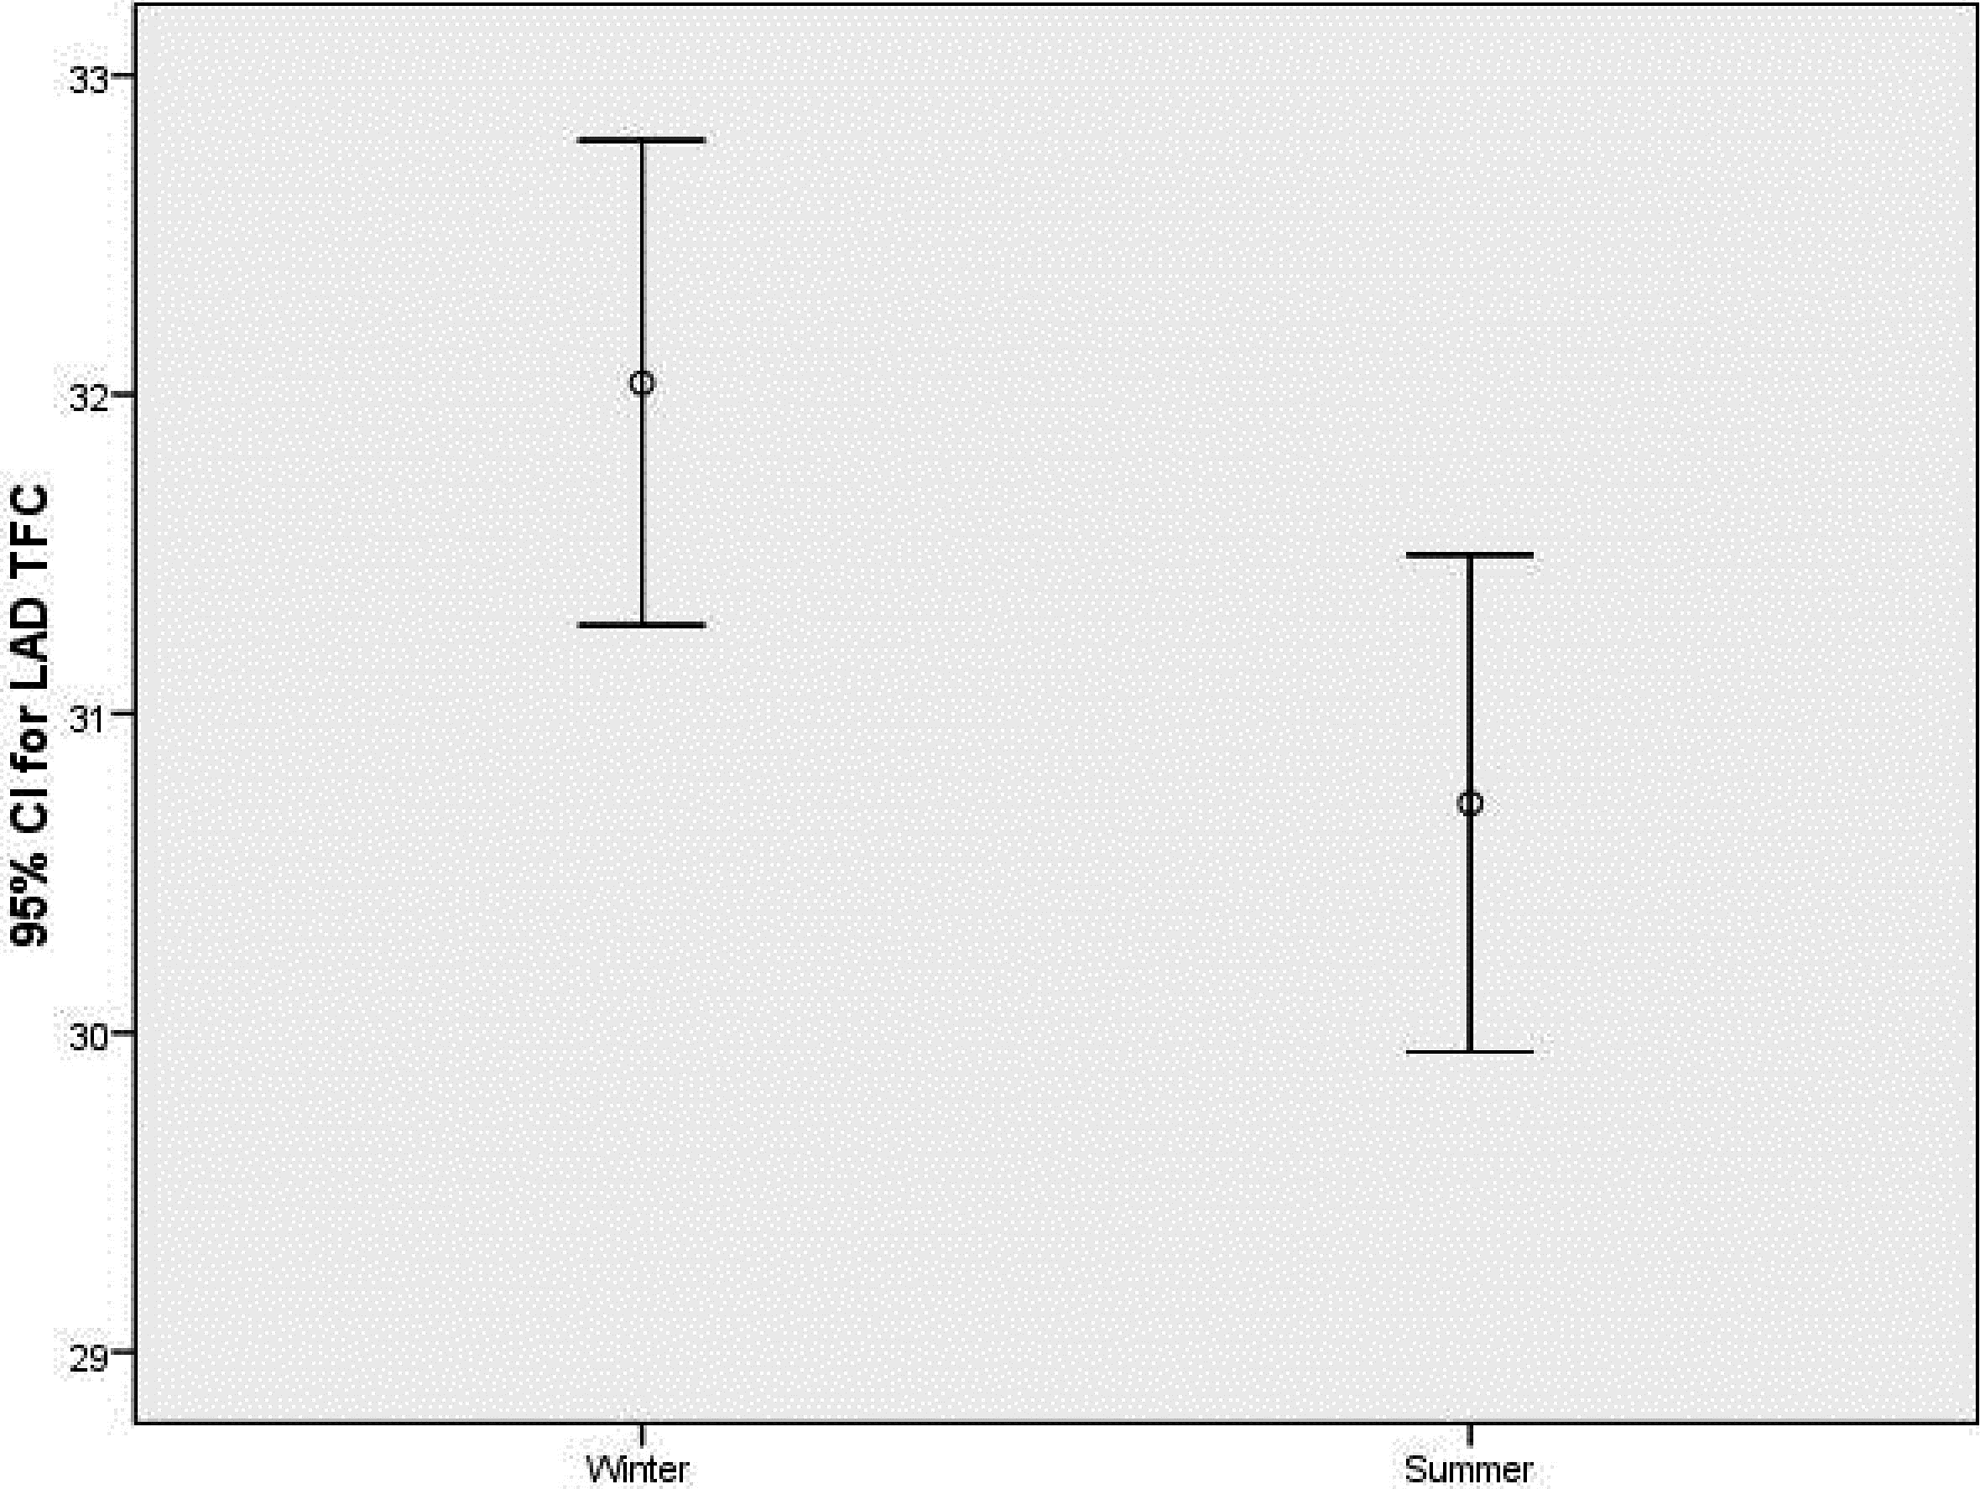
Analysis of SCF frequency with regard to the months of the year revealed no significant difference in SCF frequency among different months of the year, although the percentage of SCF was considerably increased during January and December (coolest months in the province of the study population) besides during July (hottest month in the province of the study population; P > .05 for comparisons; Figure 4).
Diagram illustrating the frequency of normal coronary blood flow (CBF; bottom) and slow coronary flow (SCF; top) in the 12 months of the study period. Note that there is no statistically significant difference in SCF percentage for the 12 months (P > .05), although the percentage of SCF was considerably increased during January and December (the coolest months in the province of the study population) as well as during July (the hottest month in the province of the study population). Numbers on the top of the bars represent the percentage of SCF for each month.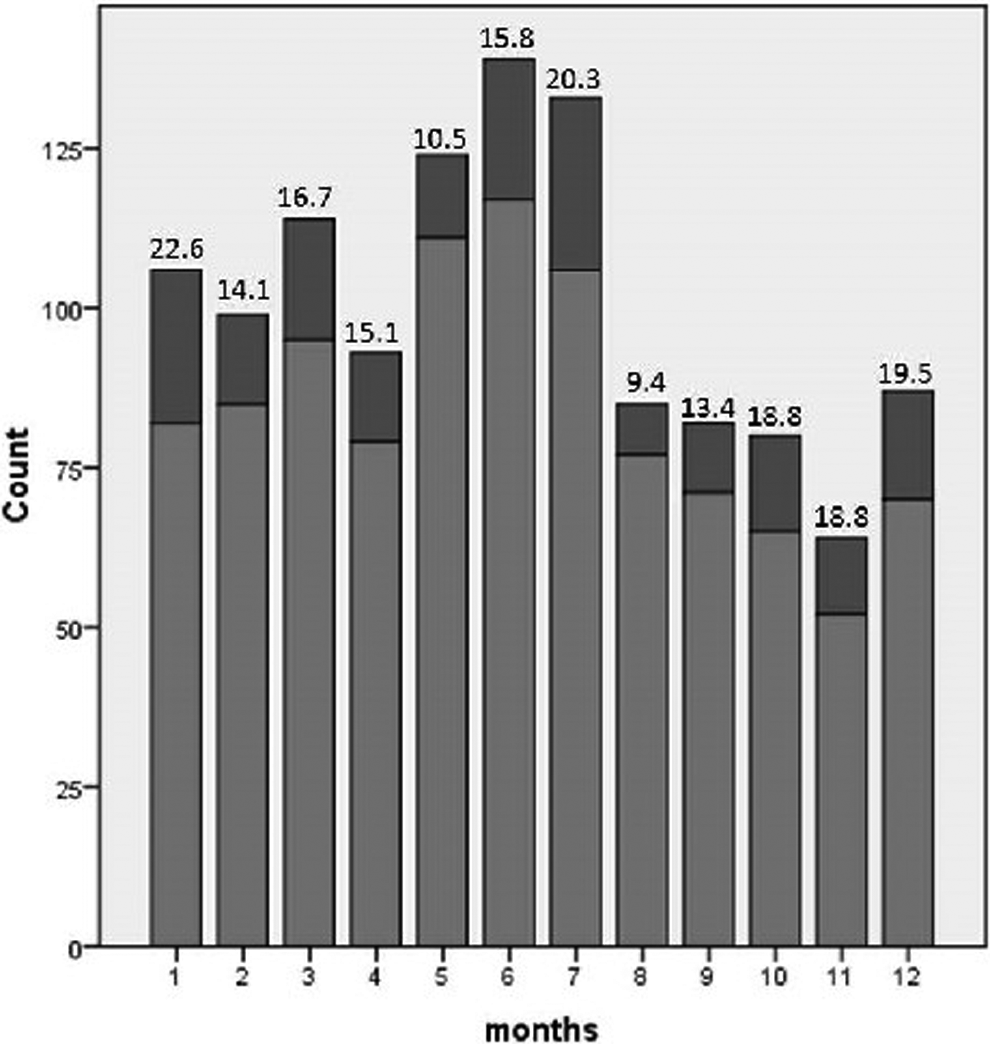
Discussion
Cold Weather in Winter Months
Several studies have established the impact of meteorological variables on cardiovascular health, and air temperature is the most widely studied meteorological index that seems to be associated with cardiovascular morbidity and mortality. Previous studies revealed that lower daily mean temperature increased hospital admissions for acute coronary syndromes 11 and myocardial infarction, 1 and nearly 200 additional myocardial infarctions in the United Kingdom on each day were proposed to occur as a consequence of every 1°C reduction in temperature. 22
In addition to acute coronary syndromes, the frequency of acute heat failure attacks, 4 atrial fibrillation paroxysms, 3 ischemic strokes and intracerebral hemorrhages, 5 acute aortic dissection, 23 and eclampsia 6 were all increased during the cold weather in winter months compared to during hot weather in summer months. Consequently, cold weather was reported to be associated with all-cause 24 and cardiovascular mortality, 1 besides heart failure mortality, 25 stroke fatality, 26 and sudden death. 27
Findings of the present study have shown that daily mean, minimum, and maximum temperature, daily total solar radiation, and daily total sunshine duration were all negatively correlated with log10 (mean TFC), whereas the daily maximum temperature was an independent predictor of mean TFC with a statistically significant (and independent) decrease in daily maximum temperature in the SCF group compared to the normal CBF group. Correspondingly, LAD, LCx, and RCA TFC were all decreased during winter months in comparison to summer months, although only LAD TFC was independently different between the 2 time periods. Our findings suggest a possible role of cold weather in regulation of CBF, supporting previous studies linking cold weather and increased cardiovascular mortality and morbidity. 1 –6,11,12,22 –27
Besides the above-mentioned clinical and laboratory parameters, several uncontrolled confounding factors—associated with cold weather—might also explain the influence of cold weather in winter months on cardiovascular health, although the precise mechanisms are yet to be established. Remarkable seasonal fluctuations in exercise, diet, and smoking might have a role in diverse effects of well-established cardiovascular risk factors on cardiovascular health. 28 Beyond the activation of conventional risk factors, cold exposure-induced vasoconstriction and sympathetic activation might lead to a decreased ischemic threshold, which would play a key role in development of ACS. 29 Decreased vitamin D levels in winter months might be another determinant of increased winter mortality and morbidity since decreased vitamin D levels were reported to be an independent predictor of cardiovascular mortality and morbidity. 30
Hot Weather in Summer Months
In the literature, besides the above-mentioned undesirable impact of cold weather on cardiovascular health, hot weather was also reported to have untoward effects on mortality 10 and morbidity 7 –9 mostly in hot climate countries around the world. Increased hospital admissions have been seen for acute myocardial infarction 7 and stroke, 8 besides increased systolic blood pressure in patients with chronic renal failure on hemodialysis treatment 9 during hot summer months in comparison to winter months. Despite the absence of a statistically significant difference,; relatively increased frequency of SCF in July (the hottest month in the province of the present study) in addition to January and December (the coolest months in the province of the present study) suggests that the hot weather (in our territory) would also play a role in the development of SCF as well as the cold weather. Dehydration, hemoconcentration, and possibly related sympathetic nervous system activation might be uncontrolled confounding factors linking hot weather in summer months with untoward cardiovascular effects. 31
Pressure, Humidity, and Wind Velocity
In addition to daily temperature, humidity, atmospheric pressure, and wind velocity are reported to affect cardiovascular health. Danet et al 1 detected an association of atmospheric pressure with myocardial infarction and coronary deaths in a linear V-shaped manner, with the lowest event rate at 1016 mbar whereas the ambient pressure was reported to have a significant effect on the development of myocardial infarctions in Switzerland. 12
Both increased 11 and decreased 32 humidity were reported to be associated with coronary artery disease besides reports revealing neutral findings. 33 Wind velocity was reported to be related to increased myocardial infarction admission 12 in contrast to the paradoxical inverse relationship between wind speed and winter mortality, as windy weather conditions lead to limitation of cold stress by preventing outdoor excursions. 34 Our findings might support previous reports linking humidity 11 and atmospheric pressure 1,12 with cardiovascular health as daily mean and minimum relative humidity, and daily mean atmospheric pressure were all positively correlated with log10 (mean TFC) in bivariate analysis, although none of the above-mentioned meteorological parameters were independently associated with log10 (mean TFC) in the present study.
Beyond meteorological variables, an independent association between mean TFC and systolic blood pressure and hematocrit levels supports previous literature linking CBF with systolic blood pressure and hematocrit level. 35
Limitations
Several limitations of the present study should be considered. First, a “retrospective cross-sectional” study design limits the appropriate assessment of confounding factors. Several potential confounding parameters such as physical activity, 36,37 air pollution, 38,39 passive smoking, 40 depression, stress, and so on 41 would considerably influence CBF; however, we could not have the opportunity to assess the impact of these confounding factors, mainly due to the retrospective study design. These uncontrolled confounding factors might have limited the value for regression analysis, which was performed to investigate the independent association of CBF and meteorological parameters and these uncontrolled confounding factors might also be plausible causes of the relatively amplified association of CBF and meteorological variables in the present study.
As another limitation, individual actual exposures to meteorological variables might not always be consistent with recorded meteorological data of a specific geographical region due to microenvironmental characteristics, heating/cooling conditions as well as housing and outdoor factors. Beyond the variations in individual actual exposures to meteorological variables, influence of temporality (acute vs. chronic) with regard to the impact of meteorological variables on CBF cannot be elucidated with the findings of the present study, as this study was designed as a retrospective cross-sectional study that is limited to discriminate whether SCF develops as an acute or a chronic entity and whether the meteorological variables chronically and/or acutely affect CBF.
Well-known limitations of CBF assessment also exist for this study: diagnosing normal coronary angiography relies on vessel lumen opacification on coronary angiograms, which would underestimate the presence of atherosclerotic plaque 42 ; however, performing further noninvasive/invasive tests on patients with normal coronary arteries in this regard would not be appropriate mainly due to ethical considerations. Heart rate, nitrate use, and coronary catheter size were shown to have effects on TFC 43 ; however, the catheter size was similar among study participants; heart rate was not independently different among cases with SCF and normal CBF, among winter versus summer angiography cases, and was not independently associated with mean TFC, despite significant associations on bivariate analyses. Patients using nitrate were excluded from the study, and the study groups did not differ with respect to medication use and the use of medications was not associated with mean TFC (data not shown).
As another limitation, findings of the present study, which was performed on a population from a certain geographical region (latitude: 37°16' north; longitude: 38°79' east; altitude: 550 m), might not be generalized to other populations in other territories of the world.
As a last limitation, the existence of multiple etiopathogenetic mechanisms of CBF and complex modifiers of interaction between meteorological variables and CBF should be kept in mind while interpreting the findings of the present study.
Conclusions
In conclusion, herein, we have found a significant impact of cold weather on CBF, as daily maximal temperature independently decreased in the SCF group, daily maximal temperature was independently associated with log10 (mean TFC), and LAD TFC was significantly increased during the winter months, in addition to association of log10 (mean TFC) with atmospheric pressure and relative humidity on bivariate analysis. Data of the present study suggest evaluation of the effect of more detailed meteorological variables on CBF in further large-scale studies to validate/exclude the findings of the present study.
Footnotes
Acknowledgment
We acknowledge the valuable contributions of Ramazan Sagir, the former chairperson at Sanliurfa Regional Weather Service, on behalf of Sanliurfa Regional Weather Service staff.
Declaration of Conflicting Interests
The author(s) declared no potential conflicts of interest with respect to the research, authorship, and/or publication of this article.
Funding
The author(s) received no financial support for the research, authorship, and/or publication of this article.