
Abstract
The aim of this study was to evaluate the relationship between red cell distribution width (RDW) and Global Registry of Acute Coronary Events (GRACE) risk score in patients with unstable angina pectoris (UAP) and non-ST elevation myocardial infarction (NSTEMI). We retrospectively enrolled 193 patients with UAP/NSTEMI (mean age 63.6 ± 12.6 years; men 57%) in this study. Higher RDW values were associated with increased in-hospital mortality (P = .001). There is a significant correlation between RDW and GRACE score (P < .001). In multivariate logistic regression analysis, RDW was found to be an independent predictor of high GRACE score (odds ratio: 1.513, 95% confidence interval: 1.116-2.051, P = .008). A cutoff value of >15.74 for RDW predicted high GRACE score, with a 64% sensitivity and 65% specificity. Our study results demonstrated that high RDW was an independent predictor of high GRACE score, and it is associated with in-hospital mortality in UAP/NSTEMI.
Keywords
Introduction
Despite advances in the diagnosis and treatment, coronary heart disease is yet the most common cause of death in developed countries. In this group of patients, it is important to identify high-risk patients and to determine the group of patients who will be treated immediately. Among several risk scores for predicting in-hospital mortality, the focused update of American College of Cardiology/American Heart Association guidelines 1 and the current European Society of Cardiology guidelines 2 recognize the Global Registry of Acute Coronary Events (GRACE) 3,4 and the thrombolysis in myocardial infarction 5 risk scores as the most accurate scoring systems for in-hospital death risk assessment. 6,7
Red cell distribution width (RDW), a measure of red blood cell size heterogenity, is reported as a part of the routine blood cell count. Several studies showed that high RDW values indicate poor prognosis (increased adverse events) in patients with stable angina pectoris, unstable angina pectoris (UAP)/non-ST elevation myocardial infarction (NSTEMI), and STEMI. 8 - 13 In this study, we investigated the relationship between RDW and admission GRACE risk scores in patients with UAP/NSTEMI. At the same time, we followed patients for in-hospital mortality.
Materials and Methods
Study Population
The present study is a single-center, observational study. Between September 1, 2012, and January 15, 2013, the study population consisting of 208 consecutive patients who were diagnosed as having UAP/NSTEMI were recruited from our center. We excluded patients with hematologic disorders (n = 3), cancer (n = 2), autoimmune disease (n = 1), acute or chronic infection (n = 5), and patients with UAP without a significant stenosis (at least 1 major coronary artery having >50% stenosis) or in whom coronary angiography was not performed (n = 4).
Definitions
Unstable angina pectoris/non-ST elevation myocardial infarction was defined by electrocardiographic prominent T-wave inversion or ST-segment depression and/or positive biomarkers of necrosis (eg, troponin, creatine kinase-MB [CK-MB]) in the absence of ST-segment elevation and in an appropriate clinical setting (anginal equivalent or chest discomfort). The basic drug treatment for UAP/NSTEMI included antiplatelet agents, beta-blockers, angiotensin-converting enzyme inhibitor (ACEI)/angiotensin receptor blocker (ARB), and statins. At admission, for each patient, we assessed the medical history; each patient completed a special questionnaire to obtain data on lifestyle and risk factors. Hypertension (HT) was defined as a previous use of antihypertensive medications, a systolic pressure higher than 140 mm Hg, or a diastolic pressure higher than 90 mm Hg on at least 2 separate measurements. Diabetes mellitus (DM) was defined as a previous diagnosis, if a patient followed a diet or used antidiabetic medicines or a fasting venous blood glucose level of 126 mg/dL on 2 occasions in previously untreated patients. Hypercholesterolemia was defined as total cholesterol of at least 200 mg/dL. Smoking was defined as the current regular use of cigarettes. A quantitative assessment of left ventricular systolic function was carried out using the modified Simpson method to calculate the left ventricular ejection fraction (LVEF). 14 Functional capacity was determined according to New York Heart Association classification. 15 Anemia was defined as a baseline hemoglobin concentration of less than 13 mg/dL in men and of less than 12 mg/dL in women. 16 Calculation of the GRACE risk score was performed on the basis of the age, heart rate, systolic blood pressure, creatinine value, physical examination for heart failure according to Killip classification, 17 ST-segment deviation, cardiac arrest at admission, and elevated cardiac enzymes/markers upon first arrival to the coronary care unit or to the acute medical admission units.
The GRACE risk score of in-hospital mortality, in-hospital mortality or myocardial infarction, 6-month mortality, and 6-month mortality or myocardial infarction were calculated via online calculator. 4
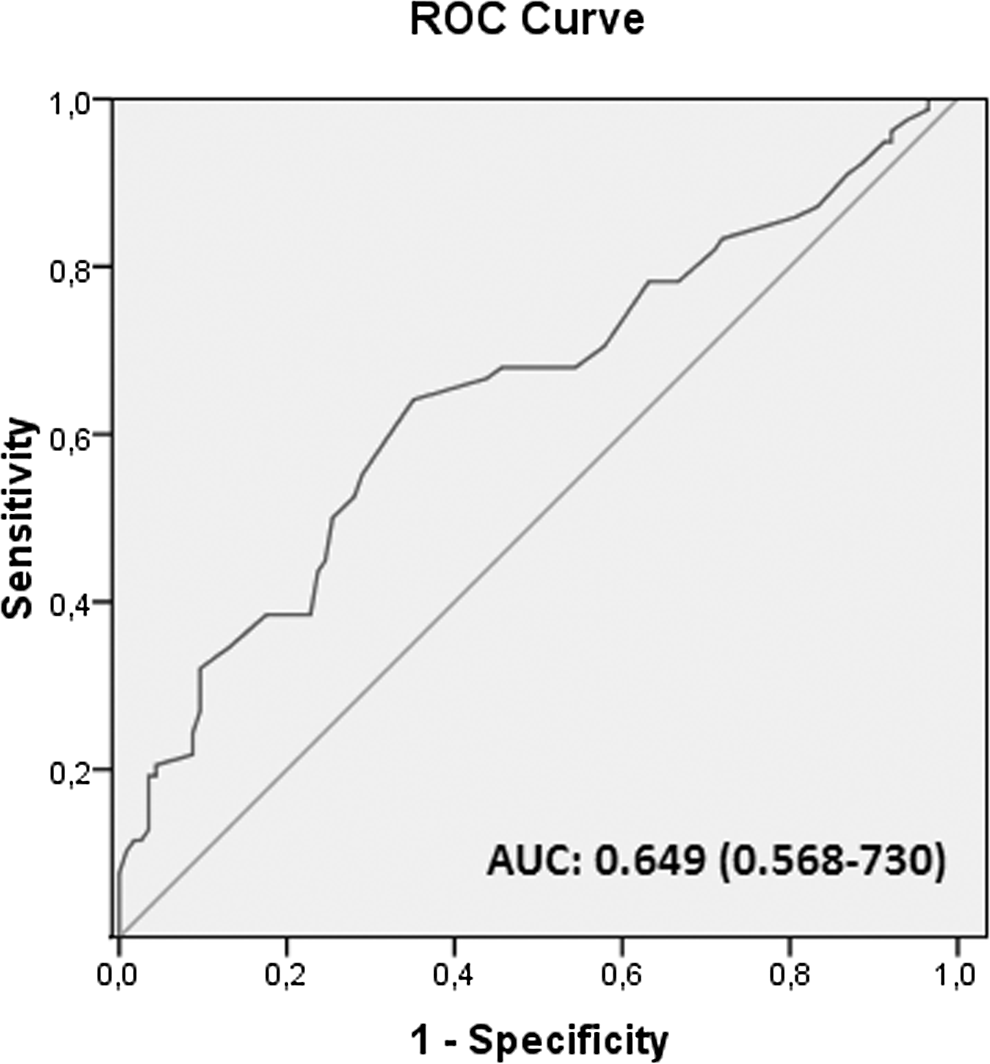
In terms of in-hospital and 6-month mortality, patients were grouped into low, medium, and high risk (≤108, 109-140, and ≥141; and ≤88, 89-117, and ≥118 points, respectively), according to the GRACE risk score.
The study population was divided into tertiles on the basis of admission RDW values. A high RDW (n = 64) was defined as a value in the third tertile (≥16.30%), and a low RDW (n = 129) was defined as a value in the lower 2 tertiles (<16.30%). The local ethics committee provided approval for the study.
Blood Collection and Assays
On admission, venous blood was obtained from all patients in the study. Hemoglobin, hematocrit, RDW values, and white blood cell counts were obtained from the automated hematology analyzer (Abbott Cell-Dyn 3700; Abbott Laboratory, Abbott Park, Illinois). Troponin I, CK-MB, and other biochemistry measurements were carried out by the biochemistry department using standard methods. Twelve-hour fasting serum levels of total cholesterol, triglyceride, and low-density and high-density lipoprotein cholesterol were measured using standard enzymatic methods.
Statistical Analysis
Continuous variables were defined as mean ± standard deviation; categorical variables were given as percentages. Distributions of continuous variables were determined with Kolmogorov-Smirnov test in each group. Between-group comparisons were done with chi-square test for categorical variables, with Student t test for continuous variables with normal distribution, and with Mann-Whitney U test for continuous variables with abnormal distribution. Correlation analysis was done with Pearson test for variables with normal distribution. One-way analysis of variance test was used to compare the 3 groups.
Multivariate logistic regression analysis was performed to assess the independent predictors of high GRACE risk score. All variables that were found significant in univariate analysis (female gender, HT, LVEF, hemoglobin, and RDW) were included in the model of logistic regression model, and the results are shown as an odds ratio (OR) with 95% confidence intervals (CIs). Receiver–operating characteristic (ROC) curve analysis was used to determine the optimum cutoff levels of RDW to predict the high GRACE risk score.
All statistical studies were carried out using the program SPSS (version 15.0; SPSS Inc, Chicago, Illinois). A P value of <.05 was considered as statistically significant.
Results
We retrospectively enrolled 193 patients with UAP/NSTEMI (mean age 63.6 ± 12.6 years; men 57%) in this study. Baseline characteristics and laboratory findings of the 2 groups are summarized in Table 1.
Baseline Characteristics and Laboratory Findings of the Study Patients.a
Abbreviations: RDW, red cell distribution width; MI, myocardial infarction; LVEF, left ventricular ejection fraction; UAP, unstable angina pectoris; NSTEMI, non-ST elevation myocardial infarction; ACEI/ARB, angiotensin-converting enzyme inhibitor/angiotensin receptor blocker; ASA, acetyl salicylic acid; SD, standard deviation.
a Values are mean ± SD or n (%).
b Student t, Mann-Whitney U, and chi-square tests.
Hematocrit levels were significantly lower in high-RDW group (P = .001). Patients with higher RDW had significantly higher levels of admission creatinine (P = .022). Other laboratory characteristics of the 2 groups were similar.
There was no difference between drug treatment of the patients, except ACEI/ARB therapy was significantly lower in high RDW group (P = .040).
Relationship Between RDW and GRACE Risk Score Groups
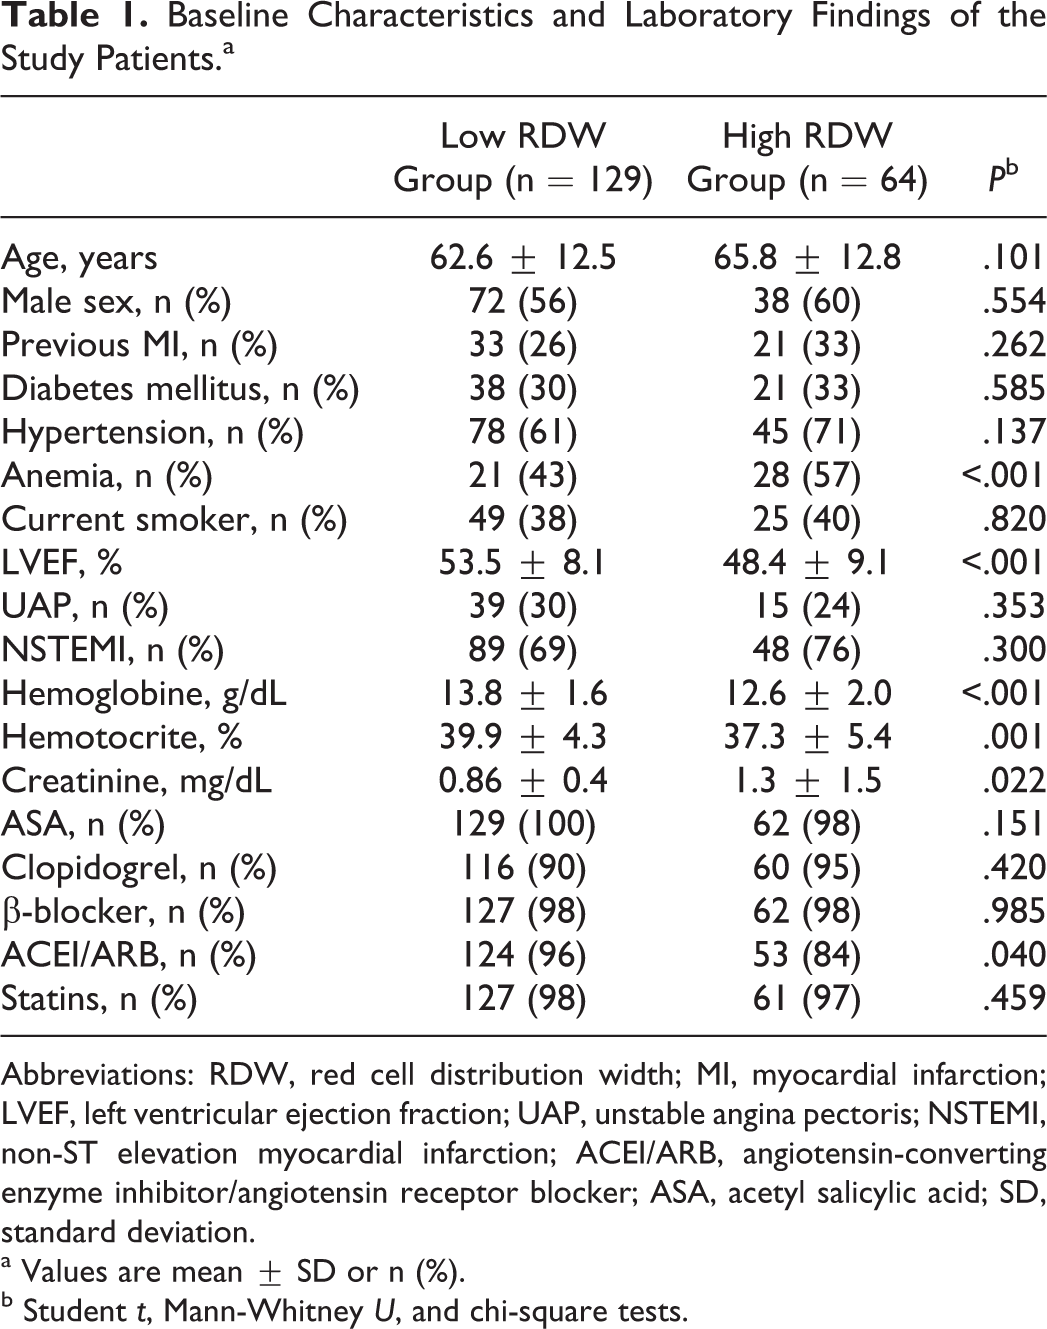
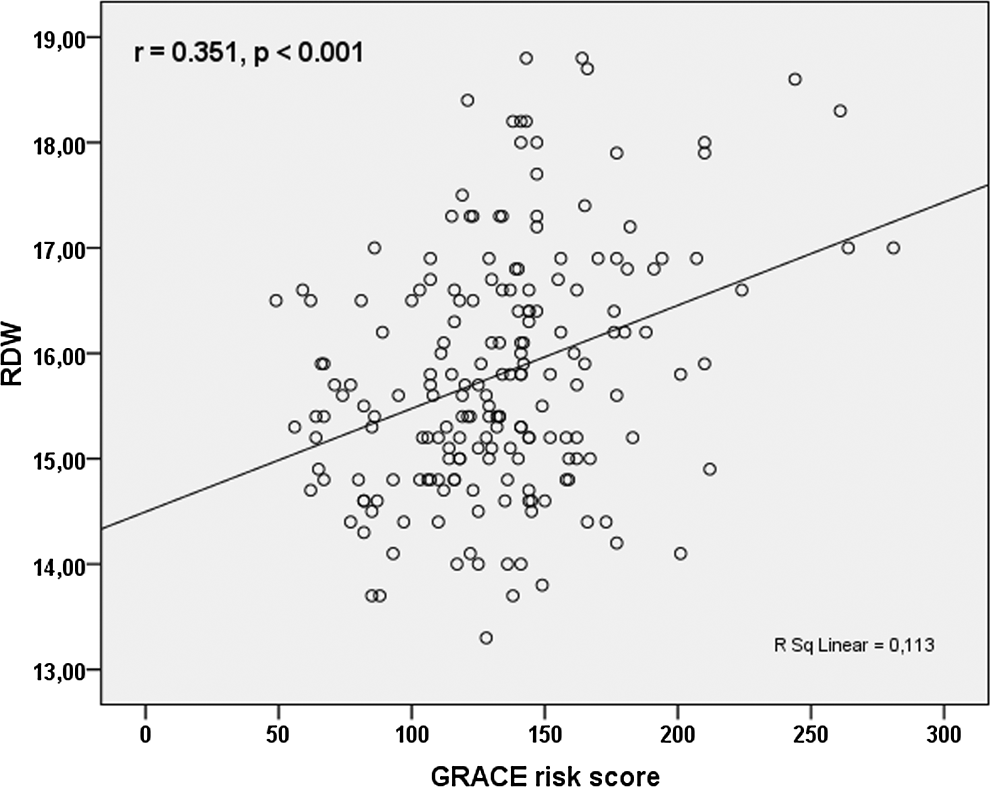
There was a positive correlation between RDW and GRACE risk scores of in-hospital death (P < .001; Figure 1), in-hospital death or myocardial infarction (MI; P < .001), discharge to 6 months death (P < .001), and discharge to 6 months death or MI (P < .001; Table 2). In ROC analysis, using a cutpoint level of 15.74, RDW identified patients with high GRACE risk group, with a sensitivity of 64% and a specificity of 65% (ROC area under curve = 0.87, 95% CI: 0.81-0.92; Figure 2).
Correlation between red cell distribution width (RDW) and the global registry of acute coronary event (GRACE) risk score.
The receiver–operating characteristic (ROC) curve analysis of red cell distribution width (RDW) for predicting high global registry of acute coronary event (GRACE) risk score.
The Relationship Between RDW, GRACE Risk Groups, and GRACE Risk Score.a
Abbreviations: RDW, red cell distribution width; GRACE; global registry of acute coronary event; MI, Myocardial infarction; SD, standard deviation.
a Values are mean + SD or n (%).
b Student t and chi-square tests.
In patients who died, the GRACE risk scores and RDW values were significantly higher. Likewise in the high GRACE risk group, patients with high in-hospital mortality and discharge to 6-month mortality had significantly high RDW values compared to patients in medium and low GRACE risk group (Figure 3, Table 2). During in-hospital follow-up, 6 patients who belonged to the high RDW and high GRACE risk groups died (P = .001 and P = .011, respectively).
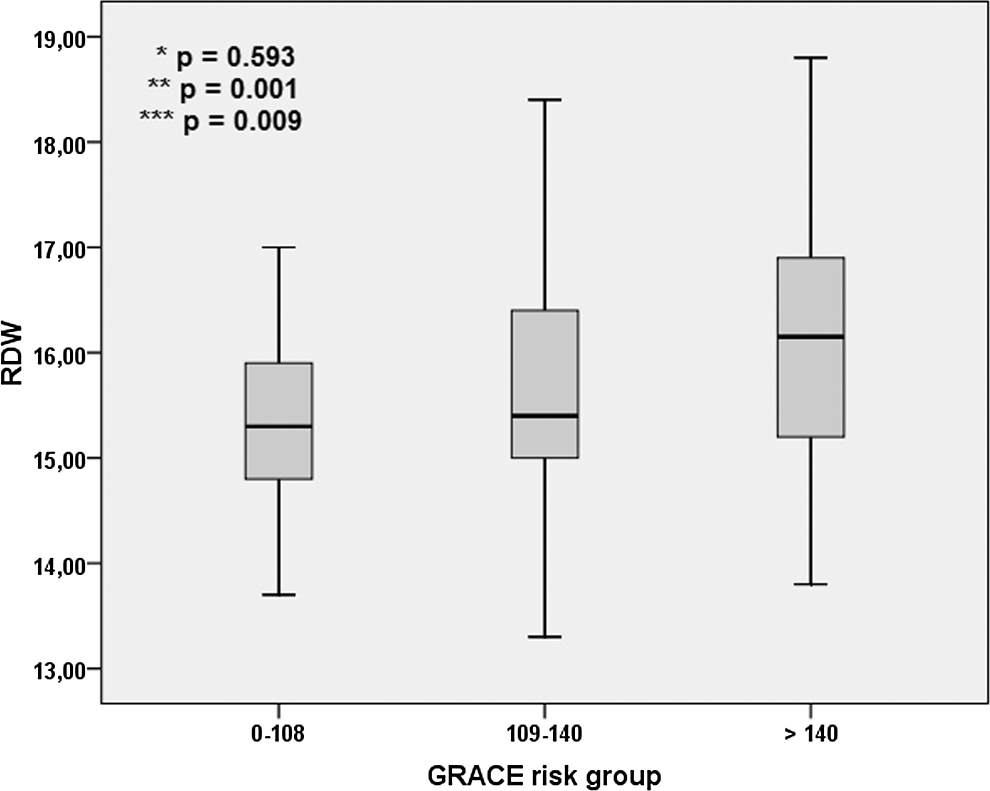
Red cell distribution width (RDW) levels among global registry of acute coronary event (GRACE) groups (P value for *low-medium, **low-high, and ***medium-high).
After multivariate analysis, high levels of RDW were independent predictor of high GRACE risk score (OR: 1.513, 95% CI: 1.116-2.051, P = .008) together with female gender (OR: 2.586, 95% CI: 1.212-5.518, P = .014) and LVEF (OR: 0.931, 95% CI: 0.895-0.969, P < .001; Table 3).
Multivariate Logistic Regression Analysis to Asses Predictors of High GRACE Risk Score.
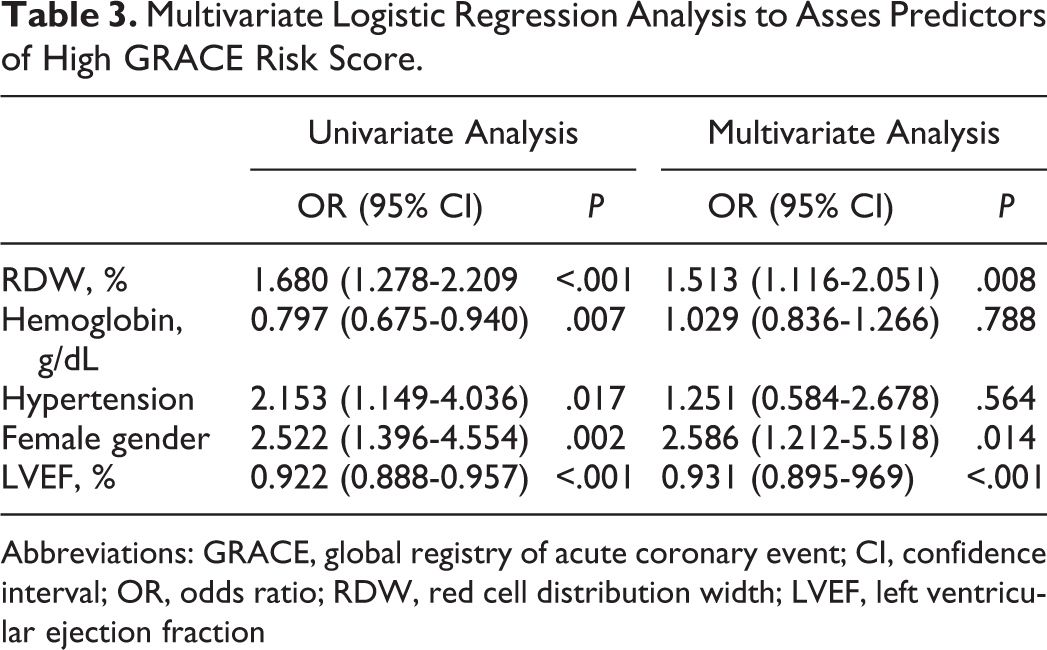
Abbreviations: GRACE, global registry of acute coronary event; CI, confidence interval; OR, odds ratio; RDW, red cell distribution width; LVEF, left ventricular ejection fraction
Discussion
Our study results demonstrated that high RDW was an independent predictor of high GRACE risk score, and there was a significant correlation between RDW and GRACE risk group in terms of in-hospital and discharge to 6-month mortality.
This situation suggests that RDW can be useful in the assessment of mortality risk in patients with acute coronary syndrome (ACS). In addition, as RDW is well correlated with the GRACE risk score, it can provide additional prognostic information in emergency outpatient clinical settings, and it may be helpful in the selection of transfer and treatment strategies.
Prognostic importance of the GRACE risk score was clearly shown in patients with ACS. It is recommended in the risk stratification by the current guidelines. 1,2 Online GRACE risk calculator is available. 4
Predictive importance of high RDW in coronary artery disease was shown in several studies. High RDW was associated with both the severity of coronary lesions 18 and the mortality 8 in patients with stable angina pectoris. In a study conducted on patients with angiographically detected coronary artery disease, including ACS, high RDW was predictive of any mortality in a 2-year follow-up. 19 In another study conducted on patients with ACS, high RDW was independent predictor of reinfarction, heart failure, and 1-month mortality. 9 High RDW was associated with thrombus burden, 20 poor reperfusion, 10 in-hospital mortality, and long-term mortality in patients with STEMI treated with primary percutaneous coronary intervention. 10 Our results were consistent with this study in terms of in-hospital death.
Moreover, high RDW has a predictive value for reinfarction, hospitalization due to heart failure, and mortality in long-term follow-up of patients with UAP/NSTEMI. 12 Tanboga et al 21 demonstrated that high RDW was an independent predictor of impaired coronary collateral circulation in patients with NSTEMI. Furthermore, in a study by Kalay et al, 22 increased RDW levels were observed in patients with slow coronary flow compared to controls.
Anemia was shown to be a powerful and independent predictor of adverse events in patients with ACS. 23 This situation suggests that predictive value of RDW in coronary artery disease might depend on anemia. However, it will be wrong to say that predictive value of RDW for major adverse events in patients with ACS is just a consequence of anemia. Dabbah et al 13 showed that the predictive value of RDW in patients with ACS was independent of anemia, and increased RDW during hospitalization was associated with poor prognosis. This situation suggests that RDW has a dynamic process. In a study of Cavusoglu et al, 19 the predictive value of increased RDW was shown in both patients with and without anemia. So, predictive value of RDW in coronary heart disease cannot be explained by anemia.
The RDW is a readily available parameter of complete blood count analysis. The term anisocytosis is used for increased RDW values and denotes increased diversity of red cell volume. Iron, vitamin B12, and folic acid deficiency may cause increased RDW values. The mechanism by which elevated values of RDW are associated with adverse outcomes in patient with coronary artery disease is unknown. Underlying factors of increased RDW in heart failure include hemolysis, malnutrition, inflammation, renal insufficiency, and ineffective erythropoesis. 24 In addition, neurohormonal activation seems to be associated with increased erythropoesis, thus increasing the RDW values. 25 This is also a valid mechanism for patients with ACS. Also, plasma levels of erythropoietin increase in acute MI, independent of the hemoglobin values. 26 However, there is no doubt that there should be new studies in this issue.
In fact, high RDW is an expected situation in patients with ACS with high GRACE risk score because of the relationship between several components of the GRACE risk score and RDW. Both RDW and GRACE risk scores increase with age. 27 Similarly, the elevated creatinine, 28 which is a parameter used in GRACE risk calculation, is also correlated well with the increase in RDW values.
Study Limitations
This study represented a single-center study conducted on a relatively small number of patients. The inflammatory factors, malnutrition, and natriuretic peptides, which may be associated with increased RDW values, could not be assessed simultaneously. Elevated RDW levels are observed in many clinical settings such as hemolysis and in the setting of ineffective red cell production such as that of iron, vitamin B12, or folate deficiency. Only hemoglobin levels were measured in this study, and other factors including iron, vitamin B12, and folate were not measured.
Conclusion
As a result, RDW is positively correlated with GRACE risk score in patients with UAP/NSTEMI, and high RDW is independent predictor of high GRACE risk score. In addition to the GRACE risk score, RDW can be used as an useful parameter for predicting in-hospital mortality and as a marker for risk stratification in patients with UAP/NSTEMI.
Footnotes
Declaration of Conflicting Interests
The author(s) declared no potential conflicts of interest with respect to the research, authorship, and/or publication of this article.
Funding
The author(s) received no financial support for the research, authorship, and/or publication of this article.