
Abstract
Purpose: The aim of this study is to investigate the relationship between the criteria comprising metabolic syndrome (MS) and neutrophil–lymphocyte ratio (NLR), a simple and reliable indicator of inflammation. Method: Seventy patients with MS and 71 age- and sex-matched control participants were included. Patients were classified into 3 groups based on the number of MS criteria: group 1 (with 3 criteria), group 2 (with 4 criteria), and group 3 (with 5 criteria). The NLR was calculated from complete blood count. Results: Patients with MS had significantly higher NLR compared to the control group. Moreover, the group 3 patients had higher NLR than those in groups 2 and 1 (P = .008 and P = .078, respectively), whereas there was no difference between the patients meeting 3 and 4 MS criteria (P = .320). Besides, NLR increased as the severity of MS increased (r = .586, P < .001). The cutoff level for NLR with optimal sensitivity and specificity was calculated as 1.84. Serum glucose and high-sensitive C-reactive protein level were found to be independent predictors of an NLR value greater than 1.84. Conclusion: The present study indicated a significant correlation between the criteria of MS and inflammation on the basis of NLR. Furthermore, there an increase in NLR as the severity of MS increases.
Introduction
Metabolic syndrome (MS) is a clinical entity comprising risk factors such as glucose intolerance, atherogenic lipid profile, hypertension, abdominal obesity, lack of physical activity, and increased inflammatory state, 1 each of which was shown to be associated with the development of cardiovascular diseases (CVDs) and type 2 diabetes. 2,3
Most of the recent studies showed that there was a correlation between inflammatory mediators and components of MS. Particularly, interleukin 6 (IL-6), tumor necrosis factor-α (TNF-α), and C-reactive protein (CRP) levels were observed to increase in MS. 4 Another study, in which the patients were grouped according to the number of factors leading to MS, found that plasma level of CRP increased both as the number of factors increased and as the prevalence of cardiovascular events increased. 5 Elevated levels of inflammatory mediators in the circulation have been associated with the development of CVD. 6 Leukocyte activation occurs during an inflammatory reaction. Leukocytes were detected to have a role in atherogenesis and thrombus formation. Along with high number of leukocytes, there is a significant relationship between neutrophil–lymphocyte ratio (NLR) and severity and prognosis of CVD. 7
The aim of the present study was to investigate the relationship between the criteria comprising the MS and NLR, a simple and reliable indicator of inflammation.
Patients and Methods
Included in the study were 70 patients who presented to the cardiology outpatient clinic from February 1, 2012, to May 1, 2012, and who had a diagnosis of MS, and 71 age- and sex-matched controls. Patients with secondary hypertension, renal failure, hepatic failure, and/or manifest heart disease, such as cardiac failure, coronary arterial disease, arrhythmia, and cardiac valve disease, were excluded. Similarly, patients with infection, acute stress, chronic systemic inflammatory disease, and those who had been receiving medications affecting the number of leukocytes were excluded, as well. All the participants included in the study were informed about the study, and their oral and written consents on participating voluntarily were obtained.
Metabolic syndrome was diagnosed according to the National Cholesterol Education Program Adult Treatment Panel III criteria 3 (NCEP ATP 3).
3
Those criteria require the presence of 3 or more of the following: abdominal obesity (waist circumference [WC] >102 cm in men and >88 cm in women); a high triglyceride (TG) level ≥1.7 mmol/L (≥150 mg/dL); a low high-density lipoprotein (HDL) cholesterol level <1.0 mmol/L for men, and <1.3 mmol/L for women (<40 mg/dL for men and <5 mg/dL for women); a high blood pressure (BP; systolic, ≥130 mm Hg; and/or diastolic, ≥85 mm Hg); and a high fasting blood glucose (FBG) concentration ≥5.6 mmol/L (≥110 mg/dL).
Patients were classified into 3 groups based on the number of MS criteria: group 1 (patients with 3 MS criteria), group 2 (patients with 4 MS criteria), and group 3 (patients with 5 MS criteria).
Height, weight, and WC were measured while fasting and standing up with standard measuring tools. The narrowest diameter between costal arch and anterior superior iliac spine was measured for WC. Body mass index (BMI) (kg/m2) and body surface area ([BSA] m2) were calculated using the formulas “weight (kg)/height (m) 2 ” and “BSA (m2) = 0.007184 × height (cm)0.725 × weight (kg)0.425,” respectively. The BP was measured after at least a 10-minute rest in sitting position. The mean of all 3 measurements with a 2-minute interval was considered as BP. Plasma glucose, urea, creatinine, total cholesterol, TG, HDL, LDL levels, and high-sensitive C-reactive protein (hs-CRP) were measured in the venous blood samples obtained in the morning after an 8-hour fasting. Complete blood count was studied in our hematology unit with Beckman-Coulter Gen-S system device (Beckman-Coulter Inc., USA).
Statistical Analysis
Continuous variables were defined as mean ± standard deviation, and categorical variables were given as percentages. Independent sample t test or Mann-Whitney U test were used for continuous variables, and chi-square test for categorical variables. One-way analysis of variance (ANOVA) or Kruskal-Wallis tests were used to compare more than 2 groups. Correlations were assessed using Spearman test. Receiver–operating characteristic (ROC) curve analysis was used to determine the optimum cutoff level of NLR to predict the MS. Uni- and multivariate logistic regression analyses were performed to detect the independent predictors of high NLR values. The parameters found to be significant (P < .10) in the univariate analysis were evaluated by stepwise logistic regression analysis. Ninety-five percent confidence interval and odds ratios (OR) were presented together. Statistical analyses were performed using Statistical Package for Social Sciences (SPSS) Version 15.0 (SPSS Inc, Chicago, Illinois). A P value <.05 was considered as statistically significant.
Results
Totally, 70 patients with MS and 71 age- and sex-matched participants were included in the study as patient and control groups, respectively. Clinical and biochemical characteristics of both groups are summarized in Table 1. As shown in Table 2, while the numbers of white blood cells (WBCs), neutrophils, and lymphocytes in the patients with MS were higher than those without MS, platelet counts and hemoglobin levels were comparable. Besides, hs-CRP in the patients with MS was significantly higher than the control group (1.15 ± 0.52 vs 0.64 ± 0.34, P < .001). Patients with MS had significantly higher NLR compared to those without MS. Furthermore, NLR increased more as severity of MS increased (Figure 1). A strong positive correlation was revealed between the severity of MS and NLR (r = .586, P < .001) and between the severity of MS and hs-CRP (r = .622, P < .001; Figures 2 and 3). In addition, the correlation analysis revealed a positive correlation between hs-CRP and NLR in the patient population (r = .388, P < .001). In participants without MS, NLR was detected to be significantly lower compared to those with MS meeting 3, 4, and 5 criteria (1.89 ± 0.72 vs 2.70 ± 0.90, 2.91 ± 0.70, and 3.34 ± 0.78, respectively, P < .001). Moreover, patients meeting 5 MS criteria had higher NLR than those meeting 3 and 4 criteria (P = .008 and .078, respectively), whereas there was no difference between the patients meeting 3 and 4 MS criteria (P .320; Figure 4).
Differences Between Clinical and Laboratory Parameters of the Groups With and Without Metabolic Syndrome.
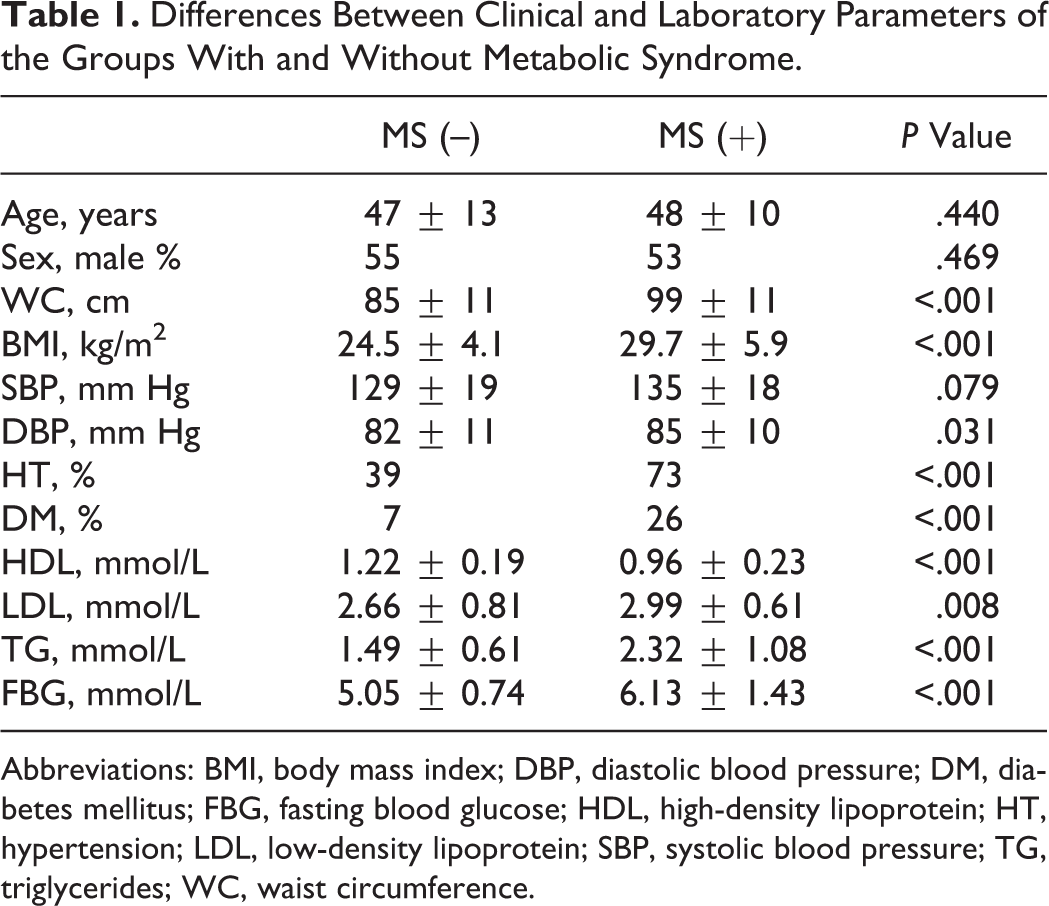
Abbreviations: BMI, body mass index; DBP, diastolic blood pressure; DM, diabetes mellitus; FBG, fasting blood glucose; HDL, high-density lipoprotein; HT, hypertension; LDL, low-density lipoprotein; SBP, systolic blood pressure; TG, triglycerides; WC, waist circumference.
Differences Between the Hematologic Parameters of the Groups With and Without Metabolic Syndrome.
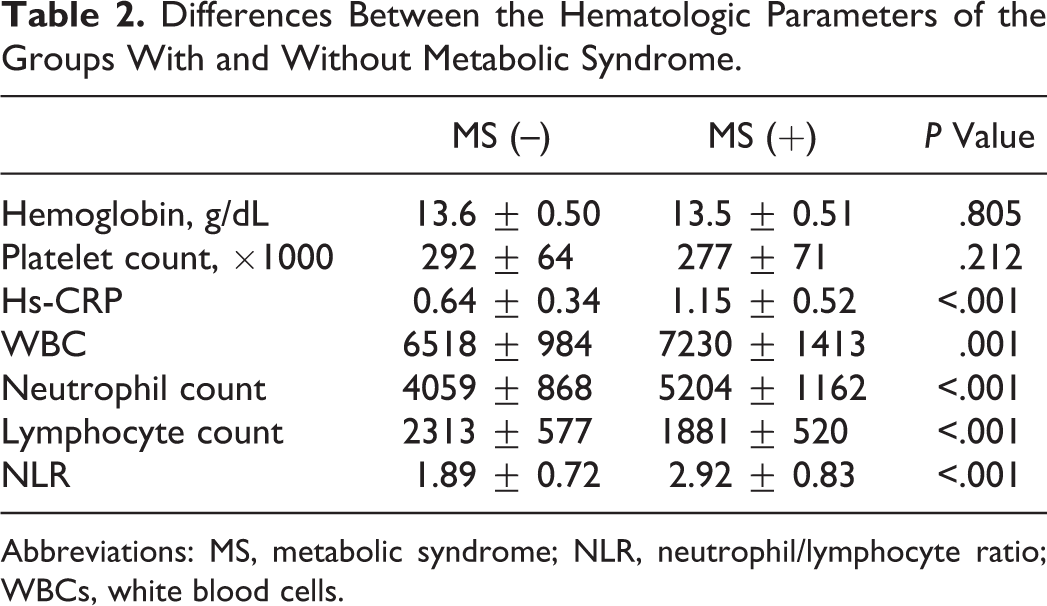
Abbreviations: MS, metabolic syndrome; NLR, neutrophil/lymphocyte ratio; WBCs, white blood cells.
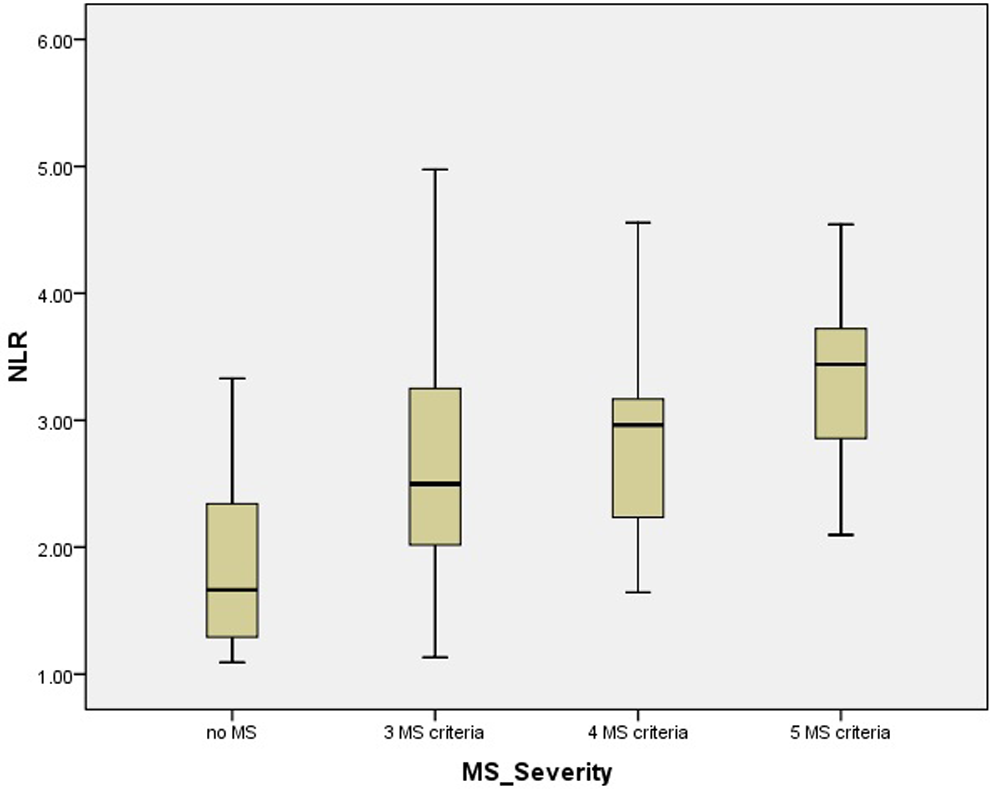
Neutrophil/lymphocyte ratio according to the severity of metabolic syndrome. MS indicates metabolic syndrome; NLR, neutrophil/lymphocyte ratio.
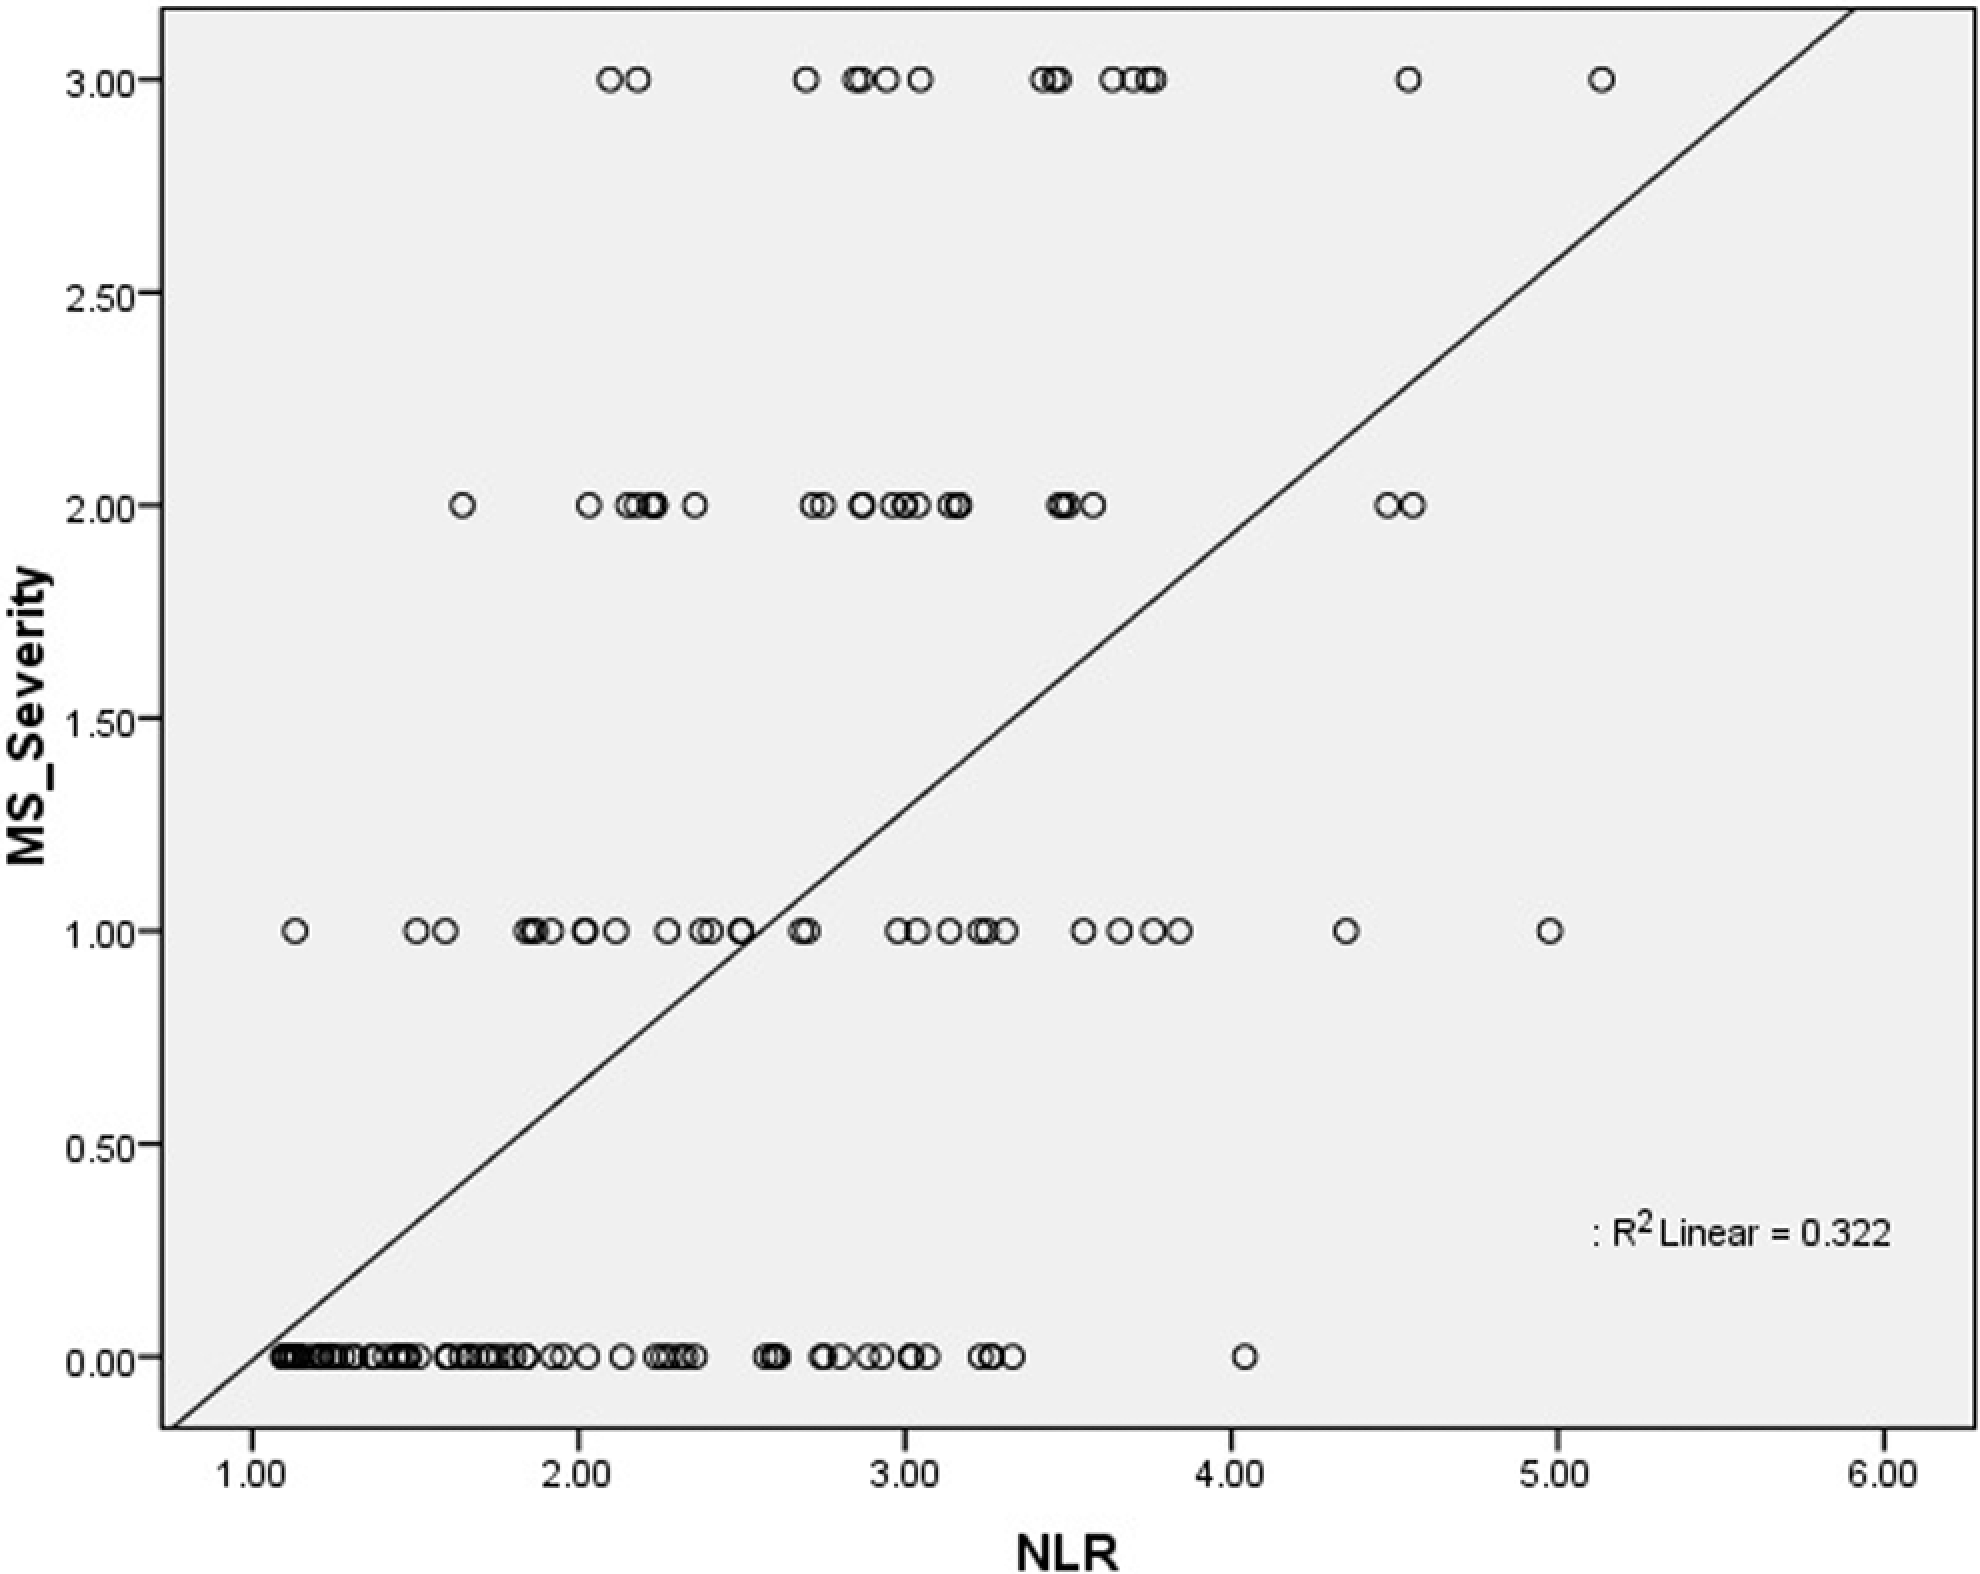
Correlation analysis between neutrophil/lymphocyte ratio and metabolic syndrome. MS indicates metabolic syndrome; NLR, neutrophil/lymphocyte ratio.
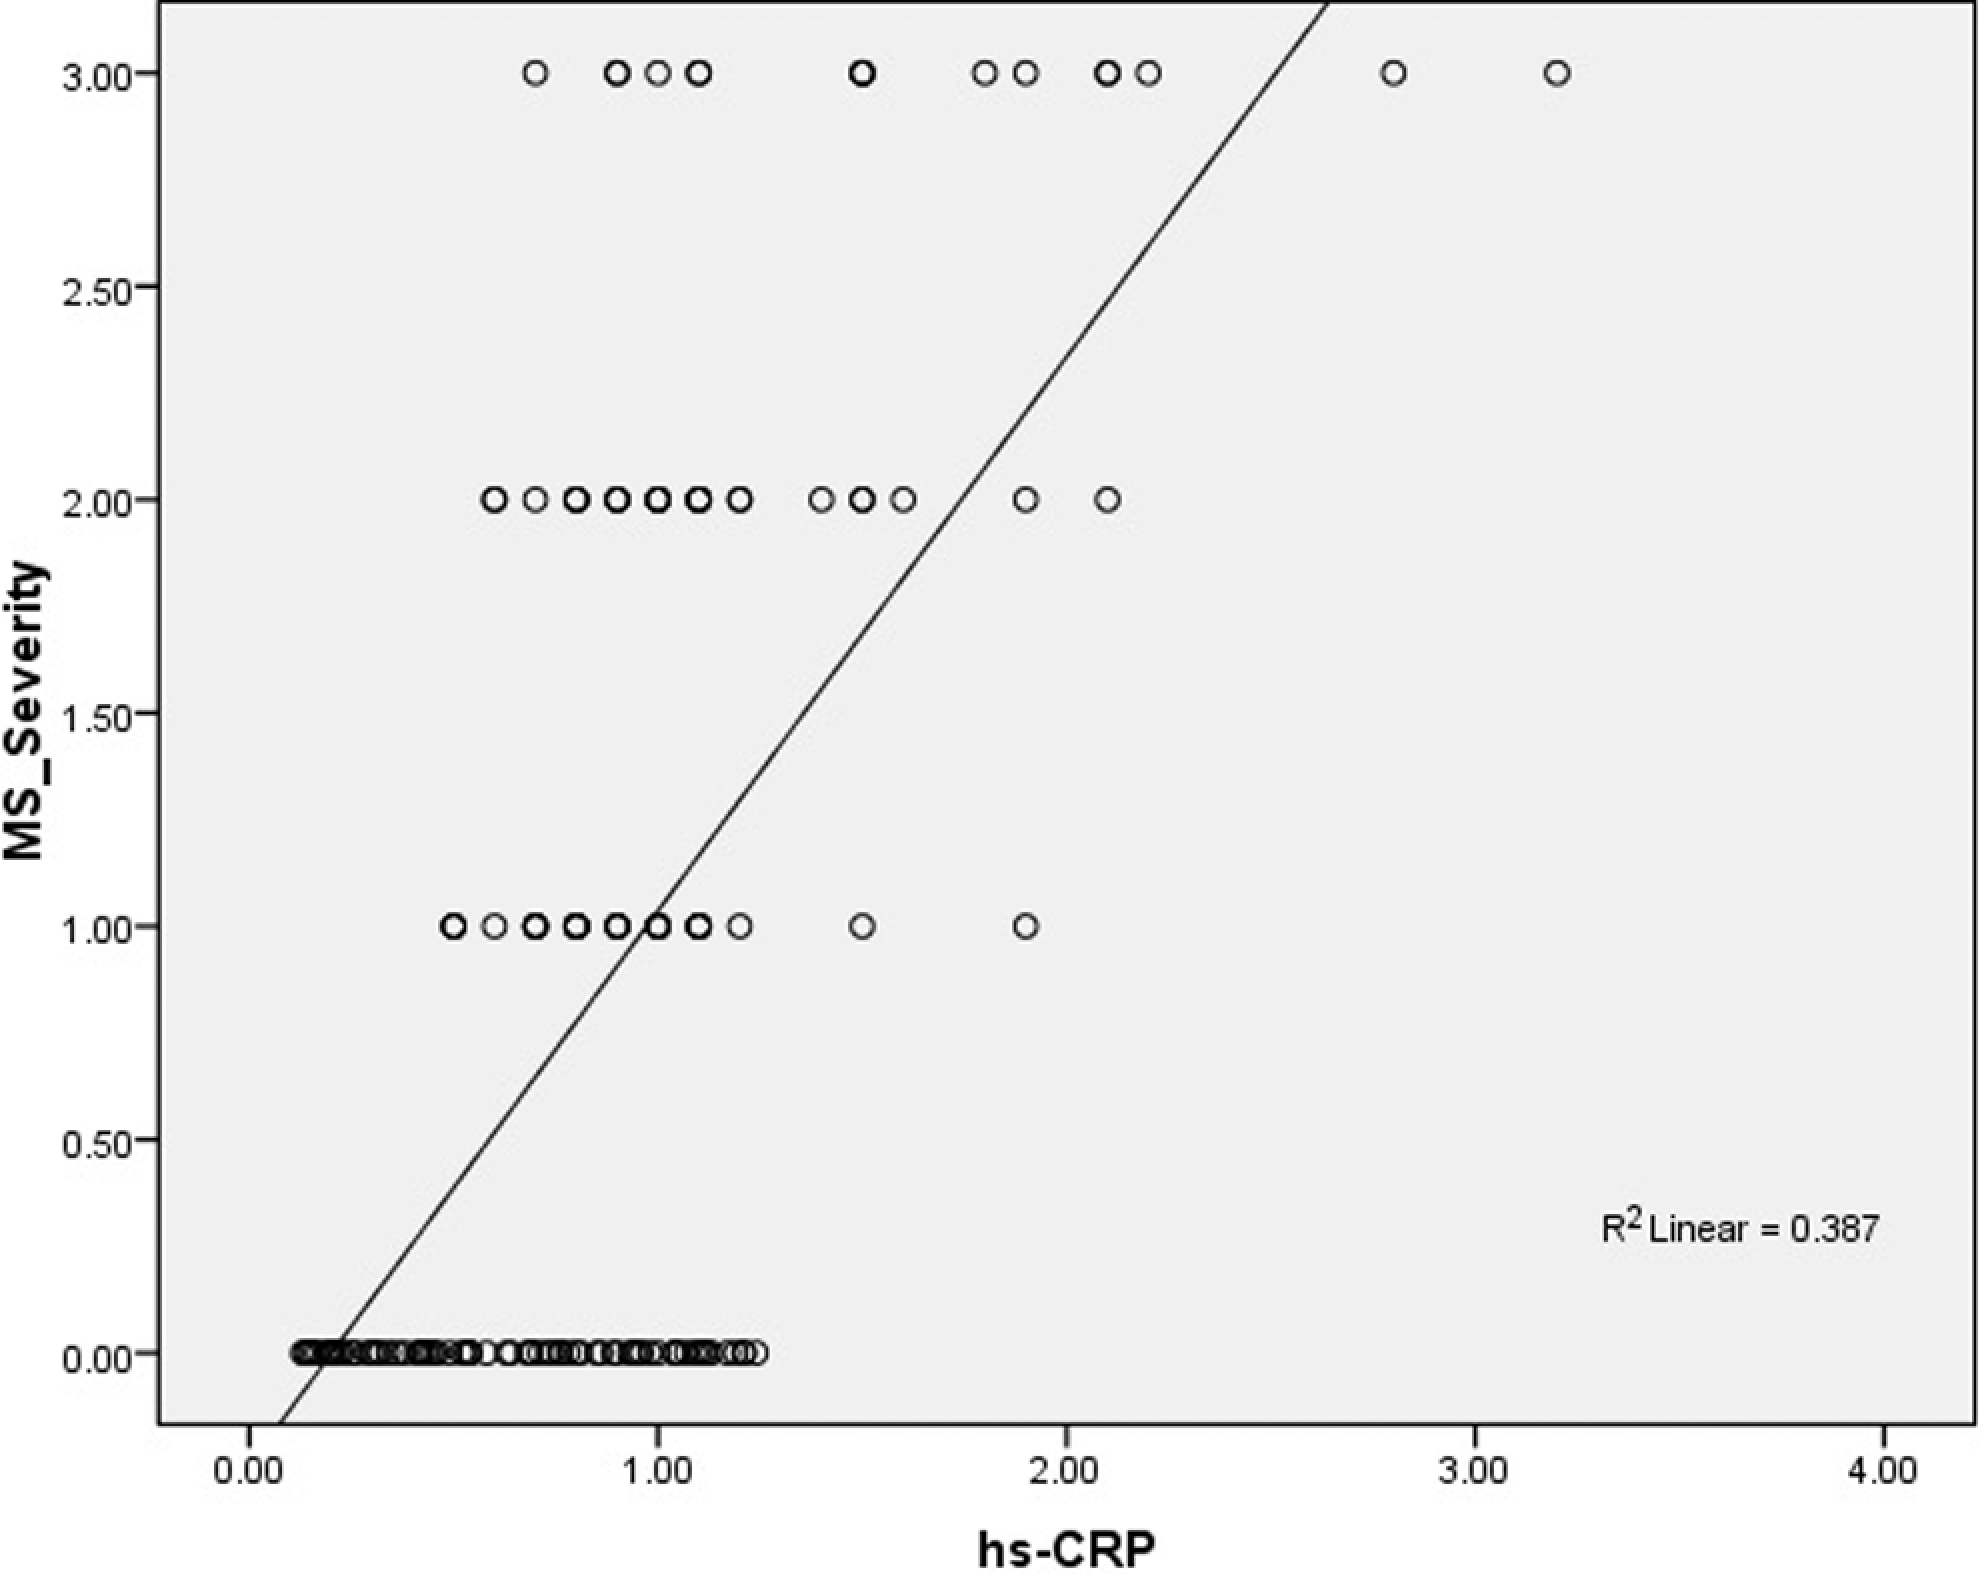
Correlation analysis between the severity of metabolic syndrome and hs-CRP. hs-CRP indicates high-sensitive C-reactive protein.
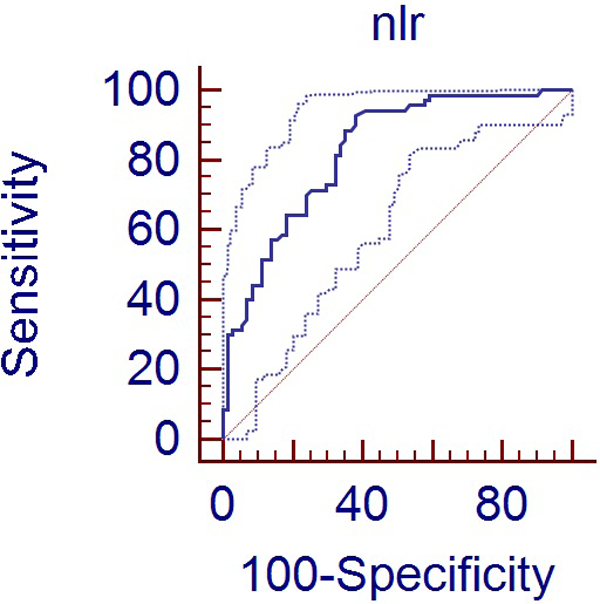
Receiver–operating characteristic curve analysis for diagnostic sensitivity, specificity, positive predictive value, and negative predictive value of neutrophil/lymphocyte ratio in predicting metabolic syndrome. NLR indicates neutrophil/lymphocyte ratio.
In order to specify the level of NLR to predict MS, ROC curve analysis was performed. The cutoff level for NLR with optimal sensitivity and specificity was calculated as 1.84 (area under curve [AUC] = 0.825 [0.753-0.884], P < .001). For that level, sensitivity was 92.8% (84.1%-97.6%) and specificity was 61.9% (49.7%-73.2%), positive predictive value (PPV) was 70.7 (60.2-79.7), and negative predictive value (NPV) was 89.8 (77.6-98.7; Figure 3).
When 1.84 was chosen as the cutoff value for the NLR, when compared with the patients with NLR < 1.84, the patients with NLR > 1.84 had higher hs-CRP levels (1.03 ± 0.53 vs 0.63 ± 0.32, P < .001), lower HDL-C levels (1.06 ± 0.26 vs 1.16 ± 0.21, P = .014), higher WC (95 ± 13 vs 86 ± 10, P < .001), higher BMIs, (28.2 ± 6.1 vs 24.9 ± 4.2, P = .001), higher serum TGs (2.07 ± 1.04 vs 1.58 ± 0.72, P = .004), and higher serum glucose (5.84 ± 1.38 vs 5.11 ± 0.80, P = .001). Besides, there were more hypertensive patients in the NLR > 1.84 group (63% vs 42%, P = .022). The parameters found to be significant (P < .10) in the univariate analysis were evaluated by stepwise logistic regression analysis and only hs-CRP (OR: 8.01, 95% CI 2.24-28.6, P = .001) and glucose levels (OR: 1.77, 95% CI 1.02-3.07, P = .040) were found to be independent predictors of NLR > 1.84.
Discussion
The present study indicated, for the first time, a significant correlation between the criteria of MS and inflammation on the basis of NLR, a simple and reliable indicator of inflammation. Furthermore, the correlation between the increases in the number of MS criteria along with the increase in the NLR has been reported, for the first time, to our knowledge.
Metabolic syndrome consists of multiple and interrelated risk factors of metabolic origin that appear to directly promote the development of atherosclerosis. The metabolic risk factors consist of atherogenic dyslipidemia (elevated TGs, low HDL cholesterol concentrations), elevated BP, elevated plasma glucose, prothrombotic state, and inflammatory state. 8 Although both the hereditary and environmental factors contribute to the development of MS, little is known about the underlying pathogenic mechanisms. All the components comprising MS were demonstrated to be associated with systemic inflammation. 9 Instead of BMI, WC measurement is used as the indicator of visceral adiposity. The WC measurement was shown to be a good determinant in determining the development of CVD. 10 The proinflammatory cytokines, such as IL-6 4,11 and TNF-α, 12 which are produced in substantial amounts in human adipose tissue, have been attributed a central role. C-reactive protein level has correlation with MS components, such as abdominal obesity, increased TGs, decreased HDL, and blood glucose. It was found that CRP level increased as the number of MS components increased. Higher CRP level in patients with more MS components was found to be correlated with more cardiovascular events. 5 It has been suggested that the situation reflected an existing subclinical inflammation, and the process was progressively responsible for the development of diabetes mellitus and atherosclerosis. 13
Moreover, inflammation has been recently identified as an independent risk factor for CVD and is associated with atherosclerosis. 14 Previous studies have shown that progression of coronary atherosclerosis is associated with increased cardiovascular events. 15 The prevention of atherosclerotic progression has prognostic as well as diagnostic importance. As inflammation and leukocyte subtypes have effect on every stage of atherosclerosis, it is important to be able to easily study parameters that can demonstrate the progression of atheromatous plaque. Previous studies showed that WBC, leukocyte subtype, and NLR were indicators of systemic inflammation. 16 Number of neutrophils is considered to be associated with the formation, complexity, and activation of atheromatous plaque. 17 Consistent with the literature, the present study showed that the number of neutrophils increased in MS; moreover, the number of neutrophils increased as the severity of MS increased. The variation in the increased rate of number of lymphocytes was insignificant between the MS participants and those without MS. This was considered to be consistent with more increase in the number of neutrophils compared to that of lymphocytes and hence increase in NLR in the conditions associated with inflammation. In a previous study, NLR was shown to be a predictor in the progression of atherosclerosis. 18 The study by Horne and the colleagues found a significant association among the severity and prognosis of CVD, high WBC, and NLR. 7 The present study showed that NLR was strongly correlated with the number of parameters forming MS.
Previous studies showed that there was a correlation between the numbers of WBC, neutrophils, lymphocytes, monocytes, and eosinophils and MS 19 ; however, associations between NLR and MS are yet to be investigated. The NLR, a promising marker of inflammation starting to find a place in the literature, was found to be correlated with the presence and the severity MS.
Conclusion
It is known that MS is associated with systemic inflammation and in patients with MS, the risk for development of CVD increases. The present study is the first report about the association of NLR with the presence and the severity of MS. The results may have clinical importance, because the parameters indicating inflammation in MS may be the early markers of developing cardiovascular events.
Limitations
The most important limitation of the present study was the number of the patients included. Moreover, while assessing the association between the number of MS components and NLR, each MS component was considered to exert the same effect. Assessing the differences between MS components on the basis of subgroup analysis would be more useful to reveal the individual effect of each MS component; however, as mentioned above, the number of the patients was inadequate to perform such subgroup analysis.
Footnotes
Declaration of Conflicting Interests
The authors declared no potential conflicts of interest with respect to the research, authorship, and/or publication of this article.
Funding
The authors received no financial support for the research, authorship, and/or publication of this article.