
Abstract
Chronic kidney disease (CKD) has reached epidemic levels. It is a multisystem disease associated with elevated systemic inflammatory and hypercoagulable states. Most concerning are the cardiovascular risks associated with all stages of kidney disease. It is difficult to assess kidney disease stage progression and cardiovascular risk with current indicators such as estimated glomerular filtration rate and conventional cardiovascular risk factors. However, the use of biomarkers to assess the underlying pathological disease state may bridge the gap. This study evaluated biomarkers of inflammation including C-reactive protein,
Introduction
Over 26 million Americans currently have chronic kidney disease (CKD) and it is estimated that another 20 million Americans are at risk. 1 Chronic kidney disease encompasses different stages of kidney disease defined by the estimated glomerular filtration rate (eGFR). Stage 1 CKD is defined as persistent albuminuria with an eGFR >90 mL/min per 1.73 m2, while an eGFR of 60 to 89, 30 to 59, 15 to 29, and <15 mL/min per 1.73 m2 define CKD stages 2, 3, 4, and 5, respectively. 2 The progression into end-stage renal disease (ESRD) is defined by an eGFR <15 mL/min per 1.73 m2 with renal replacement therapy or dialysis treatment for survival. Approximately 550 000 patients currently have ESRD and it is estimated that another 200 000 will develop ESRD within the next 10 years. 3
Recently, there has been great focus on the devastating cardiovascular implications of a patient with kidney disease. Patients with kidney disease have complications ranging from acute coronary syndrome, cerebrovascular events, and peripheral artery disease to deep venous thrombosis and pulmonary embolisms.4–6 Additionally, a patient with CKD is more likely to die (most commonly due to a cardiovascular event) than to progress to dialysis 7 and a 30-year-old patient with ESRD has a similar risk of death as an 85-year-old individual without CKD.7,8 Cardiovascular disease (CVD) mortality is 10 times higher in ESRD than the general population, with 50% of the mortality of ESRD associated with CVD.8,9
Alarmingly, patients with kidney disease have disproportionately high rates of CVD even after adjustments for age, sex, race, diabetes, and dialysis. 10 Additionally, the traditional cardiovascular risk factors such as predialysis blood pressure and total serum cholesterol cannot fully explain the cardiovascular risk in this population. 6 In fact, patients with CKD with systolic blood pressures of 160 to 179 mm Hg were found to have the lowest mortality rates, developing a U-shaped risk curve compared to the general population. 11 A U-shaped curve was also demonstrated between mortality risk and cholesterol in CKD compared to the general population. 12 In addition, proteinuria, hypertension, hyperlipidemia, and inflammation seen in kidney disease are significant modifiable risk factors but do not completely explain renal outcomes in CKD. 13 Although, in general, worsening kidney function correlates with worse and more frequent cardiovascular events, the progression through the stages of CKD and into ESRD is unpredictable and eGFR alone does not linearly represent CVD risk. 14
The unpredictability of kidney disease stage progression and CVD risk poses many challenges for proper risk stratification and ultimately appropriate treatment in kidney disease. Therefore, earlier and more sensitive indicators of CKD progression and cardiovascular risk must be established. At the head of the pack is the potential use of biomarkers in this population. Several studies have focused on profiling biomarkers in the kidney disease population,15
–18 however, few studies have examined how biomarkers can be used clinically to assess CVD risk in kidney disease. The current study profiles additional biomarkers in order to investigate their potential in evaluating kidney disease stage and risk of CVD in CKD and ESRD. This study specifically evaluates the biomarkers C-reactive protein (CRP),
Materials and Methods
Forty-six patients with documented CKD (stages 2-4 calculated by Modification of Diet in Renal Disease-II formula and staged by National Kidney Foundation Disease Outcomes Quality Initiative) without the history of dialysis from Brigham and Women’s Hospital were recruited. One hundred and four patients with ESRD on at least 3 months of maintenance hemodialysis at the Loyola University outpatient dialysis unit were also included. Additionally, 79 age-matched healthy controls with no history of kidney disease were recruited. Study criteria included patients over the age of 18 years and able to provide consent. Patients with an active infection, hospitalization at the time of blood draw, life expectancy of less than 6 months, and those on immunosuppressive treatment were excluded from the study. The institutional review board at Loyola University Medical Center approved the study protocol.
Blood samples were collected immediately prior to each patient’s dialysis session by venous blood draw. Samples were centrifuged within 2 hours of collection at 3000 rpm for 15 minutes. Plasma from the samples were aliquoted and frozen at −70°C. These frozen citrated plasma samples were then thawed and retrospectively analyzed using the Randox Evidence Investigator (Antrim, United Kingdom), a device which measures multiple proteins simultaneously on a microarray panel using chemiluminescence technology. All samples were spotted on the Randox Cerebral II biochip microarray which assesses the concentration of CRP,
Results
Table 1 contains the mean, standard error of the mean, and 95% confidence interval for each marker assayed in control, CKD, and ESRD groups. All the markers tested demonstrated an upregulation in mean concentration from control to CKD to ESRD. Additionally, there was a statistically significant difference in mean concentration between control versus CKD, control versus ESRD, and CKD versus ESRD for all biomarkers tested with P < .001 evaluated by post hoc Tukey Multiple comparison test.
Inflammatory Markers Expressed as Mean ± SEM and 95% CI.a
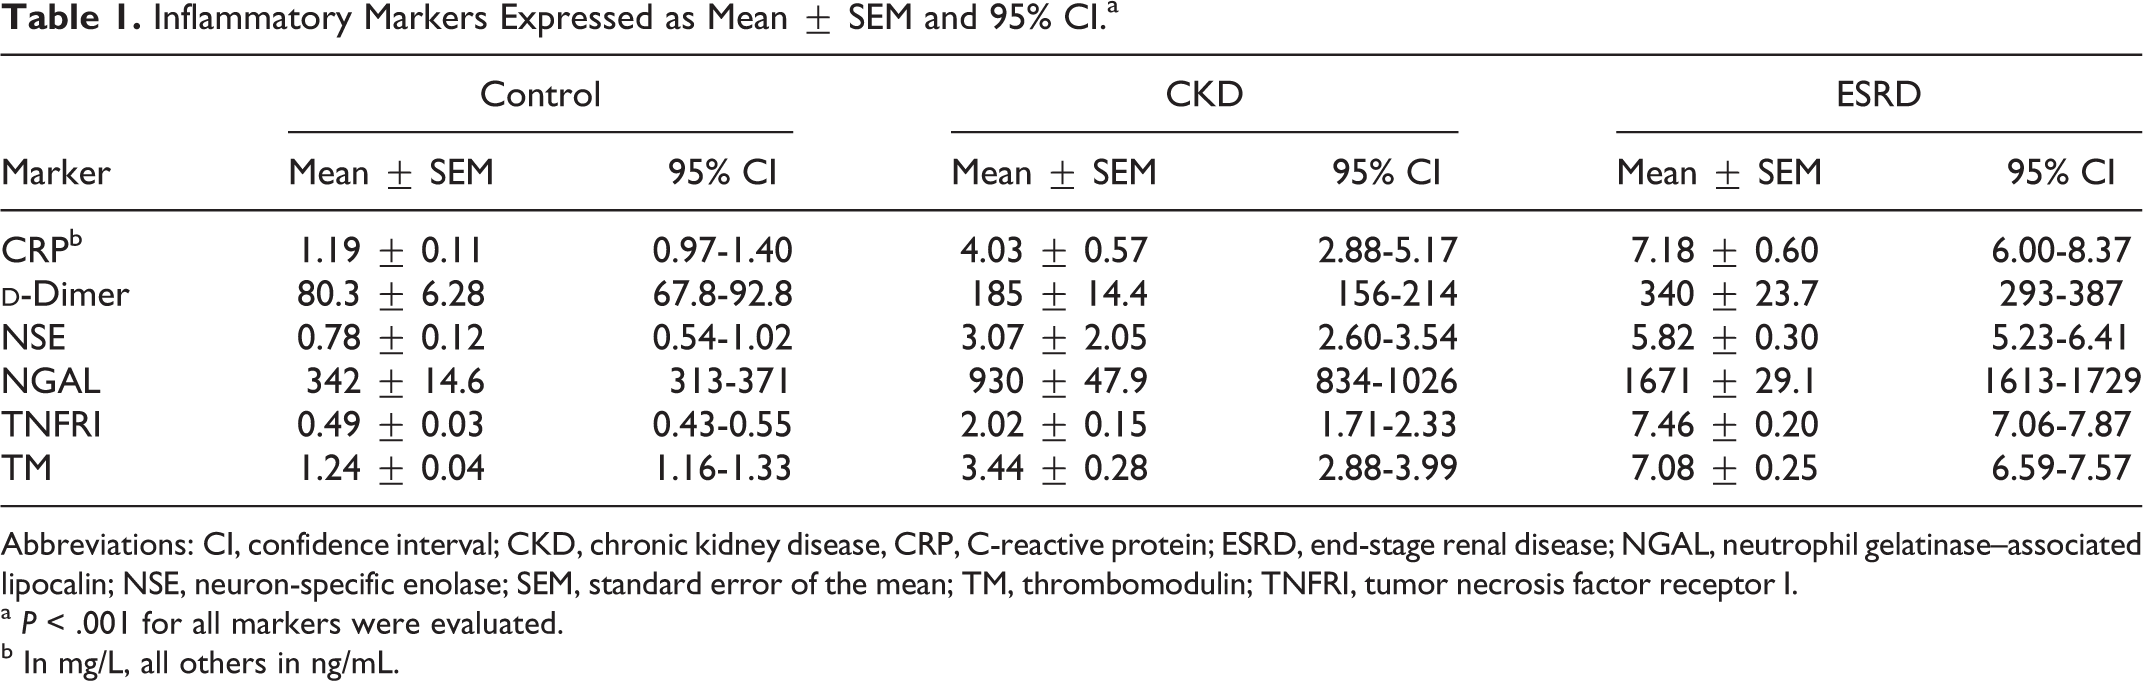
Abbreviations: CI, confidence interval; CKD, chronic kidney disease, CRP, C-reactive protein; ESRD, end-stage renal disease; NGAL, neutrophil gelatinase–associated lipocalin; NSE, neuron-specific enolase; SEM, standard error of the mean; TM, thrombomodulin; TNFRI, tumor necrosis factor receptor I.
a P < .001 for all markers were evaluated.
b In mg/L, all others in ng/mL.
To compare the concentrations of each marker between the groups, relative concentrations were evaluated. Figure 1 is a plot of the relative concentrations of each marker in the control, CKD, and ESRD populations. A near linear progressive upgregulation in NSE, CRP, TM, NGAL, and
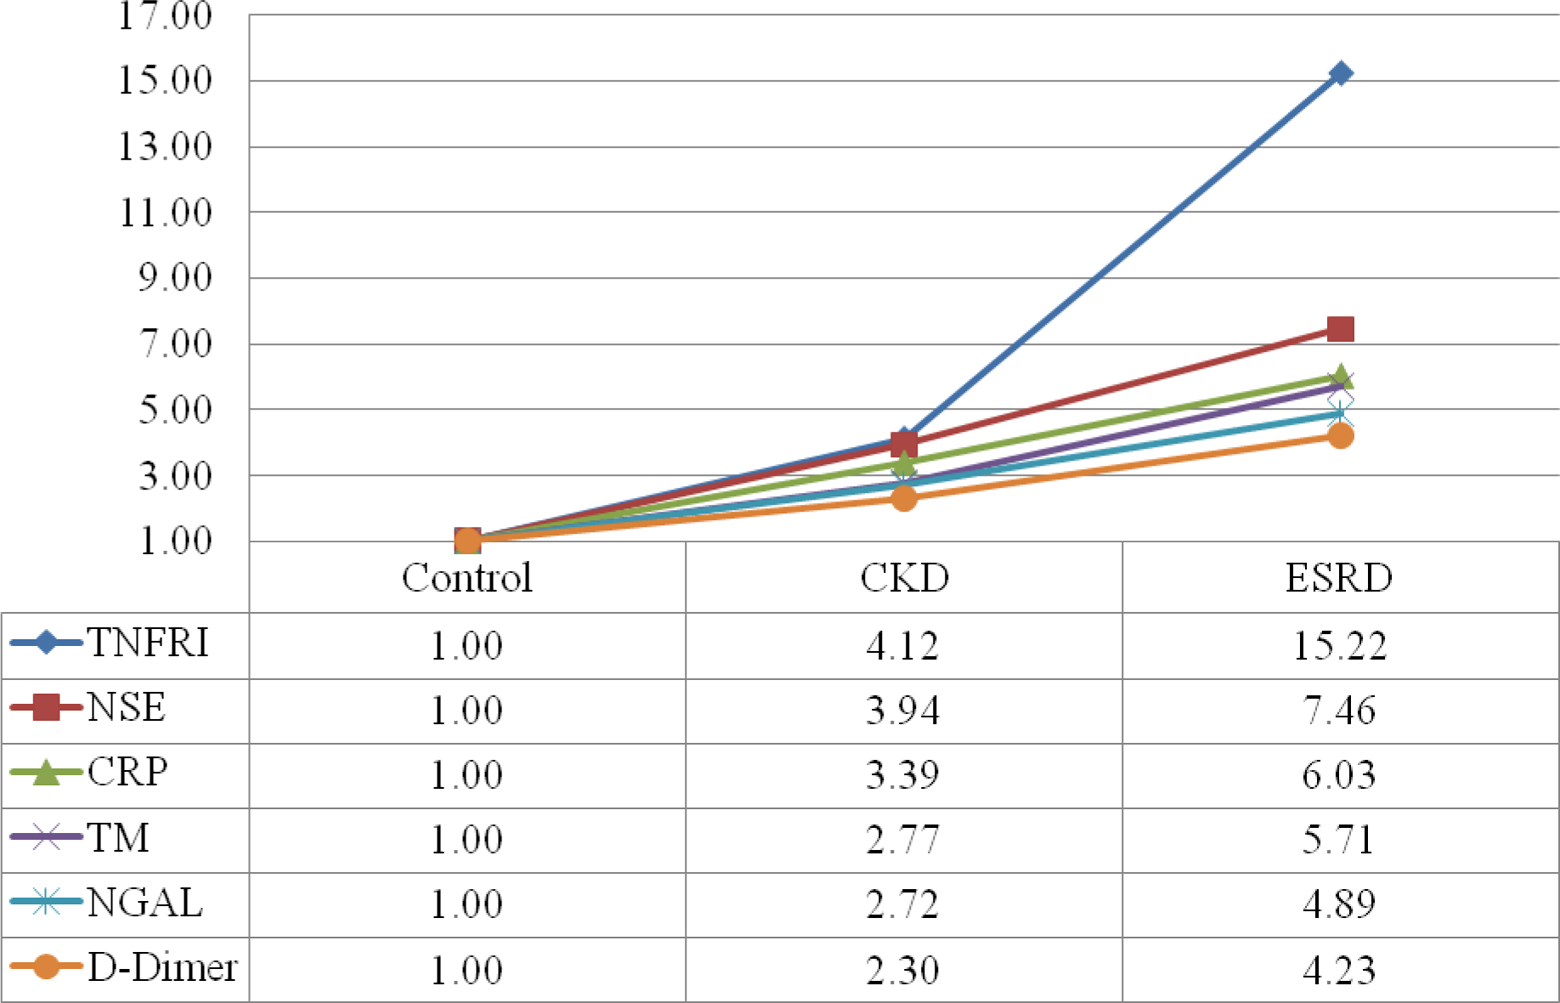
Relative concentration of biomarkers in control versus CKD versus ESRD. Controls were set as a reference of 1.00. CKD indicates chronic kidney disease; ESRD, end-stage renal disease.
Correlation curves between each marker were also evaluated but did not demonstrate statistically significant correlations.
Box plot analysis is presented in Figure 2. A stepwise increase in median value, upper quartile, and lower quartile is appreciated for all markers when comparing control to CKD to ESRD. However, a large range of concentrations is demonstrated for all markers in the CKD and ESRD groups. Additionally, the large range of values demonstrated some overlap in concentration range between each sample group.
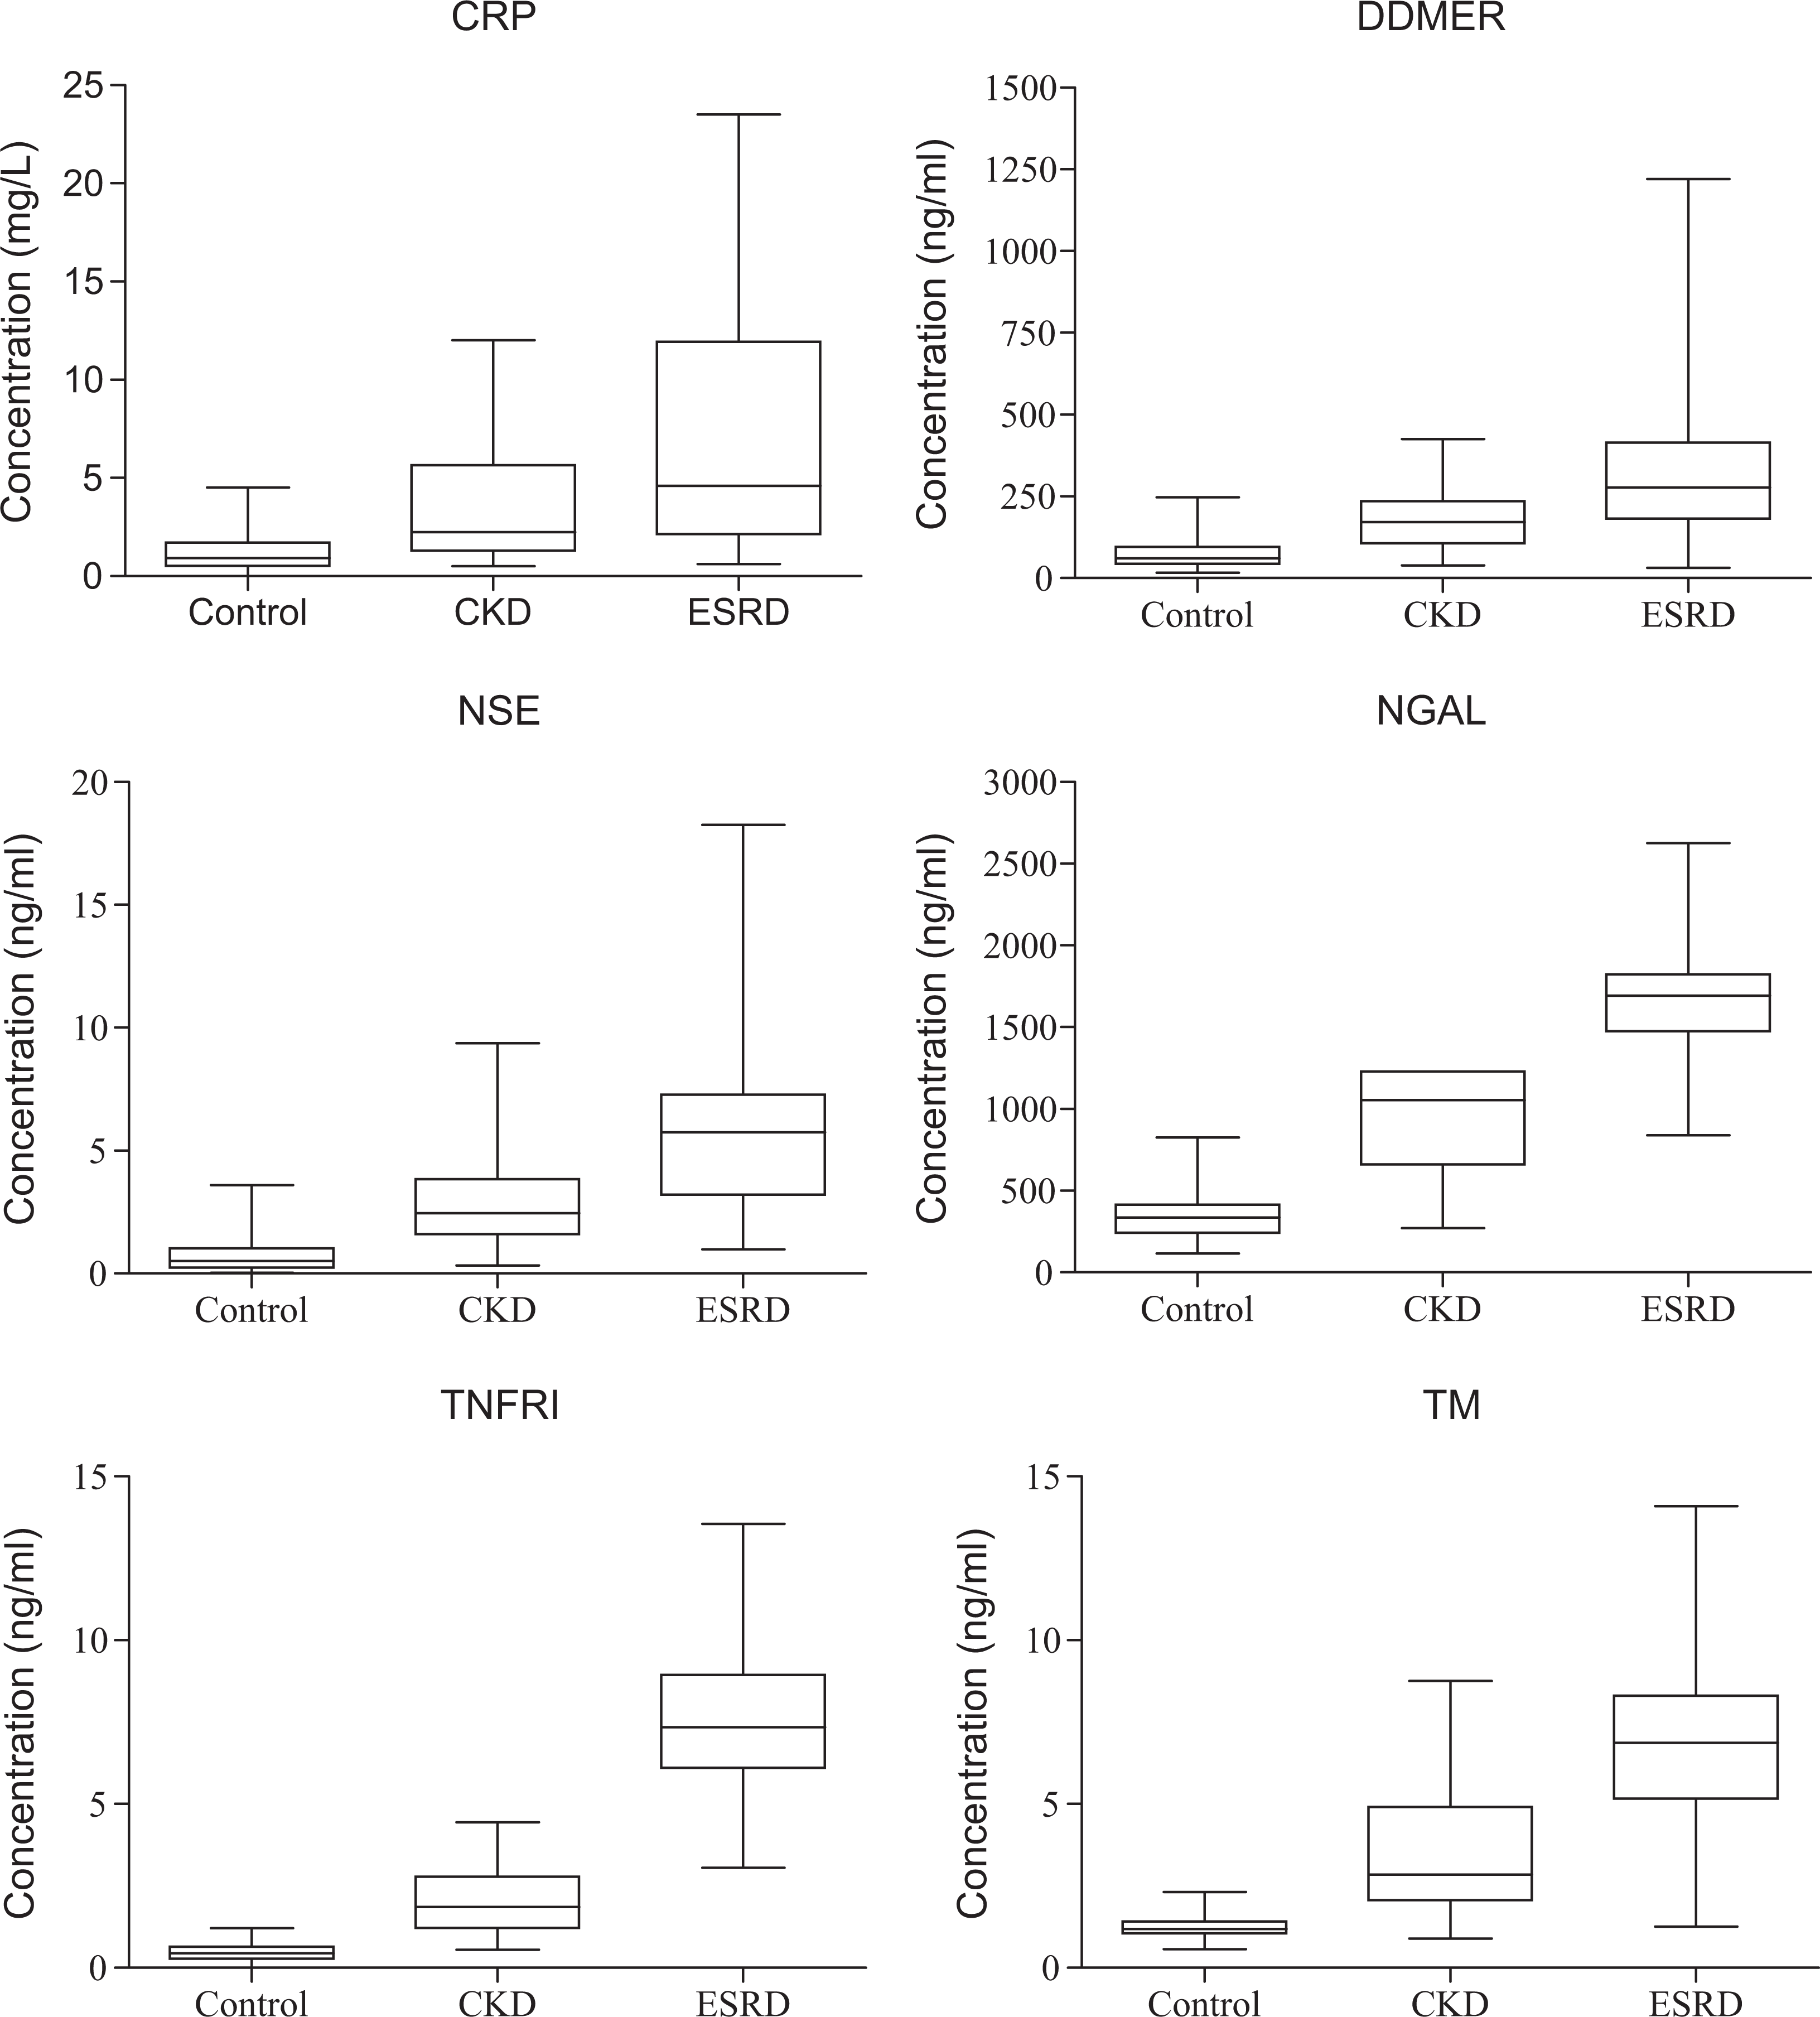
Box plot analysis of biomarkers in control versus CKD versus ESRD. CKD indicates chronic kidney disease; ESRD, end-stage renal disease.
Next, the number of markers (of the 6 markers measured) within 1 standard deviation (SD) of the mean for each group was calculated for each individual sample. In controls, CKD, and ESRD, 5.1%, 13%, and 7.5% of samples had at most 2 markers within 1 SD of the mean, respectively. However, 94.9% of controls, 87.0% of CKD, and 92.2% of ESRD samples had at least 3 markers within 1 SD of the mean.
Discussion
This study demonstrated that CKD and ESRD are associated with elevated levels of inflammatory and prothrombotic markers which included CRP,
Evidence indicates that kidney disease is a pathological state of chronic inflammation and hypercoagulability. Inflammation causes damage to vascular walls; it alters expression of adhesion molecules on the endothelium and platelets, and activates leukocytes which perpetuate the damage causing increased inflammation and hypercoagulability.19,20 In fact, a study by Yeun et al concluded that CRP predicts mortality and is a significant risk factor for CVD in ESRD and the general population. 21 Another study concluded that patients with elevated TNFRI had greater odds of a coronary event defined as nonfatal myocardial infarction or death as a result of coronary disease. 22 The heightened coagulable state in CKD and ESRD is also evidenced in this study by the gross elevation of TM. By activating protein C when bound by thrombin, TM enhances anticoagulant activity and thus is an indicator of hypercoagulability. Additionally, TM activation is an indicator of vascular damage, thus in the CKD population the TM levels may predict the thrombotic risk which may be related to cardiovascular risk.
The NGAL is a lipocalin protein that is expressed in distal renal tubular epithelium and released following injury, 15 therefore, NGAL has been extensively studied in acute kidney injury and is regarded as being potentially one of the more promising markers in nephrology.13,15,23
In fact, NGAL has been shown to be released from renal tubules soon after acute kidney damage, even preceding the rise in serum creatinine. 13 Additionally, studies have shown that elevated NGAL levels are present in higher CKD stages. 24 Therefore, NGAL concentrations may be useful in assessing the overall state of the kidney and thus progression through the CKD stages. However, more recently, NGAL has also been shown to also be expressed in atherosclerotic plaques. 25 Few studies have focused on the use of NGAL as a CVD marker. 26 In this study, concentrations of NGAL were the highest among the markers assayed in both the CKD and the ESRD groups. This could be indicative of ongoing renal tubular damage or possibly accelerated atherosclerotic plaque activity, or both.
Chronic kidney disease has also emerged as an independent risk factor for stroke. 27 Neuron-specific enolase is being studied in the acute ischemic stroke population. Several studies have demonstrated its upregulation in acute ischemic stroke with higher levels indicating worse outcomes. 28 However, to our knowledge, this is the first study that demonstrates an association between NSE and CKD progression. As the results demonstrated, NSE followed an almost linear upregulation in concentration from control to CKD to ESRD. Neuron-specific enolase is primarily found in the cytoplasm of neurons and neuroendocrine origin cells and released from neurons after infarction. 28 Lower amounts of NSE have also been found in erythrocytes and platelets. 28 The relevance of NSE to the kidney disease population has not yet been elucidated. The elevated NSE levels seen in this study may represent an early marker for mild neuronal ischemia in kidney disease; however, the levels indicated in this study of patients with kidney disease are lower than those demonstrated in patient with acute stroke. 28 A study by Khatri et al demonstrated that moderate-to-severe CKD (defined as eGFR 15-60 mL/min) was associated with increased white matter hyperintensity volume which is indicative of increased risk of stroke, cognitive decline, and dementia. 27 Thus, the possibility that elevated NSE in kidney disease could be an ominous marker of neuronal pathology cannot be ruled out. Additionally, platelet activation and erythrocyte destruction from an elevated inflammatory and hypercoagulable state may be responsible for this increase in NSE but is less likely.
As indicated by the box plot analysis (Figure 2), there was a wide range of concentrations for each marker tested when progressing from control to CKD to ESRD. Although the patients with ESRD represent the most severe kidney function in CKD, it is possible that the outliers below the median in the ESRD group represent a cohort of patients with lower CVD risk while those outliers above the median represent patients with ESRD with greater CVD risk. By the same rationale, it is possible that those patients with CKD above the median represent a group of patients at higher CVD risk within the same CKD stage. If this rationale follows, then according to these results, there are patients with CKD that are at higher risk of cardiovascular events than some patients with ESRD (those represented below the mean in the ESRD group).
The results also demonstrate that a single marker may not be sufficient to evaluate a patient’s inflammatory and thrombotic state. In fact, according to the markers tested in this study, at least 3 markers were needed to be assessed in order include a significant portion of the patient population. Therefore, a multibiomarker approach may be most appropriate to evaluate a patient’s inflammatory and thrombotic state.
Therefore, it is possible that biomarkers of inflammation and procoagulation can be used to evaluate the actual pathophysiological state in kidney disease. Since CVD is the leading cause of death in this group of patients, and it is thromboembolic diseases which threaten survival rather than reduced kidney function alone, the actual kidney disease stage may be less important than the patient’s inflammatory or thrombotic state. Additional longitudinal studies that evaluate cardiovascular outcomes in this population must be performed to evaluate the utility of thrombotic biomarkers in assessing CVD risk to be able to identify more vulnerable patients within a CKD stage and properly focus treatment through risk stratification.
Conclusion
Currently, creatinine, cystatin C, and urine albumin-to-creatinine ratio are among the markers used to evaluate kidney disease stage, however, each of these has its own limitations. 29 It is becoming clear that a single indicator of renal function is not sufficient in evaluating kidney disease stage or its associated cardiovascular risk. The use of these biomarkers in conjunction with eGFR and CVD risk factors may better assess overall patient risk and be able to stage patients more appropriately. The use of a new “inflammatory or thrombotic stage” may be warranted in the kidney disease population. Advanced risk stratification techniques which take all factors into account may support earlier intervention through dialysis or pharmacological agents in CKD. However, additional studies need to be performed to establish cutoff values and standardize procedures.
This study has several limitations including sample size and lack of distinction between the specific CKD stages for the CKD group. Therefore, future studies should focus on how eGFR and specific CKD stage correlates with the biomarkers tested in order to evaluate whether thrombotic state markers should be used in conjunction with current kidney status markers when evaluating kidney disease stage and overall thrombotic risk in this population. Additionally, following up with the CKD and ESRD groups in order to evaluate true end points such as a documented cardiovascular event may help to clarify whether elevated markers in the study truly represent an elevated risk of cardiovascular events within each group. It is also important to evaluate the biomarker levels in ESRD postdialysis to assess whether their levels are truly representative of the disease state or whether they represent a buildup of retained markers. Additional studies on the significance of NSE can help to evaluate cerebrovascular risk and possible neuronal cell injury in kidney disease or to serve as a marker for early neural damage in kidney disease.
Footnotes
Declaration of Conflicting Interests
The author(s) declared no potential conflicts of interest with respect to the research, authorship, and/or publication of this article.
Funding
The author(s) received no financial support for the research, authorship, and/or publication of this article.