
Abstract
Combined hormonal contraceptives possess an inherent risk of thrombus-related events. The purpose of this study is to elucidate alterations in the coagulation profile among young women using combined oral contraceptive (COC) or combined vaginal contraceptive (CVC) compared to a normal, healthy, female control group using the Sonoclot coagulation analyzer. We enrolled 159 participants (64 control individuals, 51 COC users, and 44 CVC users). Each participant completed a survey of medical history, family medical history, and lifestyle choices. Citrated venous whole blood was collected and analyzed using the Sonoclot coagulation analyzer. After adjusting for age, race, alcohol consumption, sleeping habits, and family history of cardiovascular disease, and stroke, we observed COC and CVC users had mostly similar coagulation profiles except when compared to the control, and COC and CVC users had an elevated glass bead peak signal while COC users had a shorter peak time.
Keywords
Introduction
Combined hormonal contraceptives (CHCs) contain synthetic derivatives of the naturally occurring female sex hormones estrogen and progesterone. It has been shown that users of CHCs possess a 3- to 5-fold increased thrombotic risk when compared to non-CHC users. 1 The most common method of CHC is the combined oral contraceptive (COC). The COCs are classified into 3 generations depending on which type of progestin is used in formulation. 2 In the mid-1990s, published data suggested an increased risk of thrombotic events among third-generation COC users, with odds ratios ranging from 1.5 to 2.2, when compared to second-generation users.3,4 Third-generation COCs are still widely used despite the potential increased thrombotic risk. 5
While COCs are the most common method of CHC used, recently a third-generation combined vaginal contraceptive (CVC), NuvaRing, has also come to market. 6 Many biomarkers for cardiovascular risk assessment have been determined to be negatively affected by CHC use, providing an indirect measurement of procoagulant phenotype.7 –14 However, more advantageous would be an in vitro whole blood coagulation assessment to assess true coagulation alterations rather than indirect markers of coagulation.
Although many studies have analyzed adverse vascular events among CHC users,15 –21 relatively few studies have investigated the alterations in global coagulation. One study 22 has shown no prothrombotic indication among other clot-based assays, such as thrombin time and activated partial thromboplastin time among CHC users, while another study showed a decrease in prothrombin and activated partial thromboplastin times among a COC user group. 23 A study of 19 women showed a shortening of whole blood clotting time in users of a third-generation triphasic COC. 24 Whole blood clotting assays, such as Sonoclot, provide information on the entire coagulation process including fibrin gel formation, platelet function, and fibrinolysis. Other coagulation tests, such as the prothrombin time and activated thromboplastin time, use only the plasma component of blood, focus on a specific pathway of coagulation (intrinsic or extrinsic), and yield only a clotting time output while ignoring useful interpretations of the global coagulation process.
We have conducted a whole blood clotting assay utilizing Sonoclot: coagulation analyzer (Arvada, Colorado) device, as shown in Figure 1A . The Sonoclot device was first described 25 in 1975 and has been used to access a wide variety of coagulation disorders and treatments.26 –28 The Sonoclot device has been previously used to show a hypercoagulable state in healthy, pregnant females at 8 weeks postpartum. 29 The device operated by submersing a disposable plastic probe into a fixed volume of citrated whole blood followed by recalcification. When the test is initiated, the disposable plastic probe vibrates 1 µm vertically at an ultrasonic frequency of 200 Hz. The Sonoclot signature curve (Figure 1B) is generated by measuring the impedance to the vibrations by the clotting blood.
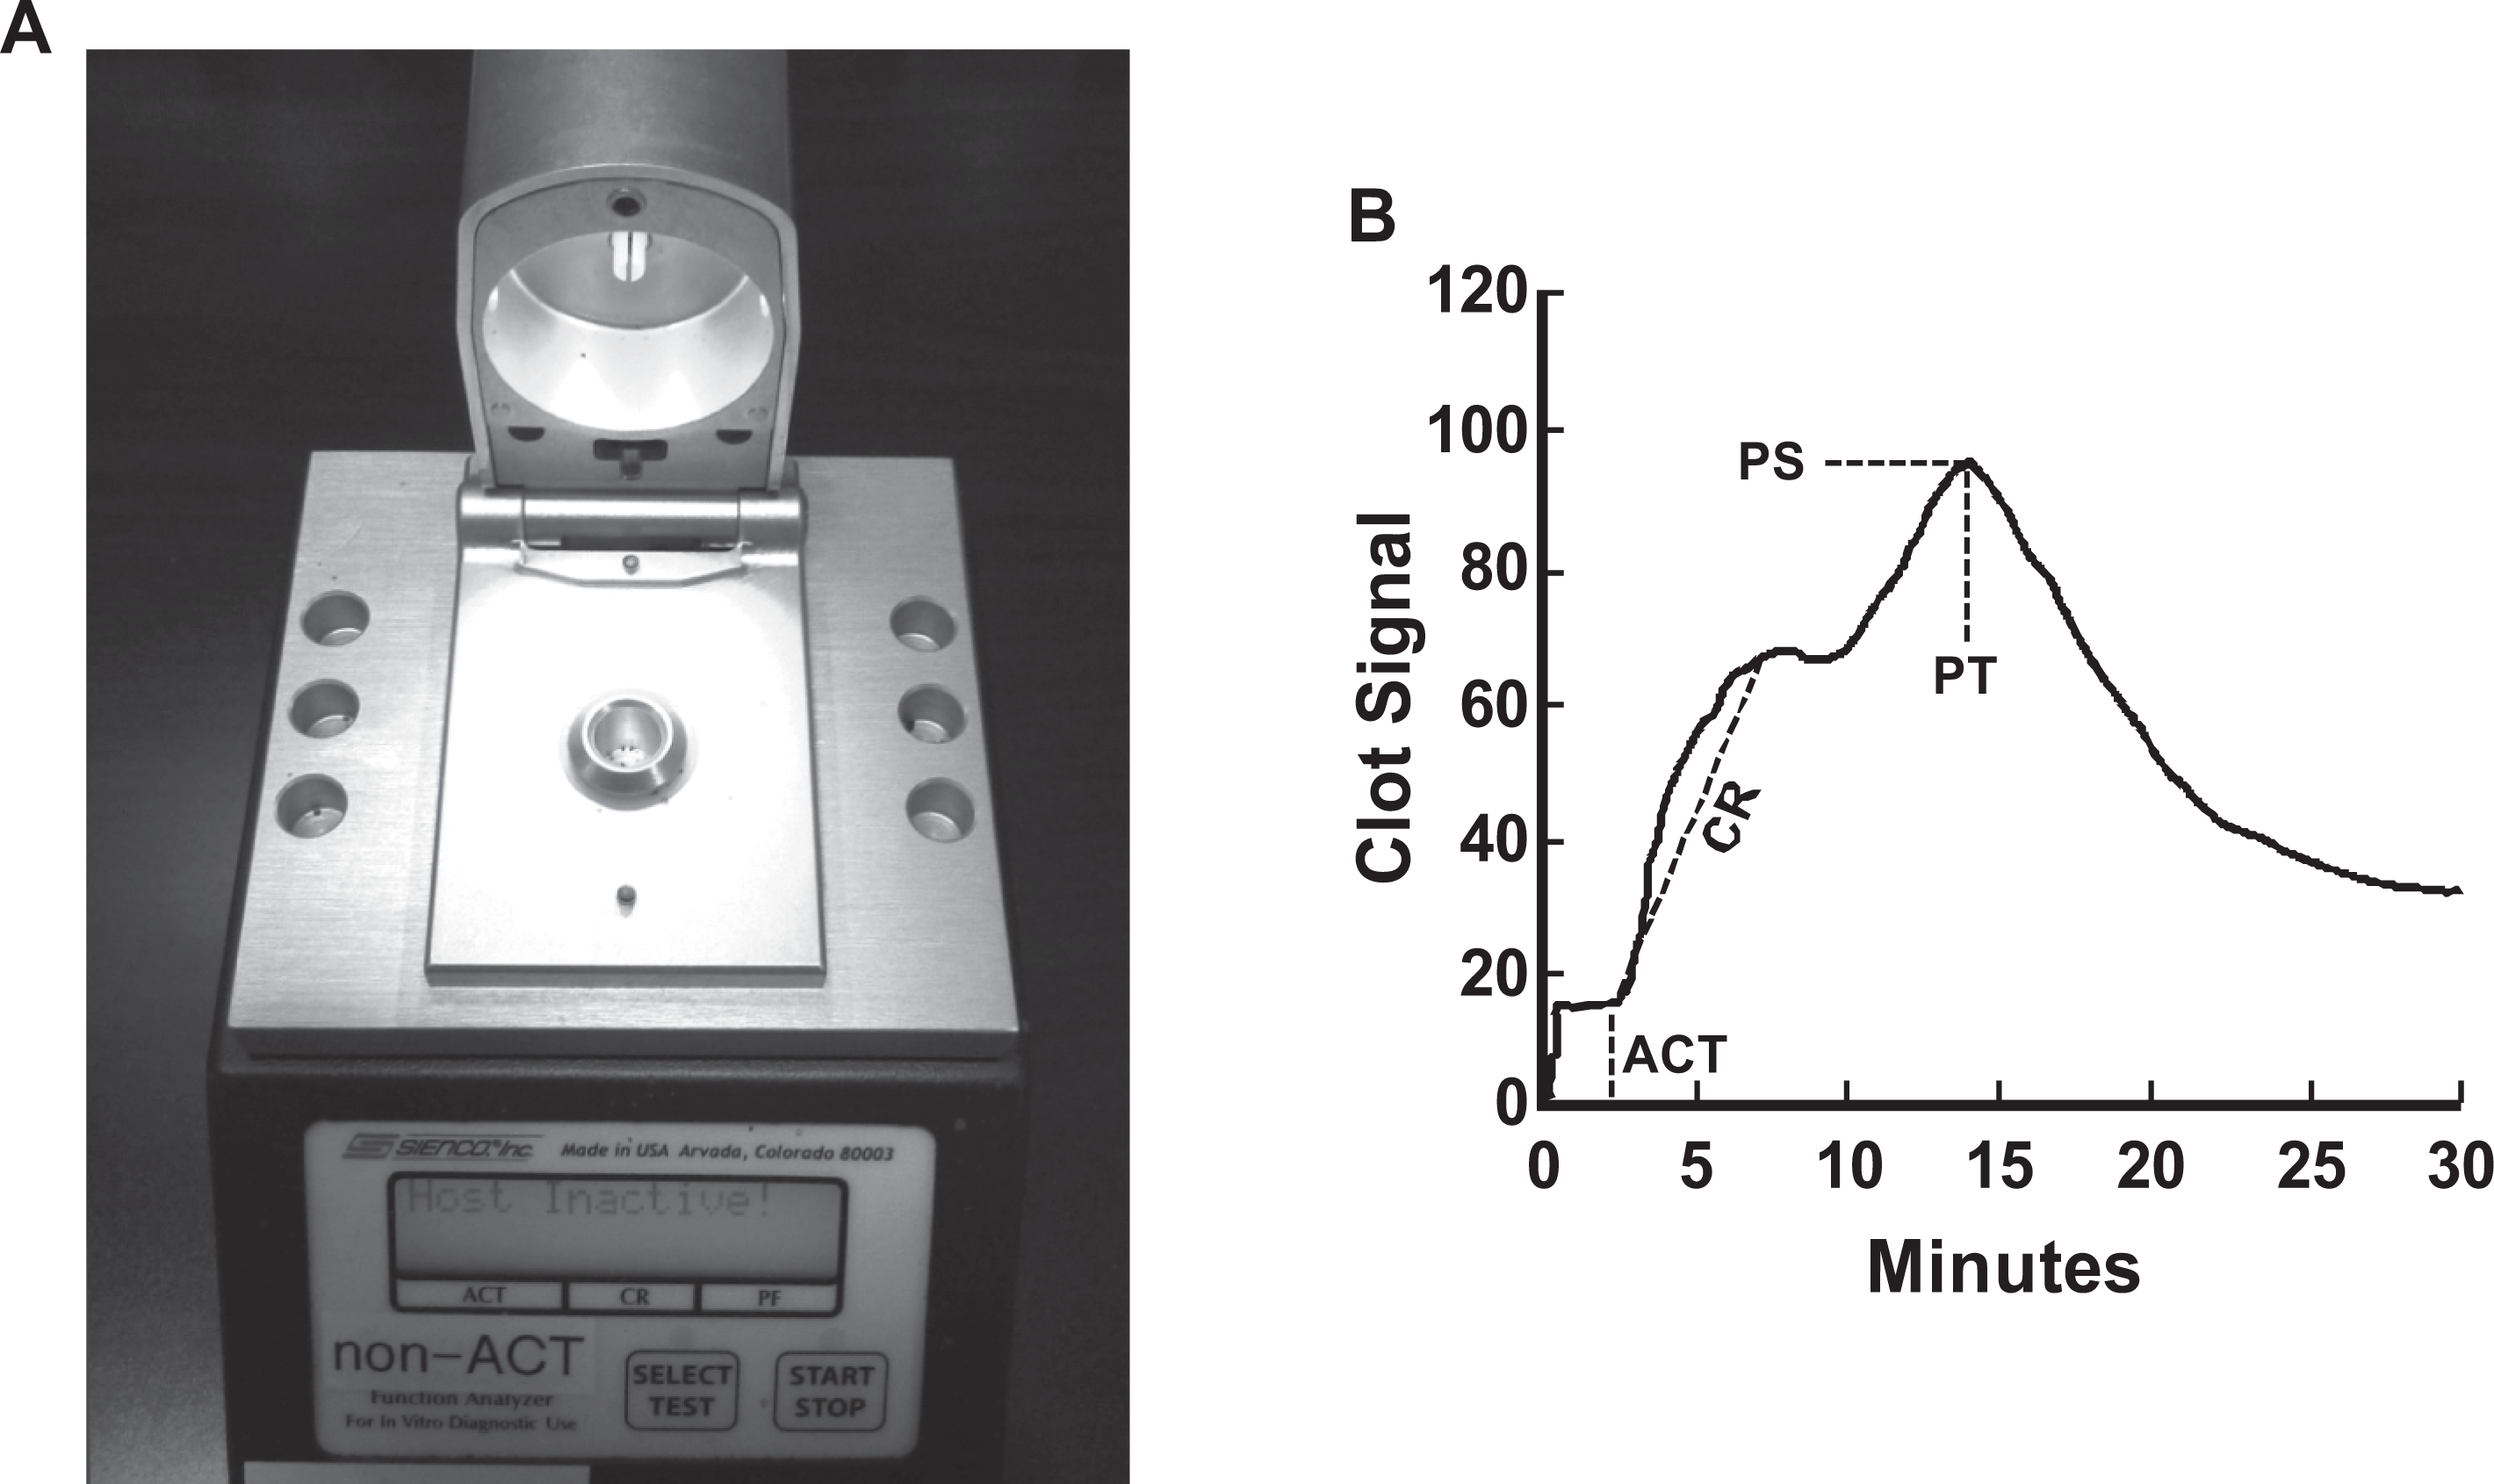
A, Sonoclot coagulation analyzer device. B, A sample of Sonoclot signature curve. ACT indicates activated clotting time; CR, clotting rate, PT, peak time; PS, peak signal.
Our study aimed to assess changes in coagulation profile due to CHC use among a young, healthy, female population aged 19 to 30 years old. We hypothesize that due to the use of CHC, a hypercoagulable state is induced as determined by the Sonoclot coagulation analyzer. While cutoff values indicating a hypercoagulable state, using the Sonoclot device, are not available in a young, healthy, female population, our study relies on a direct comparison of CHC users to control participants to indicate hypercoagulable state.
Methods
Study recruitment was concentrated to 3 categories of young, healthy women aged 19 to 30 years old in approximately equal proportions: (1) non-CHC users, (2) COC users, and (3) CVC users. The study was approved by the University of Minnesota Institutional Review Board. After signing consent/Health Insurance Portability and Accountability Act (HIPAA) forms, each participant filled out a standard questionnaire encompassing family and medical history, lifestyle, eating, and sleeping habits, and so on, followed by a brief physical examination. None of the participants were restricted by food or alcohol intake prior to recruitment. Additionally, blood samples were collected from each participant. In order to limit tissue factor contamination and platelet activation, a red top tube was collected first and discarded. A 4.5 mL 3.2% sodium citrate tube, collected from each participant, was used for Sonoclot analysis within 1 hour after the blood was drawn. Sonoclot testing was performed as previously described. 30 Briefly, 330 µL of citrated whole blood was added to prewarmed (37°C) cuvettes with and without glass beads (gb). Each test sample was recalcified with 15 µL of 0.25 mol/L CaCl2. The test was initiated by closing the aperture and manually starting the test on the device. Each test was allowed to run for 30 minutes, then printed, and saved electronically. We analyzed the activated clotting time (ACT), clotting rate (CR), peak time (PT), and peak signal (PS) from the Sonoclot signature curves (Figure 1B) for the 2 different cuvettes. Both ACT and CR were automatically computed using the provided Signature Viewer software, whereas PT and PS were calculated via individual analysis of each curve’s maximum/PS and corresponding time for that maximum signal (PT). The cuvettes without gb allowed the recalcified blood to clot at 37°C with no additional activator of coagulation. The gb cuvettes utilized the negatively charged silica surface of micro gb to help activate the intrinsic coagulation cascade. All the Sonoclot tests were performed by 2 of the investigators (K.R.B. and R.M.M.)
Statistical Analysis
Summary statistics, including median and interquartile range, were calculated for each Sonoclot variable and each group. Kruskal-Wallis test and Wilcoxon rank sum test were used for 3- and 2-group comparisons, respectively. Multivariate analysis was conducted adjusting for covariates of age, race, alcohol consumption, regular sleeping habit, and family history of cardiovascular disease (CVD) and stroke due to the fact that these variables were significantly different between the 3 groups in univariate analysis. The least square means for different groups and the P values for different contrasts, based on the estimated regression models, were reported. Due to the multiple biomarkers that we analyzed, a P value of <.01was considered statistically significant and a P value between 0.01 and 0.05 was considered marginally significant. We also assessed inter-rater reliability between the 2 Sonoclot users (K.R.B. and R.M.M.) using univariate and multivariate analyses for the use of Sonoclot instruments. Intra-rater reliability was examined by using intraclass correlation coefficient (ICC) on repeatedly measured samples. SAS version 9.2 (SAS Institute, Cary, North Carolina) was used for analysis.
Results
In total, 159 participants (64 control participants, 51 COC users, and 44 CVC users) were successfully enrolled in our study. Two control participants, 1 COC user, and 2 CVC users were active smokers, although their smoking status was not significantly different between our groups and did not significantly affect any of the Sonoclot results. Of our 64 control participants, 24 had used CHC in the past with a median (range) last use of 13 (6-60) months. Past CHC use did not affect any Sonoclot variables. Among COC users, 66.7% were using third-generation COCs, while 19.6% and 13.7% were using first-generation and second-generation COCs, respectively. The mean age ± standard deviation of the control, COC users, and CVC users was 21.5 ± 2.3, 22.3 ± 2.2, and 24.2 ± 3.3 years old, respectively. The age difference between control participants and CVC users was statistically significant (P < .0001). There were fewer white control participants (69%) than COC users (92%) and CVC users (91%), which was statistically significant between groups (P = .0013). Although still within normal range, users of CHC (both COC and CVC) had elevated blood pressure when compared to control participants. Alcohol consumption was more prevalent among CHC users (P < .0001) as compared to the control group. We also observed significantly higher (P = .0304) family history of CVD and stroke among CVC users. Differences in diet and exercise among the study cohort did not significantly affect any Sonoclot variables.
The univariate analysis results are presented in Table 1 . We observed a marginally significantly lower ACT (P = .0458) and PT (P = .0430) for the CVC user group compared to the control but no alterations in CR or PS. Our univariate analysis also revealed significant or marginally significant alterations in gb-ACT, gb-CR, gb-PT, and gb-PS. However, after correcting for covariates of age, race, alcohol consumption, regular sleeping habit, and family history of CVD and stroke in our multivariate analysis (Table 2 ), ACT, PT, and gb-CR were no longer significant. The gb-ACT was marginally significantly longer in CVC users when compared to COC users (P = .0129). Additionally, gb-PT was marginally significantly shorter in COC users (P = .0430) but not in CVC users (P = .1455) when compared to control participants. Finally, gb-PS was significantly lower in COC users (P = .0074) and marginally significantly lower in CVC users (P = .0482) when compared to the control participants. Interestingly, after adjusting for covariates, none of the nonactivated cuvette tests were significantly altered in either the COC or CVC user groups when compared to the control.
Univariate Analysis of Sonoclot Results
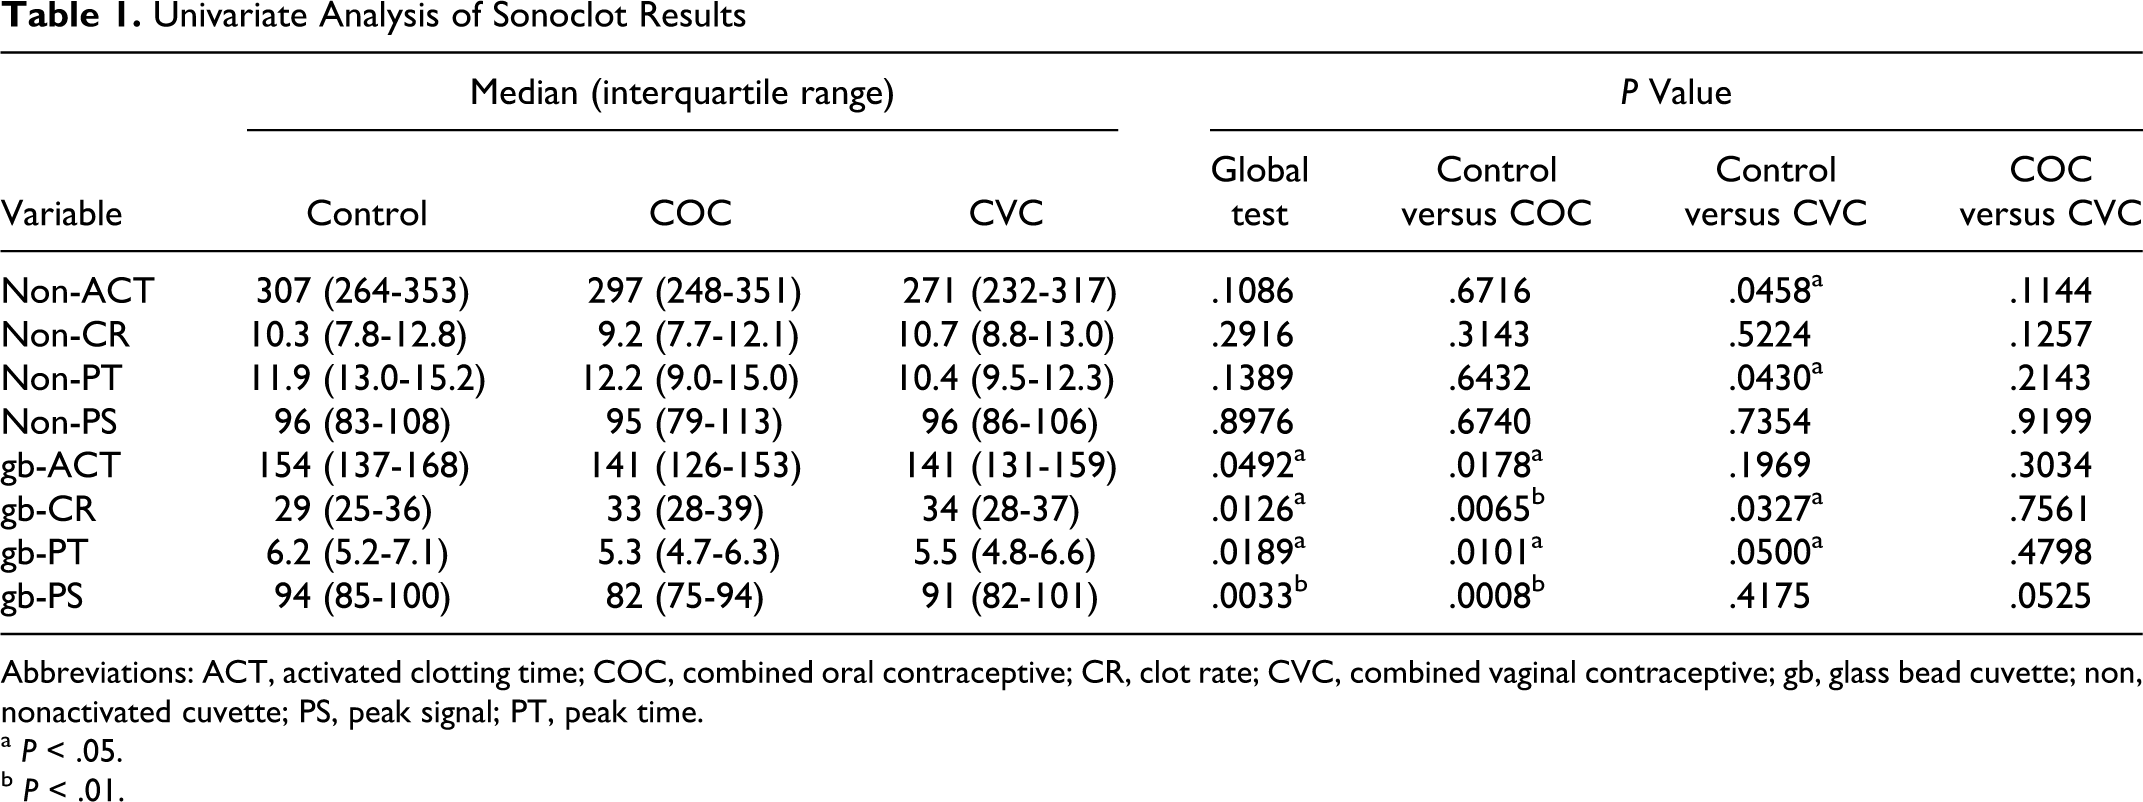
Abbreviations: ACT, activated clotting time; COC, combined oral contraceptive; CR, clot rate; CVC, combined vaginal contraceptive; gb, glass bead cuvette; non, nonactivated cuvette; PS, peak signal; PT, peak time.
a P < .05.
b P < .01.
Multivariate Analysis of the Sonoclot Results
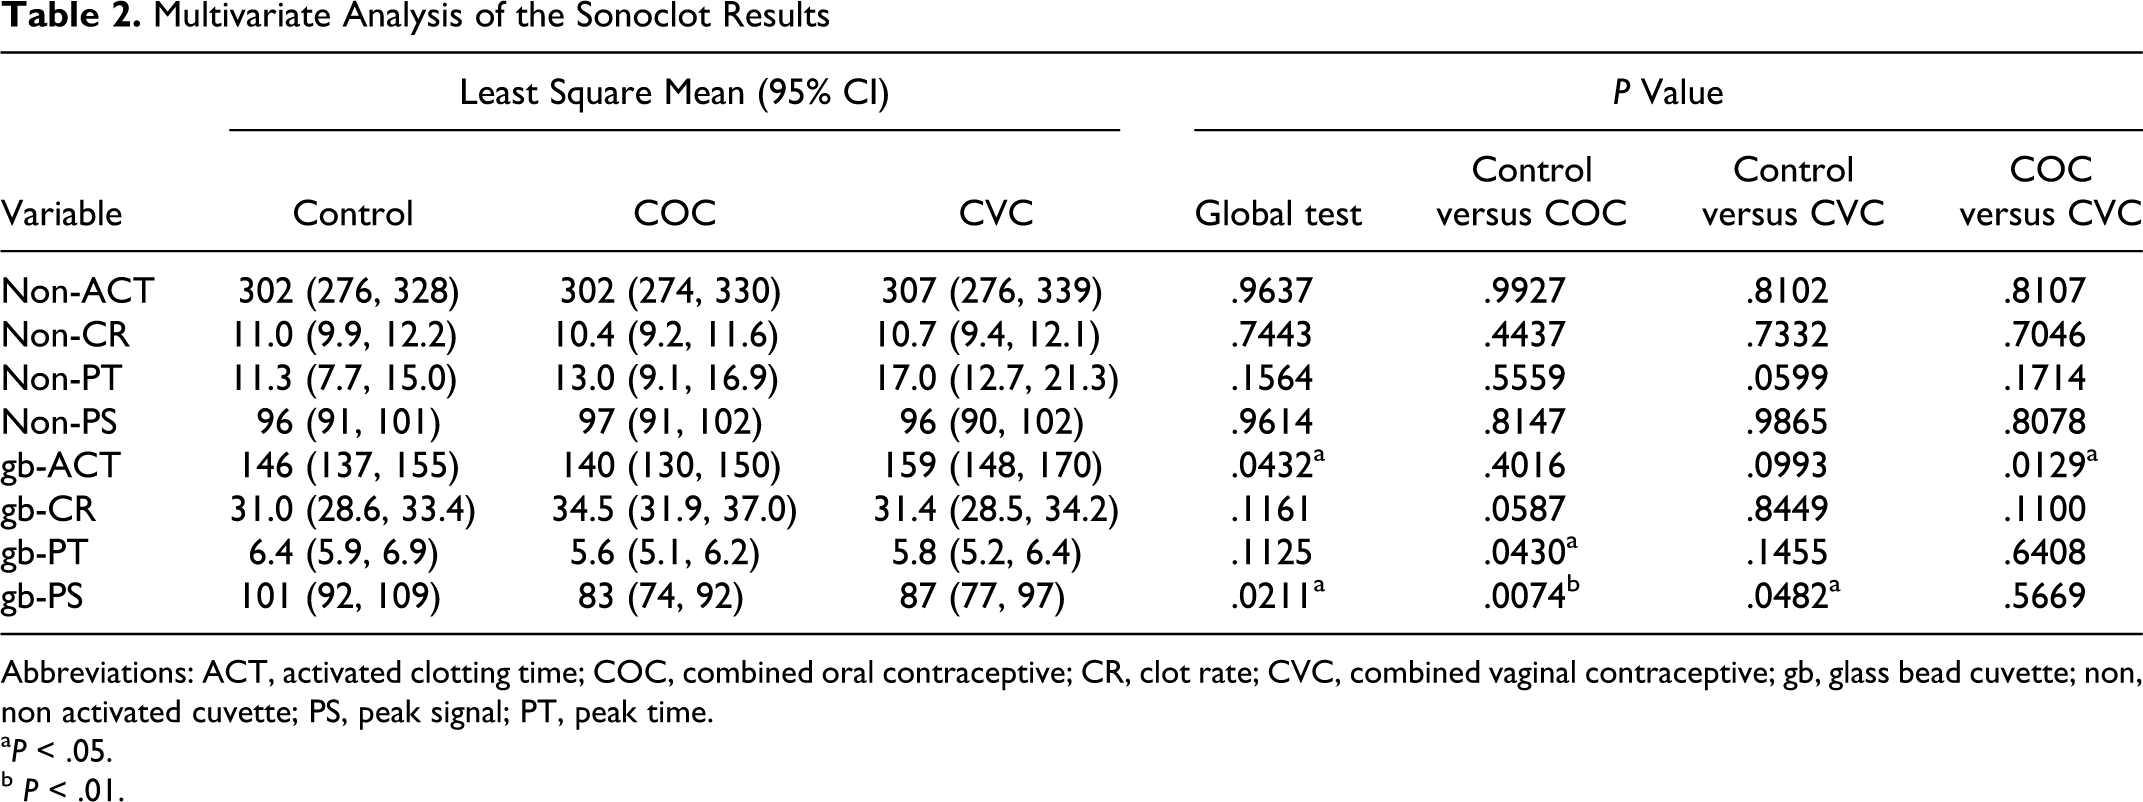
Abbreviations: ACT, activated clotting time; COC, combined oral contraceptive; CR, clot rate; CVC, combined vaginal contraceptive; gb, glass bead cuvette; non, non activated cuvette; PS, peak signal; PT, peak time.
a P < .05.
b P < .01.
In order to determine whether past CHC use affected our Sonoclot variables, we completed a differential comparison of our control group of “never users” and “past users” of CHC (Table 3 ). We did not observe any significant alterations in our never user group when compared to our past user group, for any of the variables analyzed. Therefore, we combined both never users and past users as our control group.
Sonoclot Results for Never Users Versus Past Users
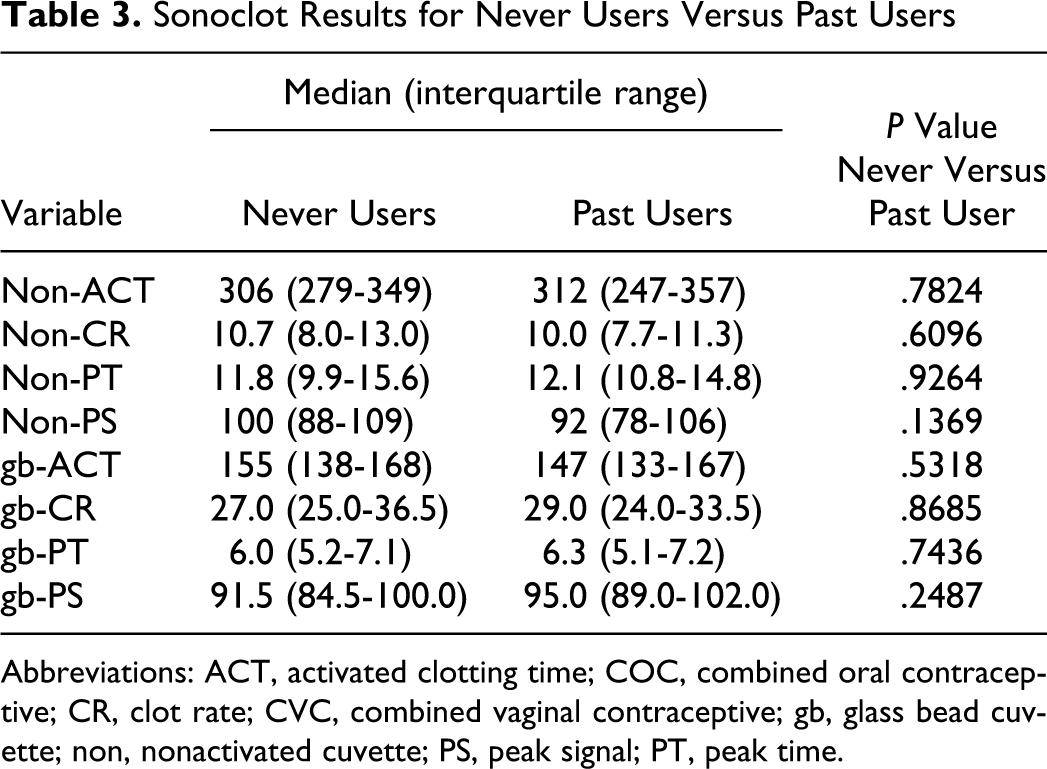
Abbreviations: ACT, activated clotting time; COC, combined oral contraceptive; CR, clot rate; CVC, combined vaginal contraceptive; gb, glass bead cuvette; non, nonactivated cuvette; PS, peak signal; PT, peak time.
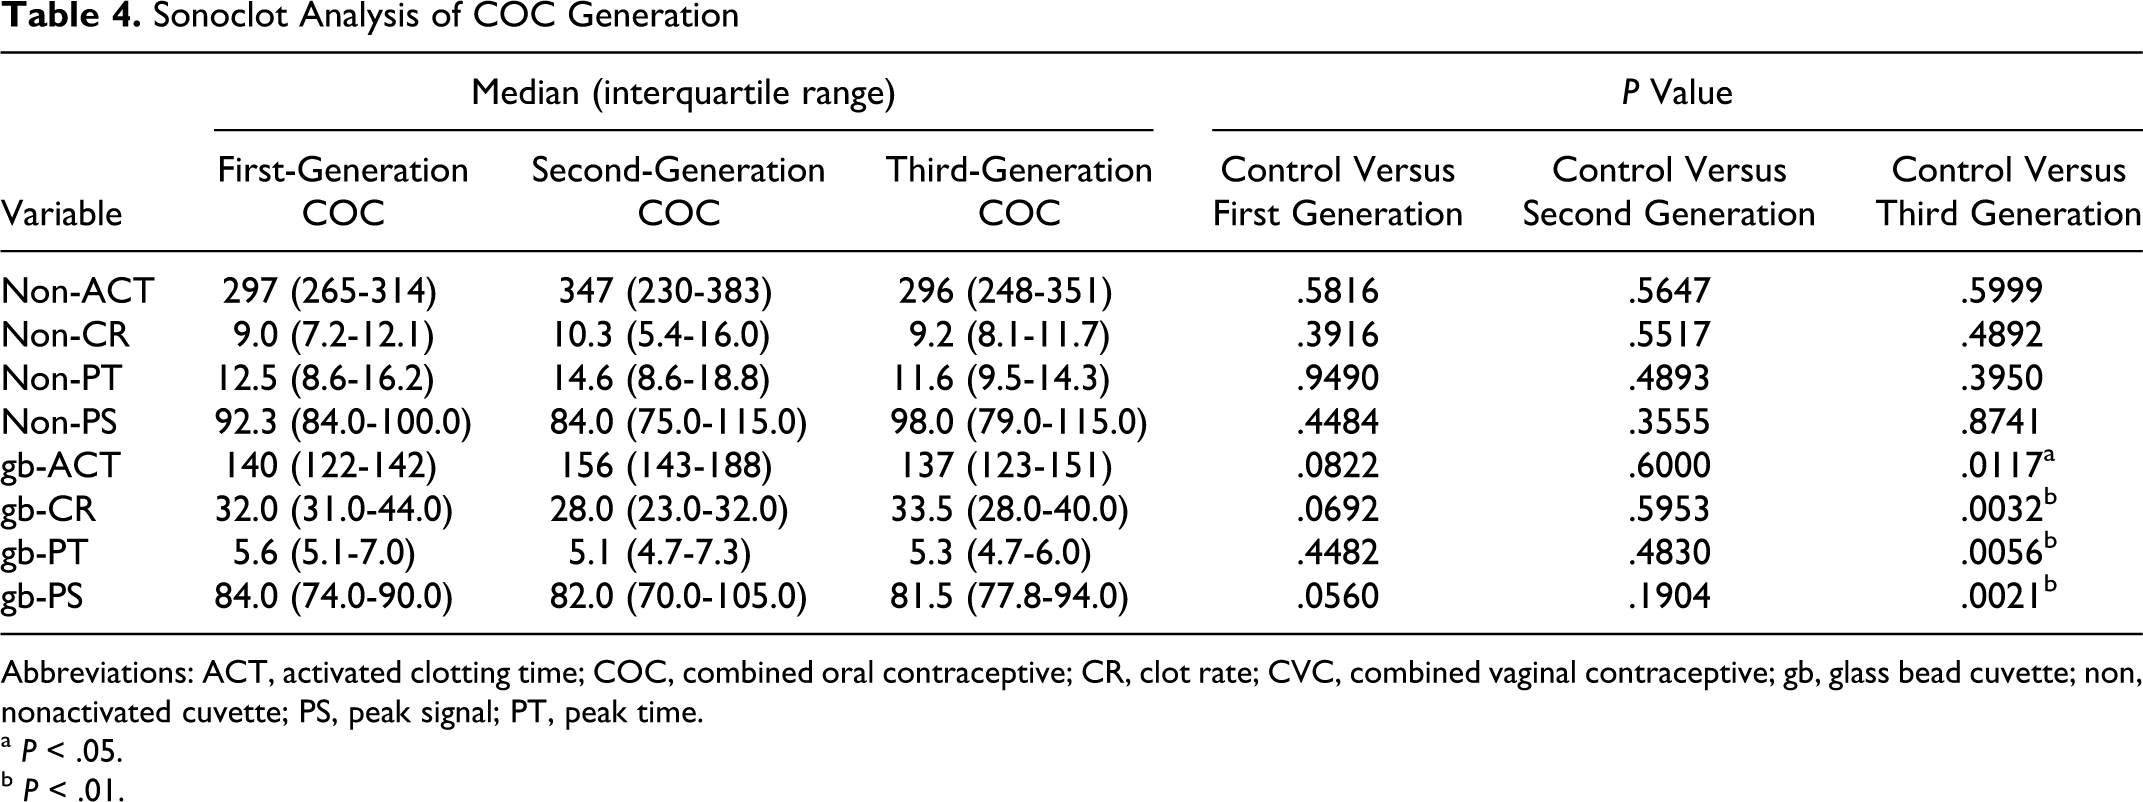
Additionally, we attempted to elucidate the effect of COC generation on the Sonoclot variables (Table 4 ). We observed significant differences in gb-CR (P = .0032), gb-PT (P = .0056), and gb-PS (P = .0021) and a marginally significant difference in gb-ACT (P = .0117) when comparing the control participants to third-generation COC users. However, no significant changes in gb-CR, gb-PT, and gb-PS were observed in either the control versus first generation or control versus second generation. This observation is most likely due to the limited number of participants in the first- and second-generation COC user groups, with 10 and 7 participants, respectively.
Sonoclot Analysis of COC Generation
Abbreviations: ACT, activated clotting time; COC, combined oral contraceptive; CR, clot rate; CVC, combined vaginal contraceptive; gb, glass bead cuvette; non, nonactivated cuvette; PS, peak signal; PT, peak time.
a P < .05.
b P < .01.
In the univariate analysis for inter-rater reliability using Wilcoxon rank sum test, we did not find any statistically significant difference between the 2 raters in obtaining the Sonoclot measurements. After adjusting for study group (control, COC, and CVC), rater (K.R.B and R.M.M), age, race, alcohol consumption, regular sleeping habit, and family history of CVD and stroke, the 2 raters' measurements were not statistically significantly different (P values for ACT and CR measurements were 0.67 and 0.37, respectively). The intra-rater reliability analysis showed an overall ICCs value of 0.98 and 0.96 for ACT and CR measurements, respectively.
Discussion
We observed significant alterations in several Sonoclot parameters analyzed in our study between the control, COC users, and CVC users. Among the collected demographical information, age, race, alcohol consumption, regular sleeping habit, and family history of CVD and stroke were statistically different between our 3 groups. Therefore, these covariates were adjusted for in our multivariate analysis. The data range for the observed Sonoclot testing variables agrees with other published studies.29,30
The gb-CR was significantly or marginally significantly elevated in the COC user group (P = .0065) and the CVC user group (P = .0327) when compared to the control in our univariate analysis (Table 1). However, these significant differences largely disappeared (P = .0587 for COC and P = .8449 for CVC) after adjusting for covariates in the multivariate analysis (Table 2). The CR is an important marker with elevated values indicating a hypercoagulable state. Interestingly, the CR was not significantly elevated in the analysis. Our initial assumption was that the nonactivated test cuvette would provide a greater indication of hypercoagulability due to the absence of a coagulation activator, thus allowing for a more pronounced delineation between normal coagulation in control participants (lower CR) and possible hypercoagulation in CHC users (higher CR). While CVC users had marginally significantly shorter ACT in our univariate analysis (P = .0458), the significance disappeared (P = .8102) after adjusting for the covariates. In fact, there was no statistically significant difference among the 3 groups for the nonactivated cuvette tests in the multivariate analysis. The lack of significant difference observed may be due to insufficient sample size or the insensitivity of nonactivated cuvettes to detect small changes.
In the multivariate analysis, the gb-ACT test showed a marginally significant difference between COC users and CVC users (P = .0129) with COC users having a shorter gb-ACT. The ACT is a measure of clotting time; with shorter times indicating elevated thrombotic potential. This observation agrees with another study showing a beneficial change in cardiovascular risk biomarkers among COC users who switch to CVC. 31 Other evidence has shown little difference in indirect biomarkers of thrombosis and fibrinolysis between COC and CVC. 32 The reduction in gb-ACT in COC users, when compared to CVC users, possibly indicates elevated thrombotic risk among COC users.
The amplitude of gb-PS was significantly less in the COC user group when compared to the control (P = .0074). The CVC users also had a lower gb-PS amplitude than the control, but to a lesser extent (P = .0482). This is the opposite direction we would have predicted due to elevated PS serving as a marker of clot strength in a hypercoagulable state. We initially predicted that both COC and CVC users would have elevated PS and gb-PS. Another study utilizing thromboelastography showed no significant alteration in maximum amplitude among participants tested before and after COC use. 33 The maximum amplitude of a thromboelastograph is a similar measure to the Sonoclot PS in that both parameters effectively measure clot strength upon completion of fibrin formation.
As expected, the gb-PT for COC users was slightly faster than the control (P = .0430) based on the multivariate analysis, possibly implying a hypercoagulable state for COC users. However, this was not the case for CVC users (P = .1455). It is possible that the gb-PT test indicates a more significant alteration in coagulation among COC users when compared to CVC users, although our analysis showed no significant difference when we compared COC and CVC users for gb-PT (P = .6408).
Analysis into the past use of CHC among the control group showed no difference in any of the Sonoclot parameters in the “never user” and the “past user” groups (Table 3). This is important because it shows that we could effectively include past CHC users in our control group for our analysis. It has been shown that no residual risk remains upon stopping CHC use, 34 which agrees with our finding.
Also, no significant differences were observed in our subgroup analysis of COC generations (Table 4). The fact that statistically significant alterations were observed only for third-generation COC, compared to the control group for gb-CR (P = .0032), gb-PT (P = .0056), and gb-PS (P = .0021), is most likely due to the limited number of participants in our first- and second-generation COC user groups, n = 10 and n = 7, respectively, thus limiting the power of analysis for first- and second-generation COCs. Further study is warranted to analyze coagulation differences among COC generations due to the possible elevation in thrombotic risk among third-generation COC users.
Footnotes
Declaration of Conflicting Interests
The authors declared no potential conflicts of interest with respect to the research, authorship, and/or publication of this article.
Funding
The authors disclosed receipt of the following financial support for the research, authorship, and/or publication of this article: supported by the Office of the Vice President for Research, University of Minnesota.