
Abstract
Introduction
Platelets have been implicated in the pathogenesis of cardiovascular disorders, including unstable angina, stroke, myocardial infarction, and sudden cardiac death.1–3 We suggest that platelet cholesterol (PC) may be an indicator of “tissue” cholesterol status in patients with vascular disease. However, the methods available so far to measure PC involve a complex extraction process and are time-consuming (eg, requiring differential centrifugation) 4 and therefore not suitable for multiple measurements. There are also safety issues since this process involves the use of flammable and potentially harmful chemicals (eg, methanol and chloroform).4–7 Therefore, developing a simpler and safer method to measure PC is important, especially if large numbers of samples need to be analyzed.
In the present study, we investigated if there was a correlation between PC and circulating low-density lipoprotein cholesterol (LDL-C) levels. Plasma LDL-C affects the function of blood cells, which play an important role in arteriosclerosis and its complications. 8 For example, plasma LDL-C may influence the aggregation of isolated platelets.9–12 Platelets possess receptors for plasma lipoproteins (oxidized and native LDL-C)13,14 and the binding of plasma LDL-C to these receptors induces a cascade of intracellular biochemical reactions resulting in platelet activation.15,16 Moreover, the lipid composition of platelets membranes is known to affect platelet activity.17,18 It has been shown that an excess in PC results in platelet hyperactivity and that there is a correlation with increased levels of PC and a decrease in plasma membrane fluidity.18,19
The aim of this study was to develop a simplified method to measure PC and assess the correlation between PC and serum LDL-C, high-density lipoprotein cholesterol (HDL-C), LDL-C/HDL-C ratio, triglycerides (TG), non-HDL-C (TC minus HDL-C), and serum total cholesterol (TC).
Methods and Participant Selection
General Methods
A main study population consisted of 47 healthy participants (23 males; 24 females; mean age 37 ± 9 years). No drugs affecting platelet function were taken in the 10 days preceding blood sampling. All participants participated after giving their informed consent. The study was approved by the University College London Ethics Committee.
Blood Collection and Serum Lipid Analysis
Whole blood was drawn by venepuncture after an overnight fast. Blood was obtained from an antecubital vein using a 21G needle with minimum stasis. For the determination of serum lipid analysis, 5 mL blood was collected in a serum gel tube, allowed to clot, and then centrifuged (2000 × g, 15 min at 4°C) collecting the supernatant for analysis of serum TC, LDL-C, TG, and HDL-C using a “Roche Modular P” system and the associated kits (Roche Diagnostics, Indianapolis). Our laboratory participates in the United Kingdom National External Quality Assessment Service (UK NEQAS) for all our lipid assays. This scheme provides a comprehensive worldwide service that enables laboratories to fulfill the quality goals. UK NEQAS comprises a network of schemes operating from a number of centers based at major hospitals, research institutions, and universities throughout the United Kingdom. The services cover qualitative and interpretative investigations in clinical chemistry along with a variety of other disciplines.
Serum HDL-C Measurement
We use an automated method for the direct determination of serum HDL-C based on polyethylene glycol (PEG)-modified enzymes and dextran sulphate. When cholesterol esterase and cholesterol oxidase enzymes are modified by PEG, they show selective catalytic activities toward lipoprotein fractions, with the activity increasing in the order: serum LDL-C < very low-density lipoprotein cholesterol 20 = chylomicrons < HDL-C.
In the presence of magnesium ions, dextran sulphate selectively formed water soluble complexes with serum LDL-C, VLDL, and chylomicrons, which were resistant to PEG-modified enzymes. The cholesterol concentration of serum HDL-C was determined enzymatically by cholesterol esterase and cholesterol oxidase coupled with PEG to the amino groups. Cholesterol esters were broken down quantitatively into free cholesterol and fatty acids by cholesterol esterase. In the presence of oxygen, cholesterol was oxidized to Δ4-cholestenone and hydrogen peroxide. With the presence of peroxidase, the hydrogen peroxide generated reacted with 4-amino-antipyrine and sodium N-(2-hydroxy-3-sulfopropyl)-3,-5-dimethoxyaniline (HSDA) and formed a purple-blue dye. The color intensity of this dye was directly proportional to the cholesterol concentration and was measured photometrically (Roche Modular analyzer).
Serum TG Measurement
Serum TG was determined by a method based on using a lipoprotein lipase from microorganisms for the rapid and complete hydrolysis of TG to glycerol, followed by oxidation to dihydroxyacetone phosphate and hydrogen peroxide. The hydrogen peroxide produced then reacted with 4-aminophenazone and 4-chlorophenol under the catalytic action of peroxidase and formed a red dyestuff. The color intensity of the red dyestuff formed was directly proportional to the TG concentration and was measured photometrically (Roche Modular analyzer).
Serum TC Measurement
The method to measure serum TC was based on the determination of Δ4-cholestenone after enzymatic cleavage of the ester by cholesterol esterase, conversation of cholesterol oxidase, and subsequent measurement by the Trinder reaction of the hydrogen peroxide formed. Optimization of the ester cleavage (>99.5%) allowed standardization with primary and secondary standards and a direct comparison with reference methods. Cholesterol was determined enzymatically using cholesterol esterase and cholesterol oxidase. Cholesterol esters were cleaved by the action of cholesterol esterase to yield free cholesterol and fatty acids. Cholesterol was converted by oxygen by cholesterol oxidase to cholest-4-en-3-one and hydrogen peroxide. The hydrogen peroxide created formed a red dyestuff by reacting with 4-aminophenazone and phenol under the catalytic action of peroxidase. The color intensity was directly proportional to the concentration of cholesterol and was determined photometrically (Roche Modular analyzer; test range 0.08-20.7 mmol/L).
Serum LDL-C
Serum LDL-C was estimated by the Friedewald equation
20
:

Blood Collection and Platelet Preparation for PC Measurement
A further 9 mL of blood was also collected in polystyrene tubes containing 3.8% tri-sodium citrate (9 parts blood to 1 part citrate)21–23 for the analysis of PC. This citrated sample was gently inverted to allow mixing without disrupting the platelets. It was then centrifuged at 150 g for 15 minutes (IEC Centra-7R refrigerated centrifuge; International Equipment Company, USA) to prepare platelet-rich plasma (PRP). Platelet-rich plasma was separated using a plastic Pasteur pipette to gently aspirate the top layer avoiding the “buffycoat” and the red cells. The PRP volume (mL) and count (10 9 /L) was measured (Coulter Counter Act diff) and recorded as this result was needed for the final calculation of the PC. The PRP was placed into “conical-bottomed” plastic tubes and again centrifuged at 300g for 30 minutes at 4°C. The platelet-poor plasma was poured off leaving a platelet pellet which was resuspended in 1-mL saline and then transferred to an Eppendorf tube.22,24,25 Platelet membrane disruption was achieved in 2 steps. First, the 1-mL saline solution containing the platelet pellet was put through 2 freeze (at −20°C) and thaw (room temperature) cycles. Then it was resuspended using a whirlimixer. The Eppendorf tube containing the “resuspended pellet” was then kept on crushed ice (to prevent the sample from heating up) and sonicated for 3 cycles, each for 10 seconds, at 30 amplitude microns using a probe Sonicator (M.S.E. Soniprep, Crawly, UK). This was based on previous experiments where platelet membrane disruption was achieved to allow serotonin release.26–29 It was important to resuspend the pellet in the smallest possible volume of saline that would allow a sonication process but will also be concentrated enough to allow PC measurement. During this sonication process care was taken to prevent “froth” formation but to still obtain a “clear pellet solution”28,29 that could be used for the analysis PC.
Platelet Cholesterol Measurement
Platelet cholesterol measurement was based on an enzymatic colorimetric test. The clear pellet solution (as prepared above) was added to a solution “R1” (CHOL, cholesterol CHOD-PAP; Roche Diagnostics, Indianapolis, Indiana). Cholesterol was determined enzymatically using cholesterol esterase and cholesterol oxidase. Cholesterol esters were cleaved by the action of cholesterol esterase to yield free cholesterol and fatty acids. Cholesterol was converted by cholesterol oxidase to cholest-4-en-3-one and hydrogen peroxide. The hydrogen peroxide created formed a red dyestuff by reacting with 4-aminophenazone and phenol under the catalytic action of peroxidase. The color intensity was directly proportional to the concentration of cholesterol and was determined photometrically (Roche Modular P system).
Repeatability
To determine the repeatability (ie, corresponding to within-run precision) of this PC method, 3 healthy participants were selected (2 males and 1 female). Blood was collected and prepared for PC measurement (as described below). Twenty successive PC measurements were carried out under the same conditions on the same day.
Reproducibility
To determine the closeness of agreement between results of measurements performed under changed conditions, in this case time (ie, corresponding to between-run precision), 2 participants were selected (1 male and 1 female). Blood was collected and prepared for PC measurement on 8 different days over a period of 2 months.
Statistical Analysis
Results are expressed as mean and ±SD. Correlations were assessed using nonparametric tests (Spearman, correlation coefficient). Significance was considered as P < .05 (2-tailed).
Results
Repeatability of PC Method
The within-run precision of PC carried out on 3 participants (20 times each) showed a mean coefficient of variation (CV) of 4.8% (4.2%, 4.6%, and 5.5%, respectively, for each participant).
Reproducibility of PC Method
The between-run precision of PC was carried out on 2 participants and assessed on 8 different days over 2 months. For participant 1, the PC method measured a CV of 8.9% with a mean of 426 ± 38 μmol/10 12 platelets. The CV of serum LDL-C was 7.5% with a mean of 3.5 ± 0.3 mmol/L. For participant 2, the PC method showed a CV of 8.1% with a mean of 371 ± 30 μmol/10 12 platelets. For the serum LDL-C, the CV was 5.6% with a mean of 3.6 ± 0.2 mmol/L.
The Reportable Range PC Method
The range observed with our PC method was between 173 and 830 μmol/10 12 platelets.
Study Population
The study population (n = 47) was split into 2 groups: Group 1: serum LDL-C < 2.6 mmol/L (n = 22) and Group 2: serum LDL-C > 2.6 mmol/L (n = 25). These serum LDL-C limits are those recommended by the National Cholesterol Education Program (NCEP) Adult Treatment Panel III (ATP III).30,31
Group 1
In group 1 (serum LDL-C < 2.6 mmol/L, n = 22, 6 males, 16 females, mean age 34 years) the mean PC was 412 ± 147 μmol/10 12 platelets with a median and 32 of 388 (173-830 μmol/10 12 platelets). There was no significant correlation between PC and serum LDL-C (1.93 ± 0.36 mmol/L), HDL-C (1.64 ± 0.45 mmol/L), LDL-C/HDL-C (1.24 ± 0.54 mmol/L), TG (1.18 ± 0.77 mmol/L), non-HDL-C (2.51 ± 0.48 mmol/L) or TC (4.15 ± 0.48 mmol/L). The mean value for serum lipid variables were LDL-C 1.93 ± 0.36, HDL-C 1.64 ± 0.45, LDL-C/HDL-C 1.24 ± 0.54, TG 1.18 ± 0.77, non-HDL-C 2.51 ± 0.48, and TC 4.15 ± 0.48 mmol/L (Tables 1 and 2 ).
Results Expressed as Mean ± SD for LDL-C (mmol/L); HDL-C (mmol/L); LDL-C/HDL-C Ratio; TG (mmol/L); Non-HDL-C (mmol/L) and TC (mmol/L) a
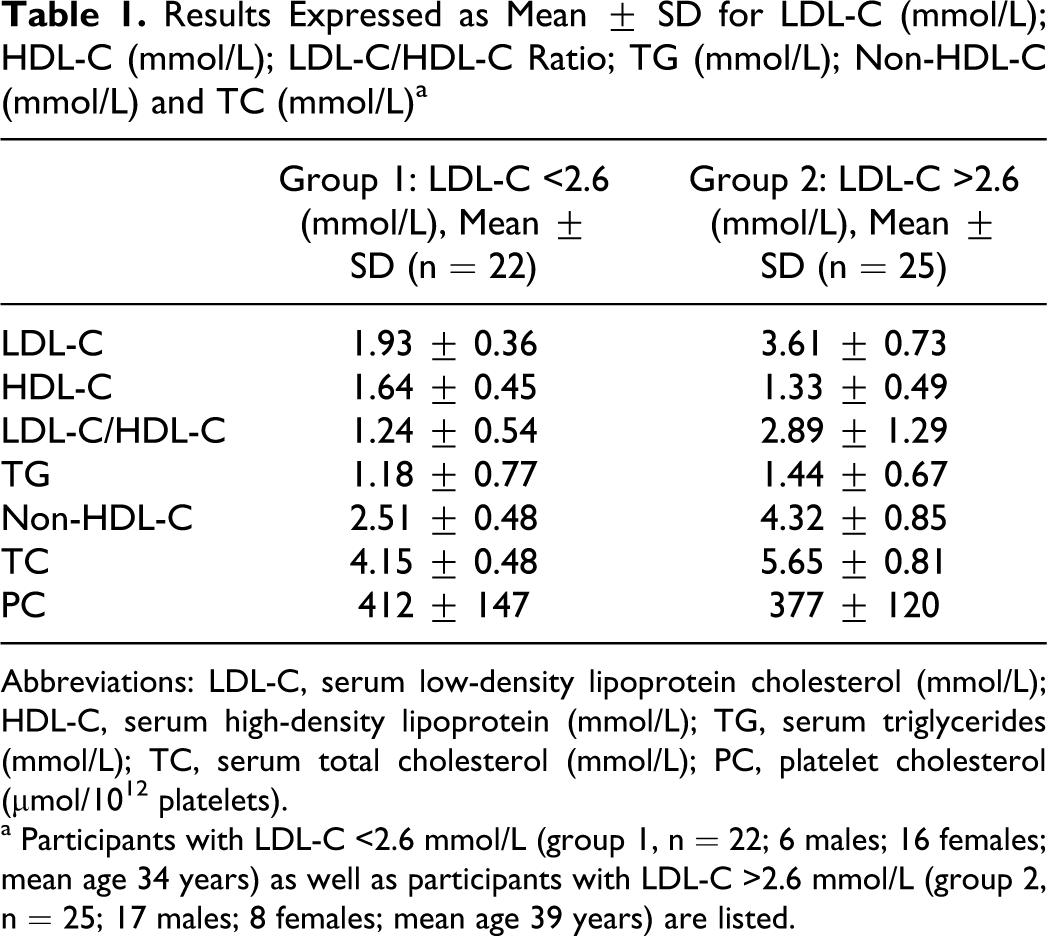
Abbreviations: LDL-C, serum low-density lipoprotein cholesterol (mmol/L); HDL-C, serum high-density lipoprotein (mmol/L); TG, serum triglycerides (mmol/L); TC, serum total cholesterol (mmol/L); PC, platelet cholesterol (μmol/1012 platelets).
a Participants with LDL-C <2.6 mmol/L (group 1, n = 22; 6 males; 16 females; mean age 34 years) as well as participants with LDL-C >2.6 mmol/L (group 2, n = 25; 17 males; 8 females; mean age 39 years) are listed.
Statistical Analysis (Non-Parametric Correlation, Spearman, Two Tailed) for Participants With LDL-C >2.6 mmol/L (Group 2; n = 25) a
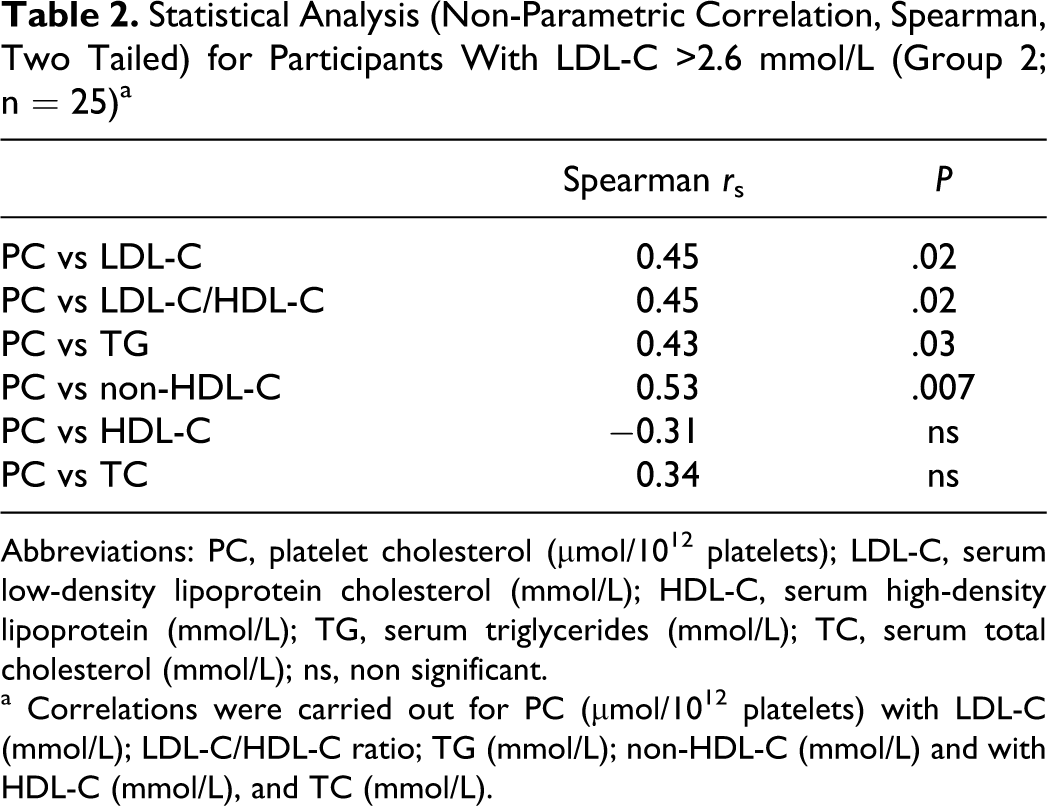
Abbreviations: PC, platelet cholesterol (μmol/1012 platelets); LDL-C, serum low-density lipoprotein cholesterol (mmol/L); HDL-C, serum high-density lipoprotein (mmol/L); TG, serum triglycerides (mmol/L); TC, serum total cholesterol (mmol/L); ns, non significant.
a Correlations were carried out for PC (μmol/1012 platelets) with LDL-C (mmol/L); LDL-C/HDL-C ratio; TG (mmol/L); non-HDL-C (mmol/L) and with HDL-C (mmol/L), and TC (mmol/L).
Group 2
In group 2, (serum LDL-C >2.6 mmol/L, n = 25, 17 males, 8 females, mean age 39 years) the mean PC was 377 ± 120 μmol/10 12 platelets. There was a positive correlation (r s = 0.45, P = .02) between PC and serum LDL-C. There was also a positive correlation between PC and serum LDL-C/HDL-C (r s = 0.45; P = .02), PC and TG (r s = 0.43, P = .03), and PC and non-HDL-C (r s = 0.53, P = .007). There was no significant correlation between PC and serum HDL-C (r s = −0.31) or between PC and serum TC (r s = 0.34). These results are illustrated in Figures 1–4. The mean value for serum lipid variables were LDL-C 3.61 ± 0.73, HDL-C 1.33 ± 0.49, LDL-C/HDL-C 2.89 ± 1.29, TG 1.44 ± 0.67, non-HDL-C 4.32 ± 0.85, and TC 5.65 ± 0.81 mmol/L (Tables 1 and 2).
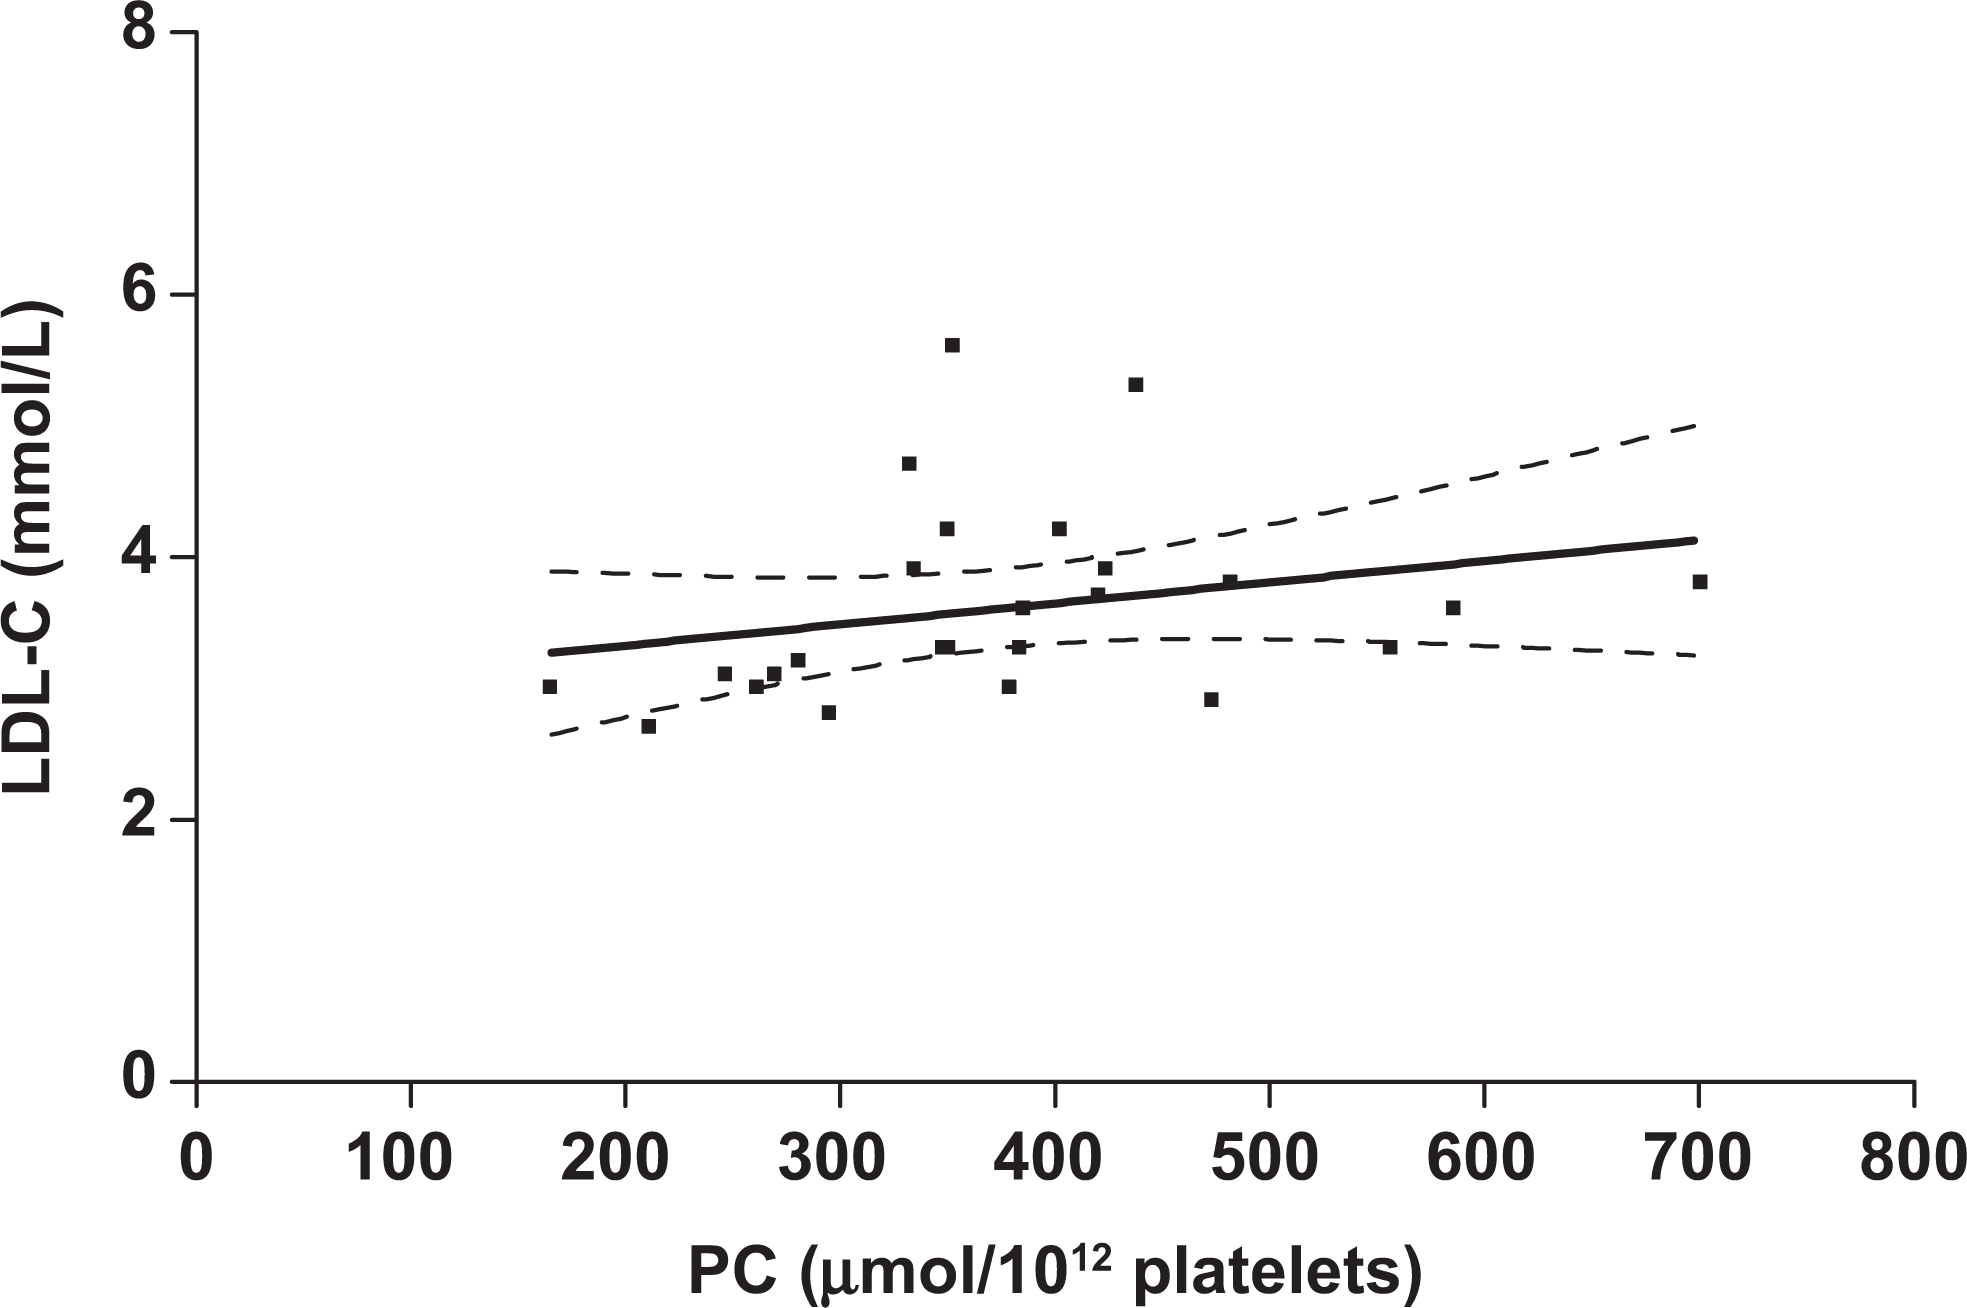
Relationship between platelet cholesterol (PC, μmol/10 12 platelets) and serum low-density lipoprotein cholesterol (LDL-C, mmol/L) in group 2. Spearman correlation coefficient = 0.45; P = .02; n = 25. The dashed lines represent 95% confidence intervals (CI).
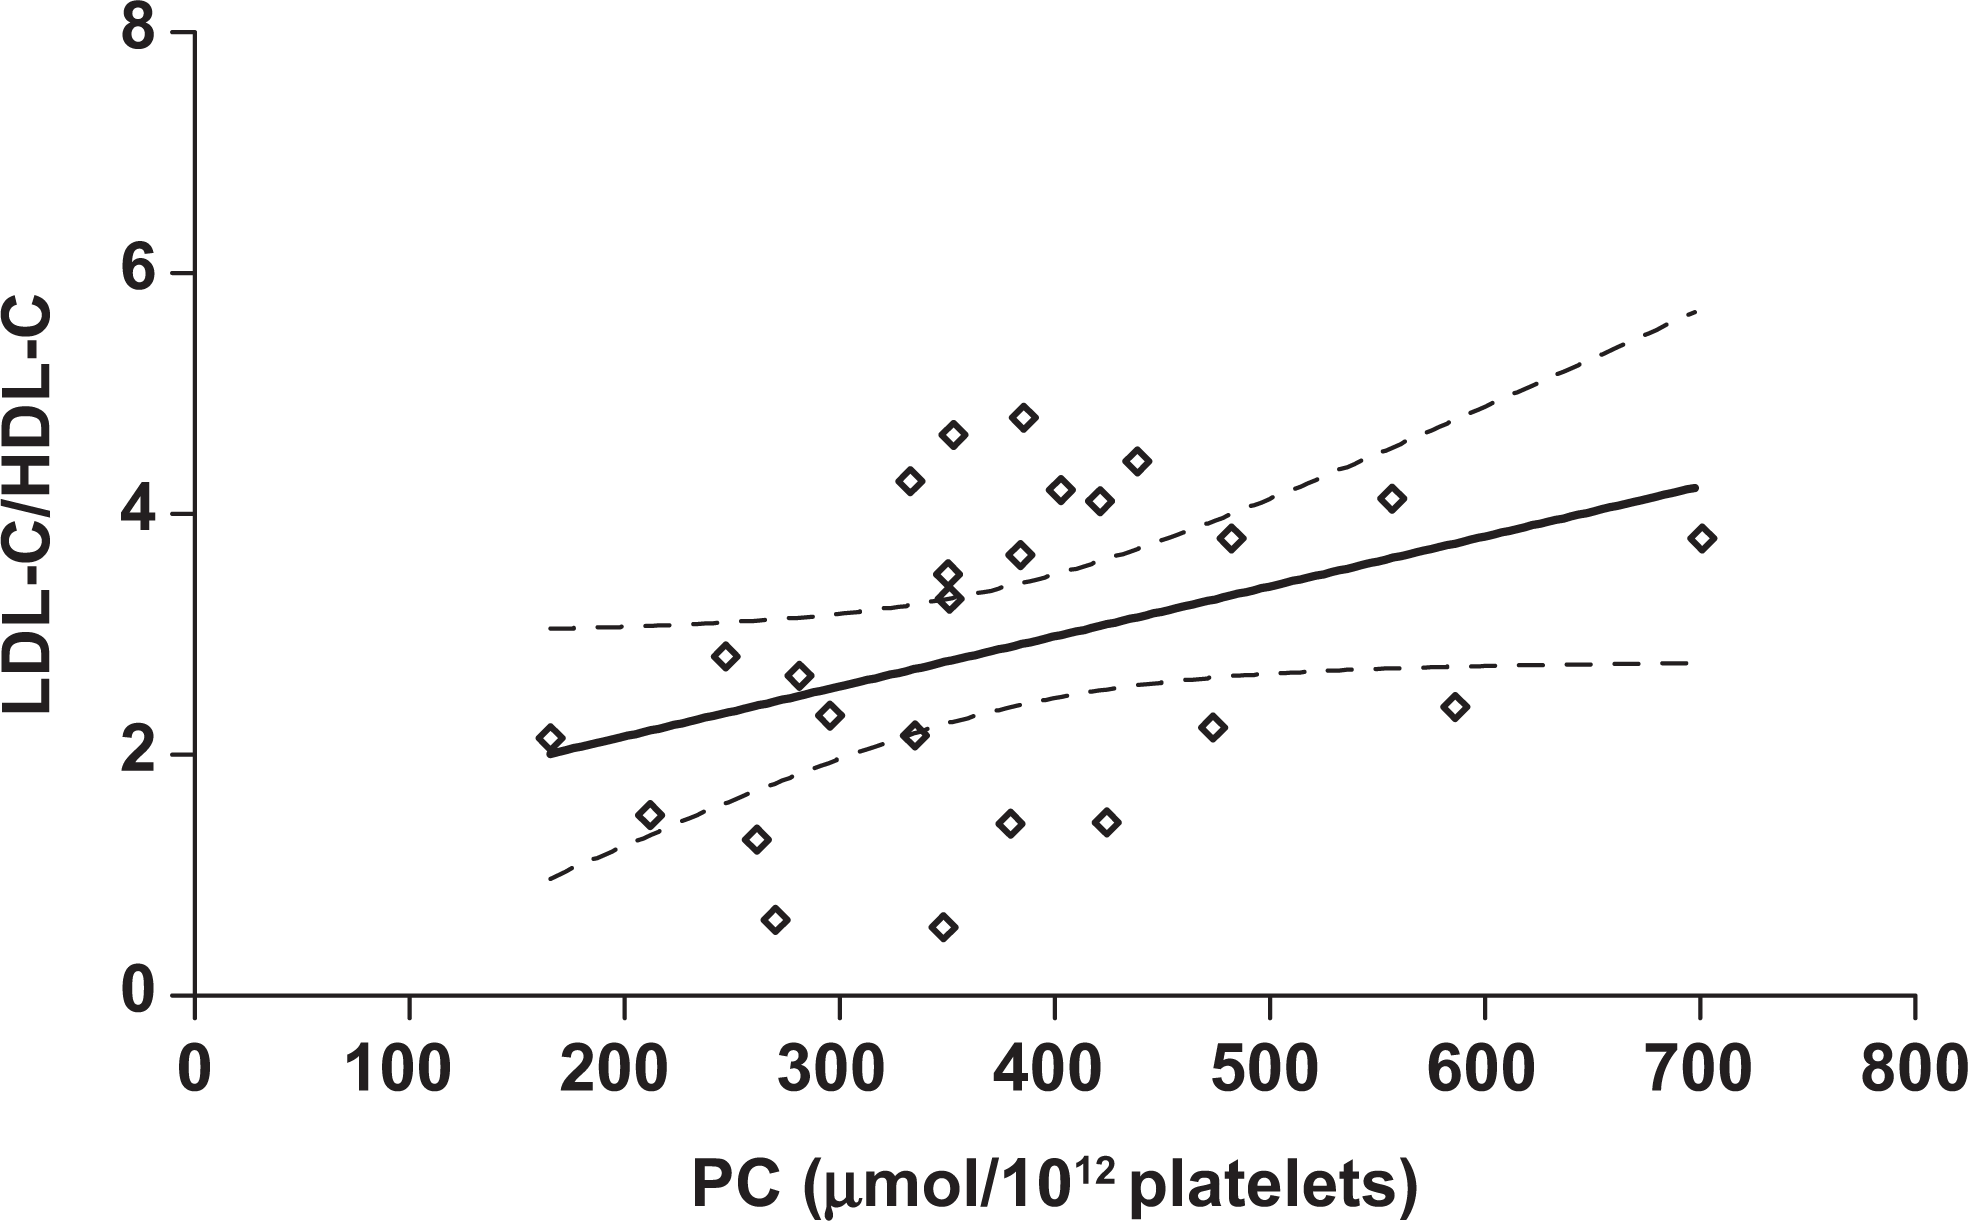
Relationship between platelet cholesterol (PC, μmol/10 12 platelets) and serum low-density lipoprotein cholesterol/high-density lipoprotein cholesterol ratio (LDL-C/HDL-C) in group 2. Spearman correlation coefficient = 0.45; P = .02; n = 25. The dashed lines represent 95% confidence intervals (CI).
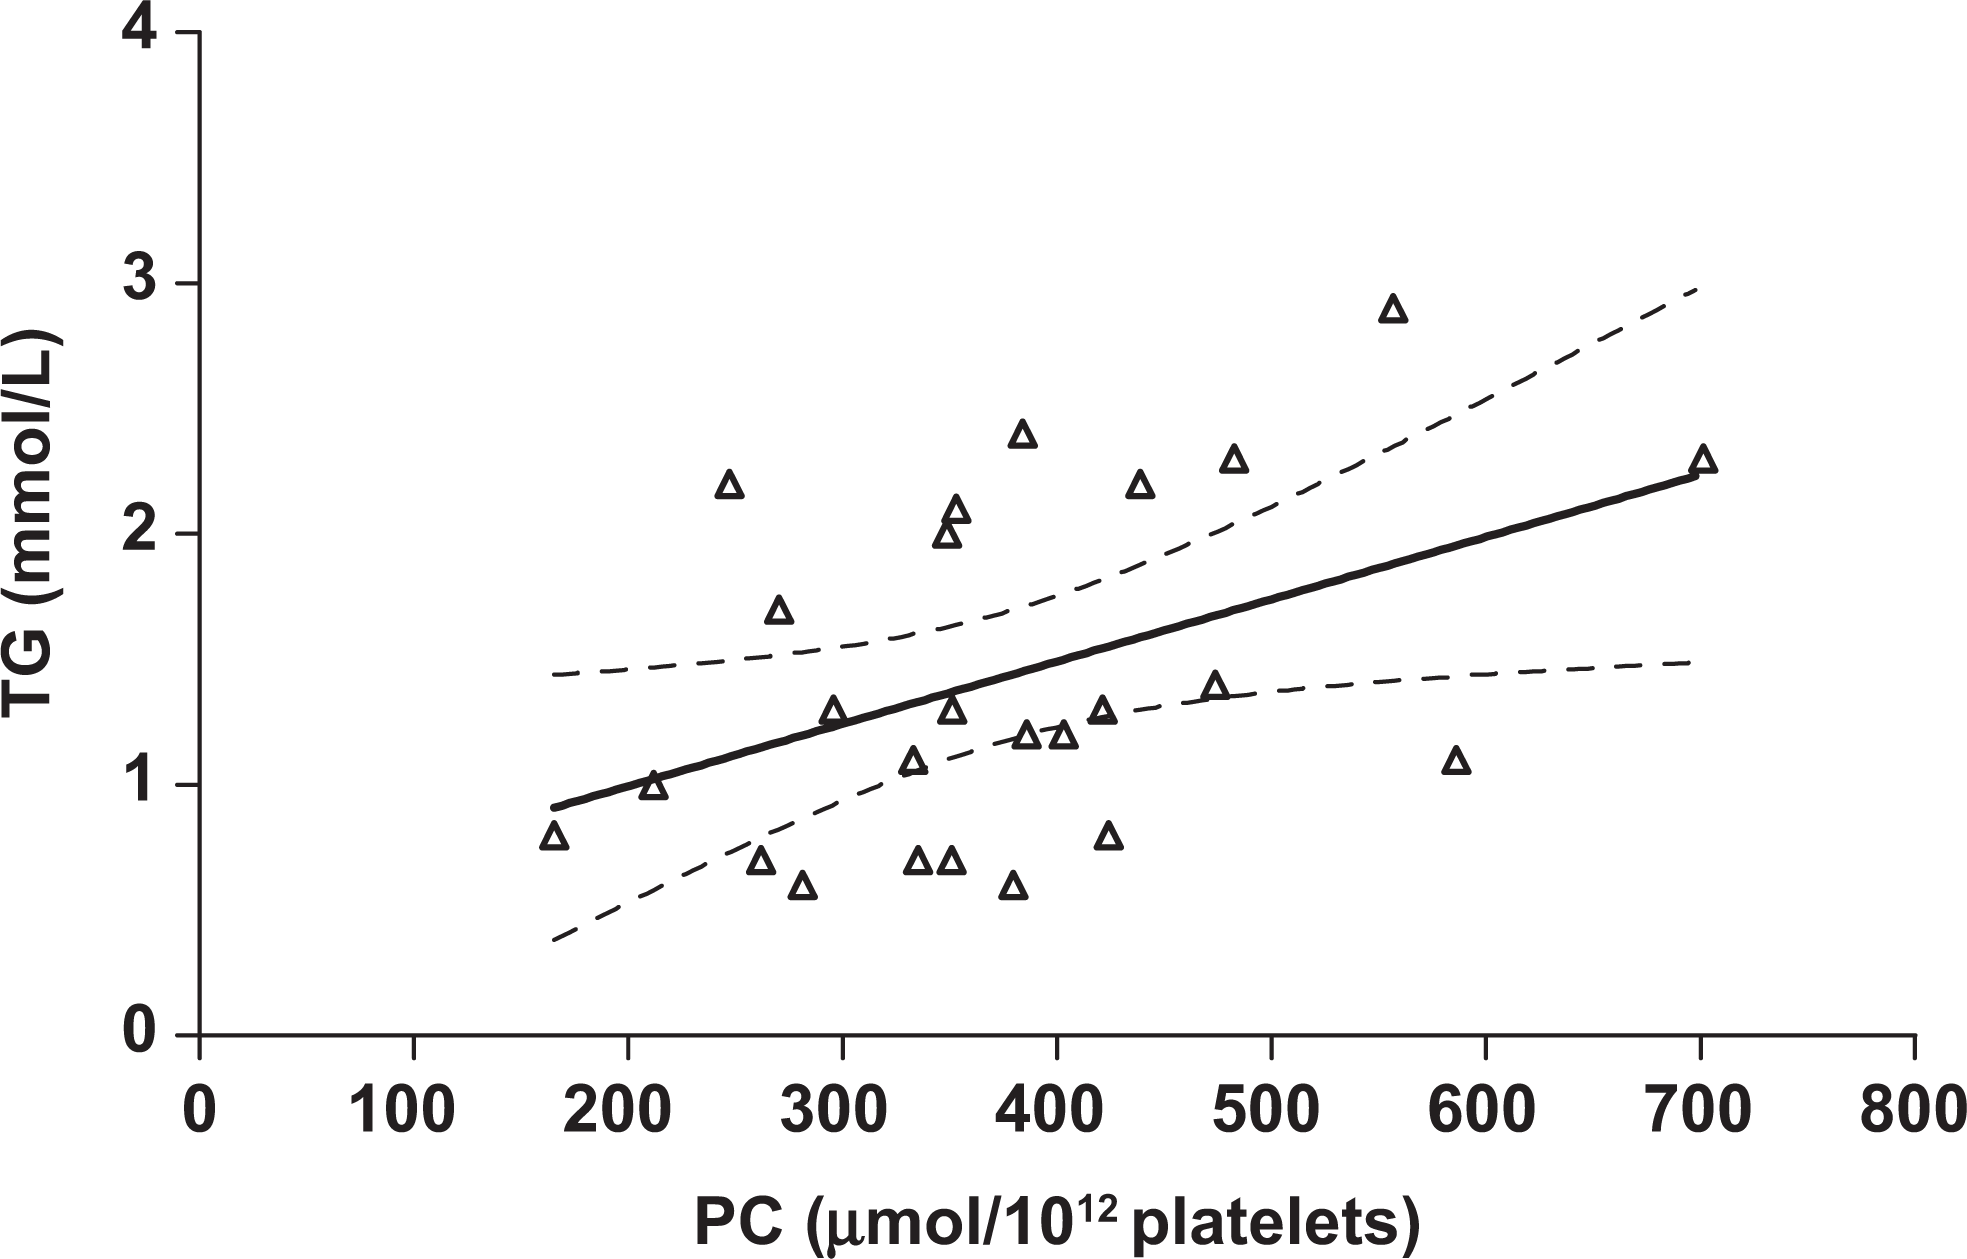
Relationship between platelet cholesterol (PC, μmol/10 12 platelets) and serum triglycerides (TG mmol/L) in group 2. Spearman correlation coefficient = 0.43; P = .03; n = 25. The dashed lines represent 95% confidence intervals (CI).
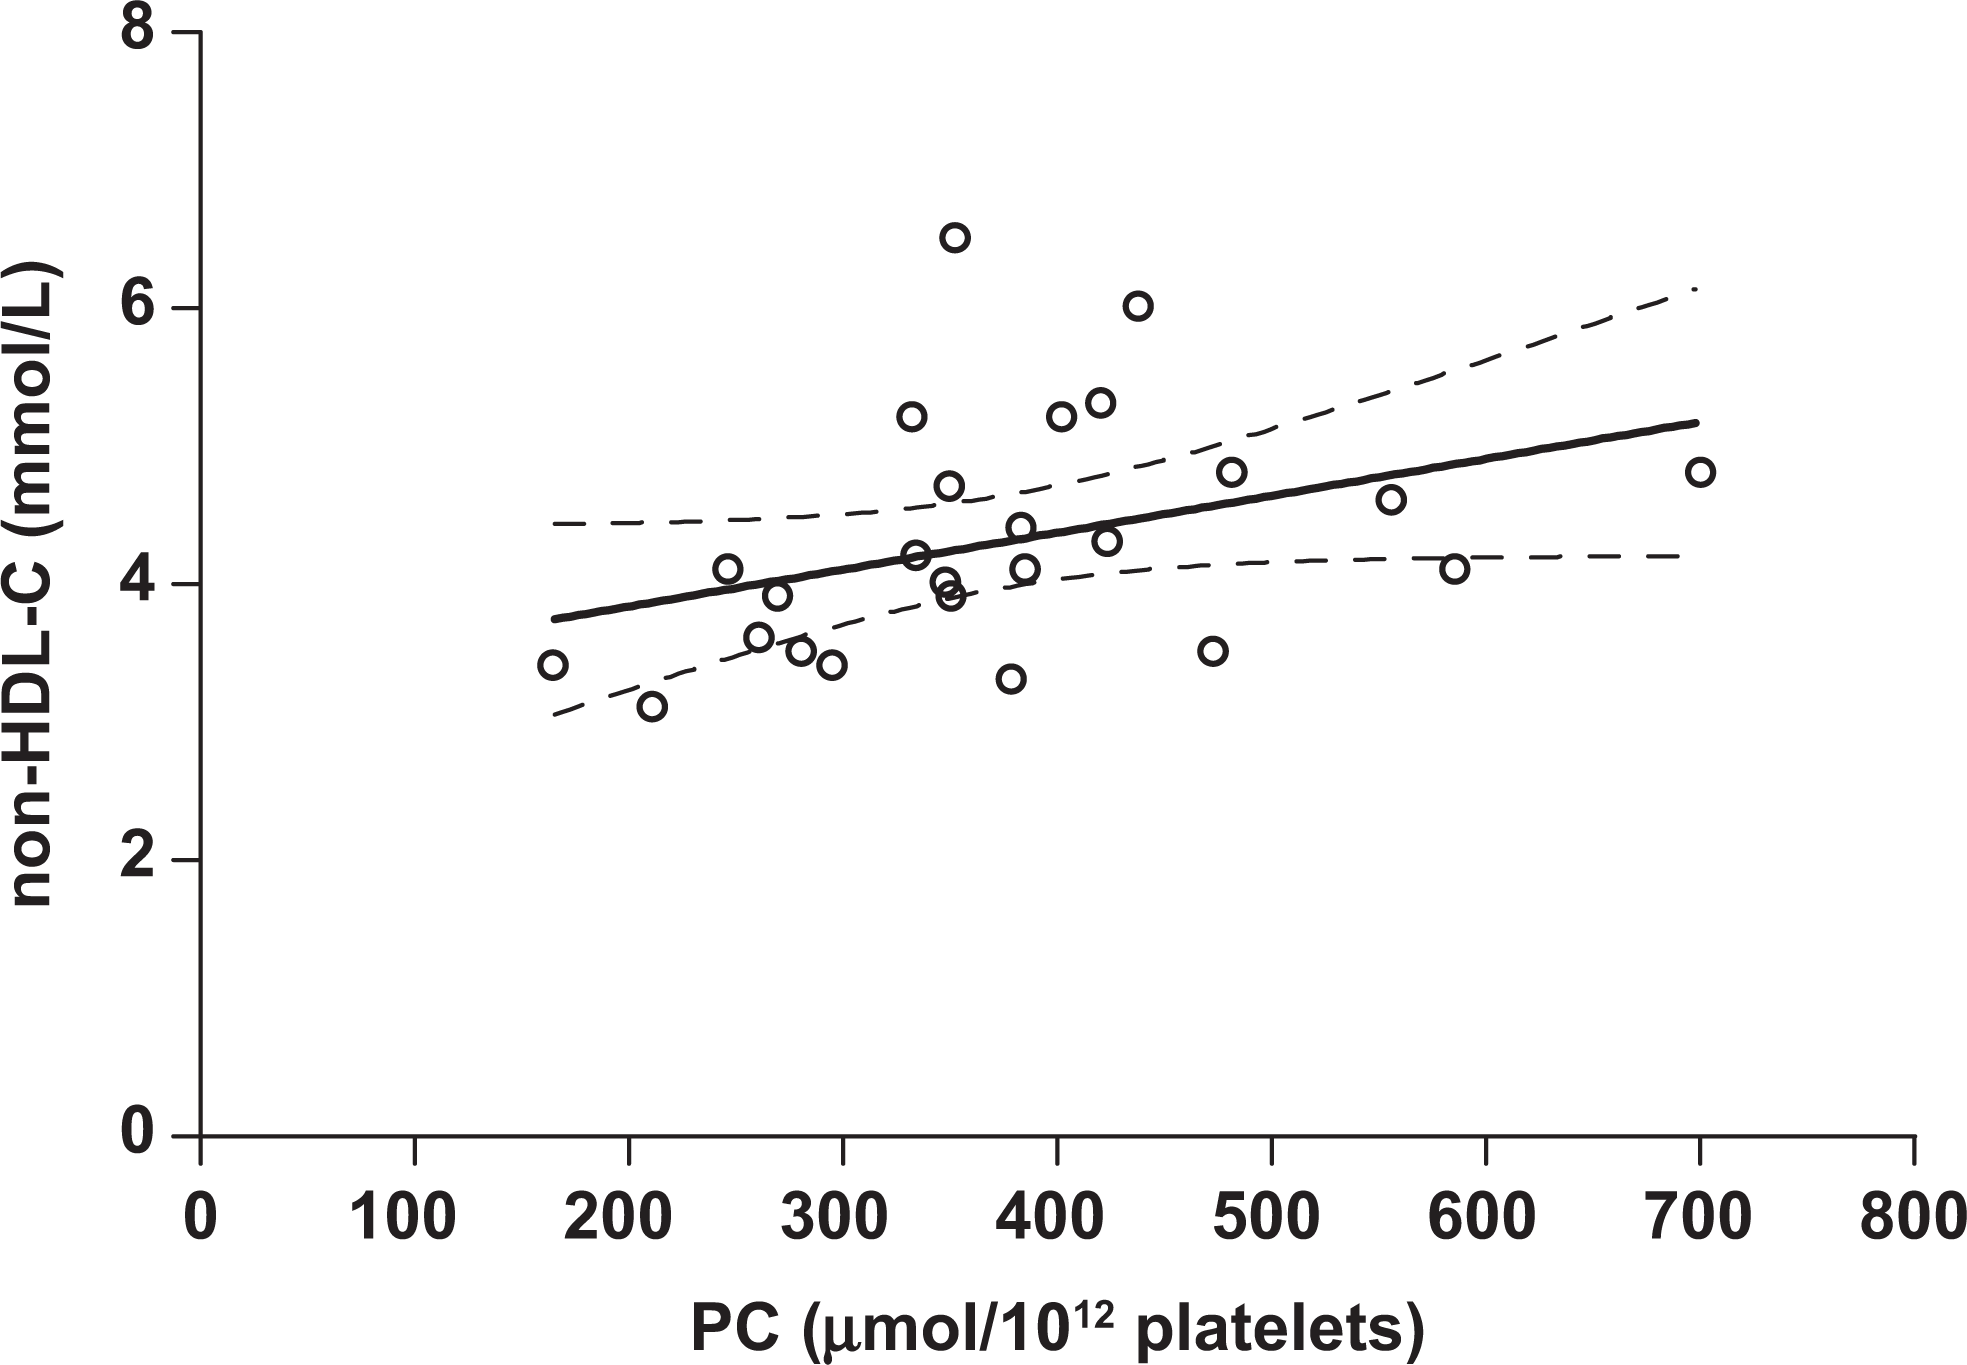
Relationship between platelet cholesterol (PC μmol/10 12 platelets) and serum non-high-density lipoprotein cholesterol (non-HDL-C, mmol/L) in group 2. Spearman correlation coefficient = 0.53; P = .007; n = 25. The dashed lines represent 95% confidence intervals (CI).
Discussion
We developed a simplified and less time-consuming method for the measurement of PC. This method is more suited to multiple measurements since complicated extraction methods as previously used are not involved.19,33,34 The PC levels we obtained using our technique were in agreement with those reported by others.35–39 However, this method needs to be further evaluated with a larger number of samples. Also, we found that it is limited by not being sensitive at lower serum LDL-C levels (ie, <2.6 mmol/L). We plan to evaluate this method in patients before and after treatment with statins.
We propose that PC could be used as a marker to assess “tissue” cholesterol status of patients with vascular disease. These patients tend to be on cholesterol-lowering drugs (eg, statins) that may have an effect on PC. Using an extraction method, Day et al 33 demonstrated that cell membrane cholesterol significantly decreased (4.19-3.52 fmol/cell) after treating 12 hypercholesterolemic patients for 6 weeks with simvastatin (20 mg/day). Moreover, a significant decrease in serum cholesterol (6.57 ± 1.26 mmol/L to 5.10 ± 0.42 mmol/L, P < .0001) and a nonsignificant decrease (0.755 ± 0.115 to 0.688 ± 0.098, P = .17) in the ratio of membrane cholesterol/total phospholipids (CH/PL) were found after 2 months of simvastatin (20 mg/day) therapy with 17 hypercholesterolemic patients. 34
It is well-documented that increased platelet activity is associated with hyperlipidemia.37,40 However, few studies have addressed platelet activation and hypercholesterolemia and the potential effect of lipid-lowering drugs on platelet activity. One group studied the effect of atorvastatin (20 mg/day) on platelet activation in hypercholesterolemic patients and found that after treatment platelet function was normalized and there was a reduced GPIIb/IIIa response to ADP. 40 These findings are in agreement with others who showed that platelets from hyperlipidemic patients are hypersensitive to aggregation, with greater thromboxane B2 (TXB2; the spontaneous breakdown product of TXA2) production and serotonin release induced by thrombin when compared with platelets from normolipidemic controls. 37
Our findings show that this PC method is reproducible and that PC levels were significantly correlated with serum LDL-C in participants whose LDL-C was >2.6 mmol/L. Furthermore, significant correlations were also found for serum LDL-C/HDL-C ratio, TG, and non-HDL-C. It is of interest that the strongest correlation was with serum non-HDL-C, which in some circumstances is superior to serum LDL-C in predicting cardiovascular risk. 41 These findings are in agreement with others who demonstrated a significantly higher platelet cholesterol ester in hyperlipidemic patients (with serum LDL-C 5.72 ± 1.16). 37 Their results also extended other findings where the levels of cholesterol and total PL in type II hypercholesterolemia were 80% and 60% higher, respectively, in platelet membranes in hypercholesterolemic participants compared with their control group. 42
We suggest that the increase in PC content may be sufficient to cause the increase in platelet responses observed by others, 37 since cholesterol affects platelet membrane fluidity. 43 Membrane lipid fluidity is a measure of the dynamic state of the membrane and is an important determinant of cell function.44,45 Moreover, lovastatin decreases plasma and PC levels and normalizes elevated platelet fluidity and aggregation in hypercholesterolemic patients. 35 Also, platelets from hypercholesterolemic patients had a higher molar ratio of CH to PL. 35 This corroborates the findings of others who also demonstrated increased molar ratio of CH to PL in hypercholesterolemic patients.18,46
Our method of measuring PC has a disadvantage of not being sensitive if participants have a lower circulating level of LDL-C (mean ± SD, 1.93 ± 0.36 mmol/L). However, these plasma levels of LDL-C are unlikely to require lipid-lowering treatment. This method also needs to be evaluated in larger numbers of participants or patients before and after the use of lipid-lowering drugs (eg, statins).
It is of interest that during our study 1 participant was found to be hypothyroid (not included in our results). Subsequently, he was treated with thyroid hormone replacement and became euthyroid. His pretreatment serum LDL-C, non-HDL-C, and PC were 5.4 mmol/L, 6.1 mmol/L, and 720 μmol/10 12 platelets, respectively. Corresponding posttreatment values (6 months) were 2.9 mmol/L, 1.9 mmol/L, and 474 μmol/10 12 platelets, respectively. Thus, there was a decrease by 46.3% in serum LDL-C, 68.9% in non-HDL-C, and 34.2% in PC.
In conclusion, this new technique of measuring PC has the advantage over previously used methods in that it is reproducible, rapid, safe, and simple. Thus, it may be useful for multiple sampling when investigating changes in PC in hypercholesterolemic patients. Whether any difference in PC represents changes in other tissues remains to be established.
Footnotes
The author(s) declared no conflicts of interest with respect to the authorship and/or publication of this article.
The author(s) received no financial support for the research and/or authorship of this article.