
Abstract
Systemic vascular changes contribute to both the pathogenesis and thrombotic comorbidities of end-stage renal disease (ESRD). This study aims to profile various biomarkers and better understand their role in the pathogenesis of ESRD. Plasma samples from 49 patients with ESRD and 56 control individuals were analyzed for markers for inflammation, specifically C-reactive protein (CRP), tumor necrosis factor receptor 1 (TNFR1), neutrophil gelatinase-associated lipocalin (NGAL); thrombomodulin (TM); neuron-specific enolase (NSE), and thrombosis-
Introduction
Atherosclerosis accounts for over 60% of mortality in chronic renal failure (CRF).1–3 This includes both cardiovascular and cerebrovascular comorbidities. Inflammation is known to be a factor in atherosclerosis and its thromboembolic sequelae. Leukocytosis, as well as other markers of inflammation, has been shown to be a risk factor for initial cardiovascular and cerebrovascular events, 4 as well as recurrent events. 5 Inflammatory markers are predictors of mortality from these thromboembolic events. 6
Leukocytes promote atherosclerotic changes via their activation and production of inflammatory mediators. These substances then cause changes in the vascular endothelium, platelets, and other circulating substances that initiate molecule adhesion and coagulation.
7
There are many systemic diseases that lead to end-stage renal disease (ESRD), for example diabetes, hypertension, and autoimmune diseases such as lupus. An inflammatory state has been associated with all these systemic diseases and ESRD,
1
but the profiling of several mediators such as neuron-specific enolase (NSE), tumor necrosis factor receptor 1 (TNFR1),
C-Reactive Protein
C-reactive protein is a member of pentraxin family of proteins with an approximate molecular mass of 118000 kDa. 9 It is an acute-phase reactant whose synthesis in the liver is regulated by interleukin-6 and other inflammatory cytokines. 10 C-reactive protein is known to be elevated in patients with CRF, especially patients on dialysis,1,11 and also been shown to be positively associated with both ischemic heart disease 12 and cerebrovascular disease. 13
Neutrophil Gelatinase-Associated Lipocalin
Neutrophil gelatinase-associated lipocalin is a 25-kDa member of the lipocalin protein family, which is secreted from specific granules of neutrophils.8,14 Upregulation of NGAL expression is thought to be the result of interactions between inflammatory cells and the vascular endothelium. 15 Studies looking at NGAL expression in various human tissues postulate that NGAL may play a role in apoptosis. 16
It has also been suggested that NGAL may represent a biomarker of early ischemic renal injury, both in terms of kidney damage as well as endothelial activation, which would be applicable in ESRD. 17 Other studies demonstrate that exogenous NGAL in early renal injury decreases cell death. 18 Several studies report that upregulation of NGAL is predictive of severity of injury in acute renal failure. 19 One study has shown that NGAL is positively correlated with progression of chronic kidney disease (CKD). 20 However, limited data is available on its role in ESRD and its association with ESRD complications.
Soluble TNF-α Receptor1
Tumor necrosis factor receptor 1 is a soluble form of the TNF receptor I which represents the extracellular domain of the protein. Tumor necrosis factor receptor 1 is released into the circulating plasma during inflammation. Tumor necrosis factor α is known to be elevated in chronic renal failure. 1 It is also associated with increased risk of myocardial infarction and death due to an MI. 21 Some studies suggest that TNF receptors may actually be better plasma markers than TNF-α alone. 22
Neuron Specific Enolase
Neuron-specific enolase, an isozyme of enolase, is a dimeric glycolytic enzyme that converts 2-phosphoglycerate to phosphoenolpyruvate. 23 It is a tumor marker of neuroendocrine and neuronal origin, and thus is a useful marker for neuronal damage of various etiologies, including cerebrovascular disorders such as stroke. 24 It has been noted that NSE levels in the serum correlate with cerebrospinal fluid (CSF) levels, as well as the amount of infarcted tissue and duration of ischemia in patients with stroke.25,26
D-Dimer
Thrombomodulin
Thrombomodulin is an endothelial protein that converts circulating plasma protein C into an active protease. Activated protein C is important in maintaining anticoagulation via the breakdown of activated clotting factors. Thrombomodulin also binds to thrombin which inhibits thrombin’s procoagulant effect. Thrombomodulin is present in the endothelium of vessels in all human tissues, excluding the brain.28,29 It has been well documented that TM is released during endothelial damage in diseases such as stroke and MI. 30 A soluble form has also been isolated from human plasma and urine. 31
Objectives
The purpose of this study is to profile the aforementioned analytes in patients with ESRD compared to a group of normal individuals. This information will be of interest in understanding of the pathophysiology of ESRD and its propensity for thromboembolic complications. It may also help to risk stratify patients with regard to complications of ESRD and have an impact on improving therapeutic approaches.
While most of these assays are commonly carried out separately utilizing ELISA-based methods, a new biochip-array technology is used to profile the markers of these patients. With the introduction of this biochip-array, it is possible to simultaneously measure multiple markers from a single patient, using only a small amount of plasma. This will have implications on the practical aspect of biomarker profiling in the future.
Materials and Methods
Sample Collection
Forty-nine patients with ESRD who undergo dialysis three times per week at an outpatient facility were selected for this study after informed consent. This study was approved by the Loyola University Internal Review Board for human participants. Plasma samples were collected in citrated tubes from each patient prior to hemodialysis. Control samples were also collected from 56 volunteers with no known kidney disease in the same fashion. Each sample was centrifuged at 3000 rpm for 20 minutes, and then stored at –70°C until the samples were analyzed.
Biomarker Analysis
All samples were analyzed using the Randox Evidence Investigator, which is a recently developed biochip array technology that utilizes a chip containing multiple discrete test regions of immobilized antibody to simultaneously quantify multiple markers from a small quantity of patient plasma (Randox Laboratories Ltd, Crumlin, United Kingdom). The Randox system offers a unique approach for the profiling of inflammatory and hemostatic markers. This system uses a chemiluminescent assay based on the light signal generated from each test region of the biochip, which is captured by a camera and analyzed using digital imaging technology. The signal is then compared to a calibrator constructed for each parameter. Each sample was run on the CRB II biochip according to the Randox protocol. The chips were imaged utilizing the Randox Evidence Investigator and raw data for the concentration of each analyte were obtained.
Statistical Analysis
Levels of each marker were collected for both patients with ESRD and control samples. Mean, range, standard deviation, and standard error of the mean were calculated. The data was then statistically analyzed using a 2-tailed Mann-Whitney U test with Gaussian approximation. This yielded a P value and 95% confidence interval for each variable.
Results
All 6 markers (TNFR1, TM, NGAL, NSE, CRP, and DD) showed an upregulation in ESRD compared to the control group. Table 1 shows the data obtained for each marker in both the ESRD group (left column) and the control group (middle column). The comparison between groups and its statistical significance is shown in the right-hand column. In Figure 1 , the mean for each marker is graphed, with the error bars representing standard error of the mean.
Various Marker Levels in ESRD and Control Patients
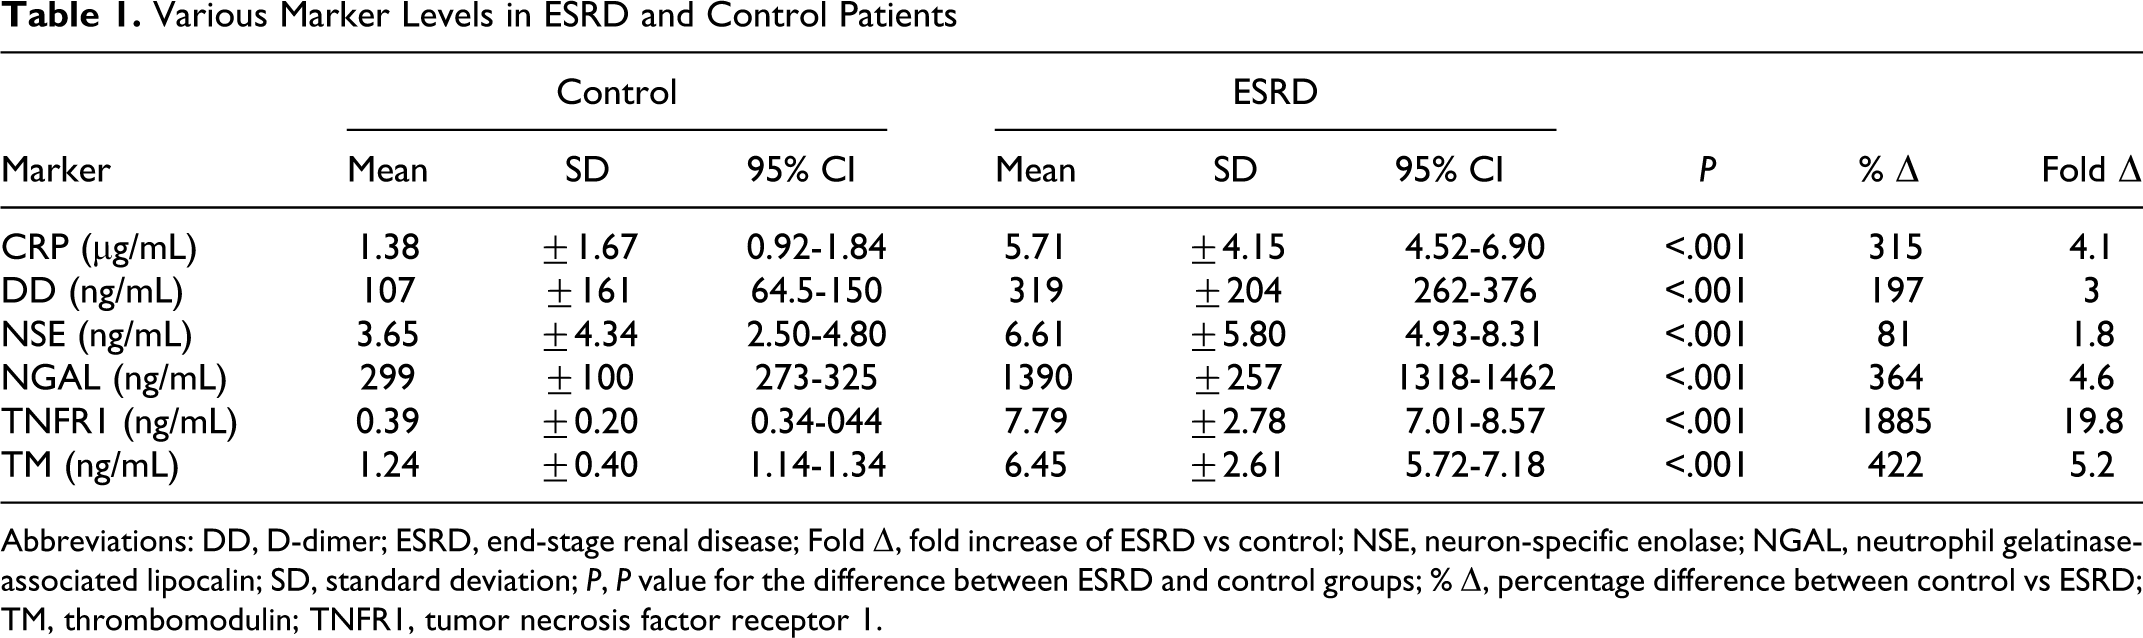
Abbreviations: DD,
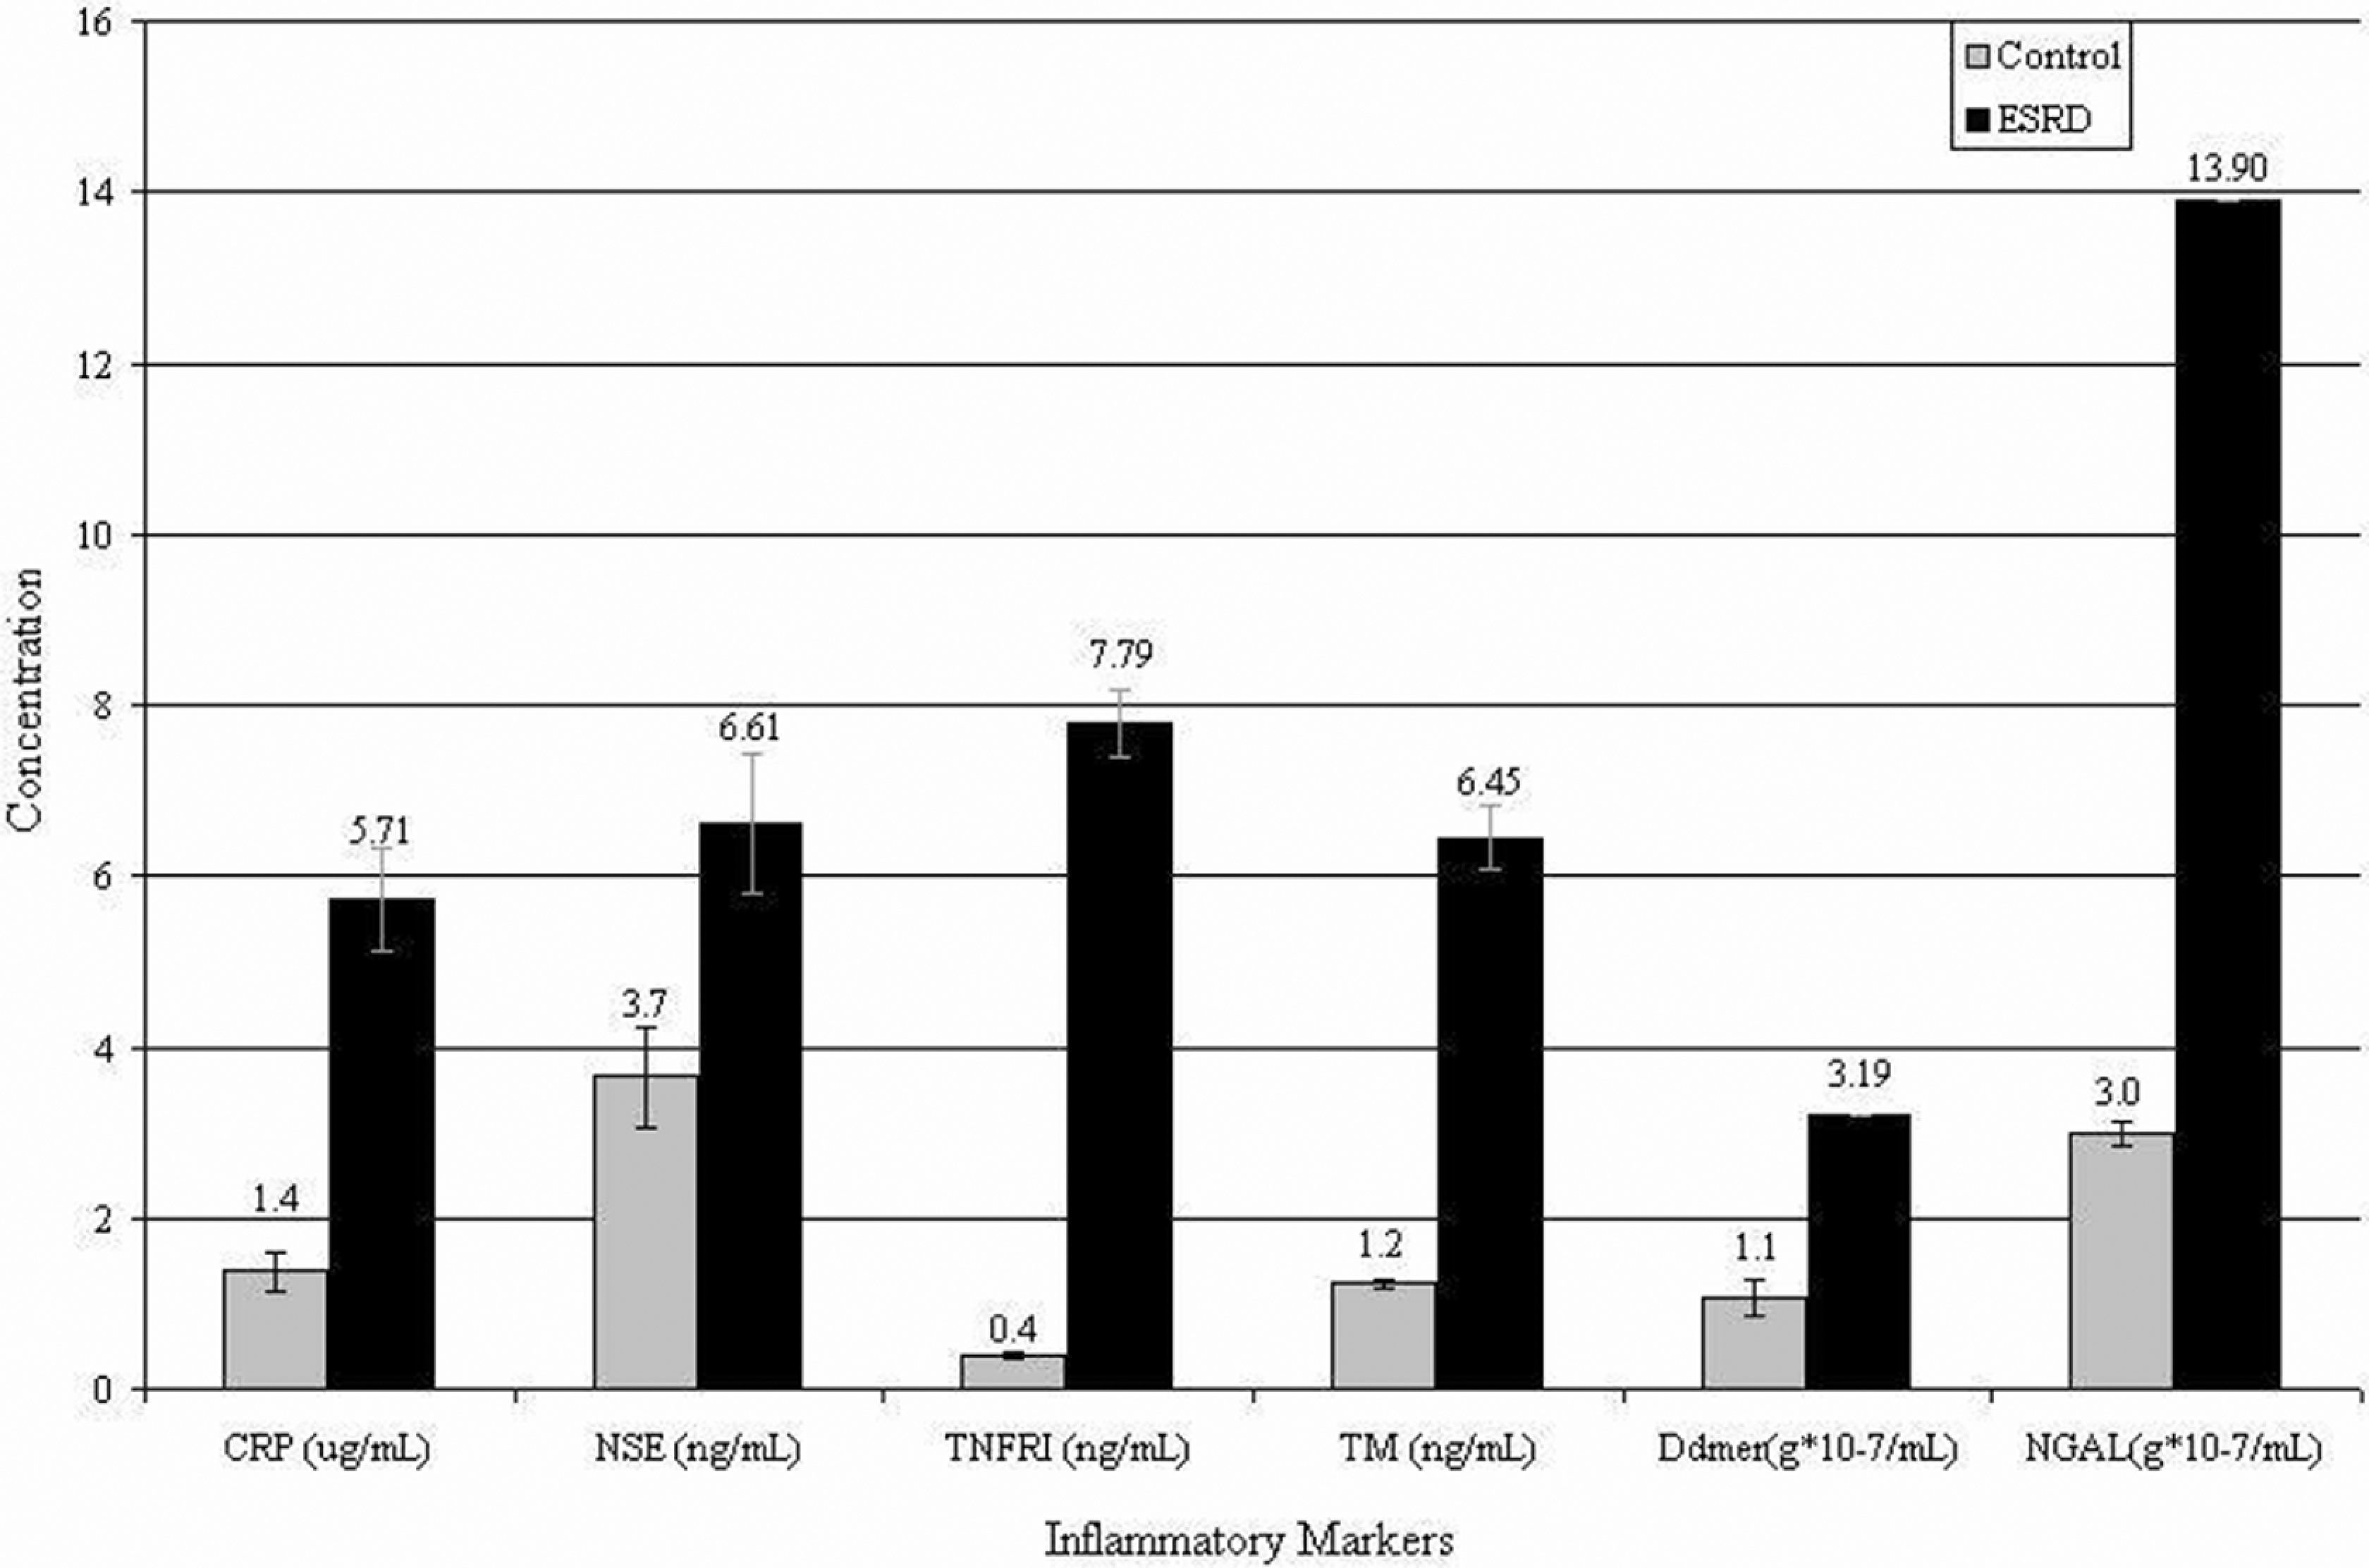
Inflammatory marker levels in end-stage renal disease (ESRD) and control. The mean for the concentration of each marker level in both ESRD and control patients (numerical values shown) is demonstrated. The error bar represents the standard error of the mean. The most upregulation is seen in tumor necrosis factor receptor 1 (TNFR1), thrombomodulin (TM) and neutrophil gelatinase-associated lipocalin (NGAL).
Tumor necrosis factor receptor 1 showed the greatest difference compared to the control group with a 19.8-fold increase. The value for each patient sample, both ESRD and control, is represented as scatter points in Figure 2 . The ovals represent grouping of scatter to denote a cluster and are generated using Microsoft Excel software. There was a wide range of values obtained in the patients ESRD (0.77 to 13.67). In addition, the control group exhibited both very low levels and a narrow range of values (0.0 to 0.99).
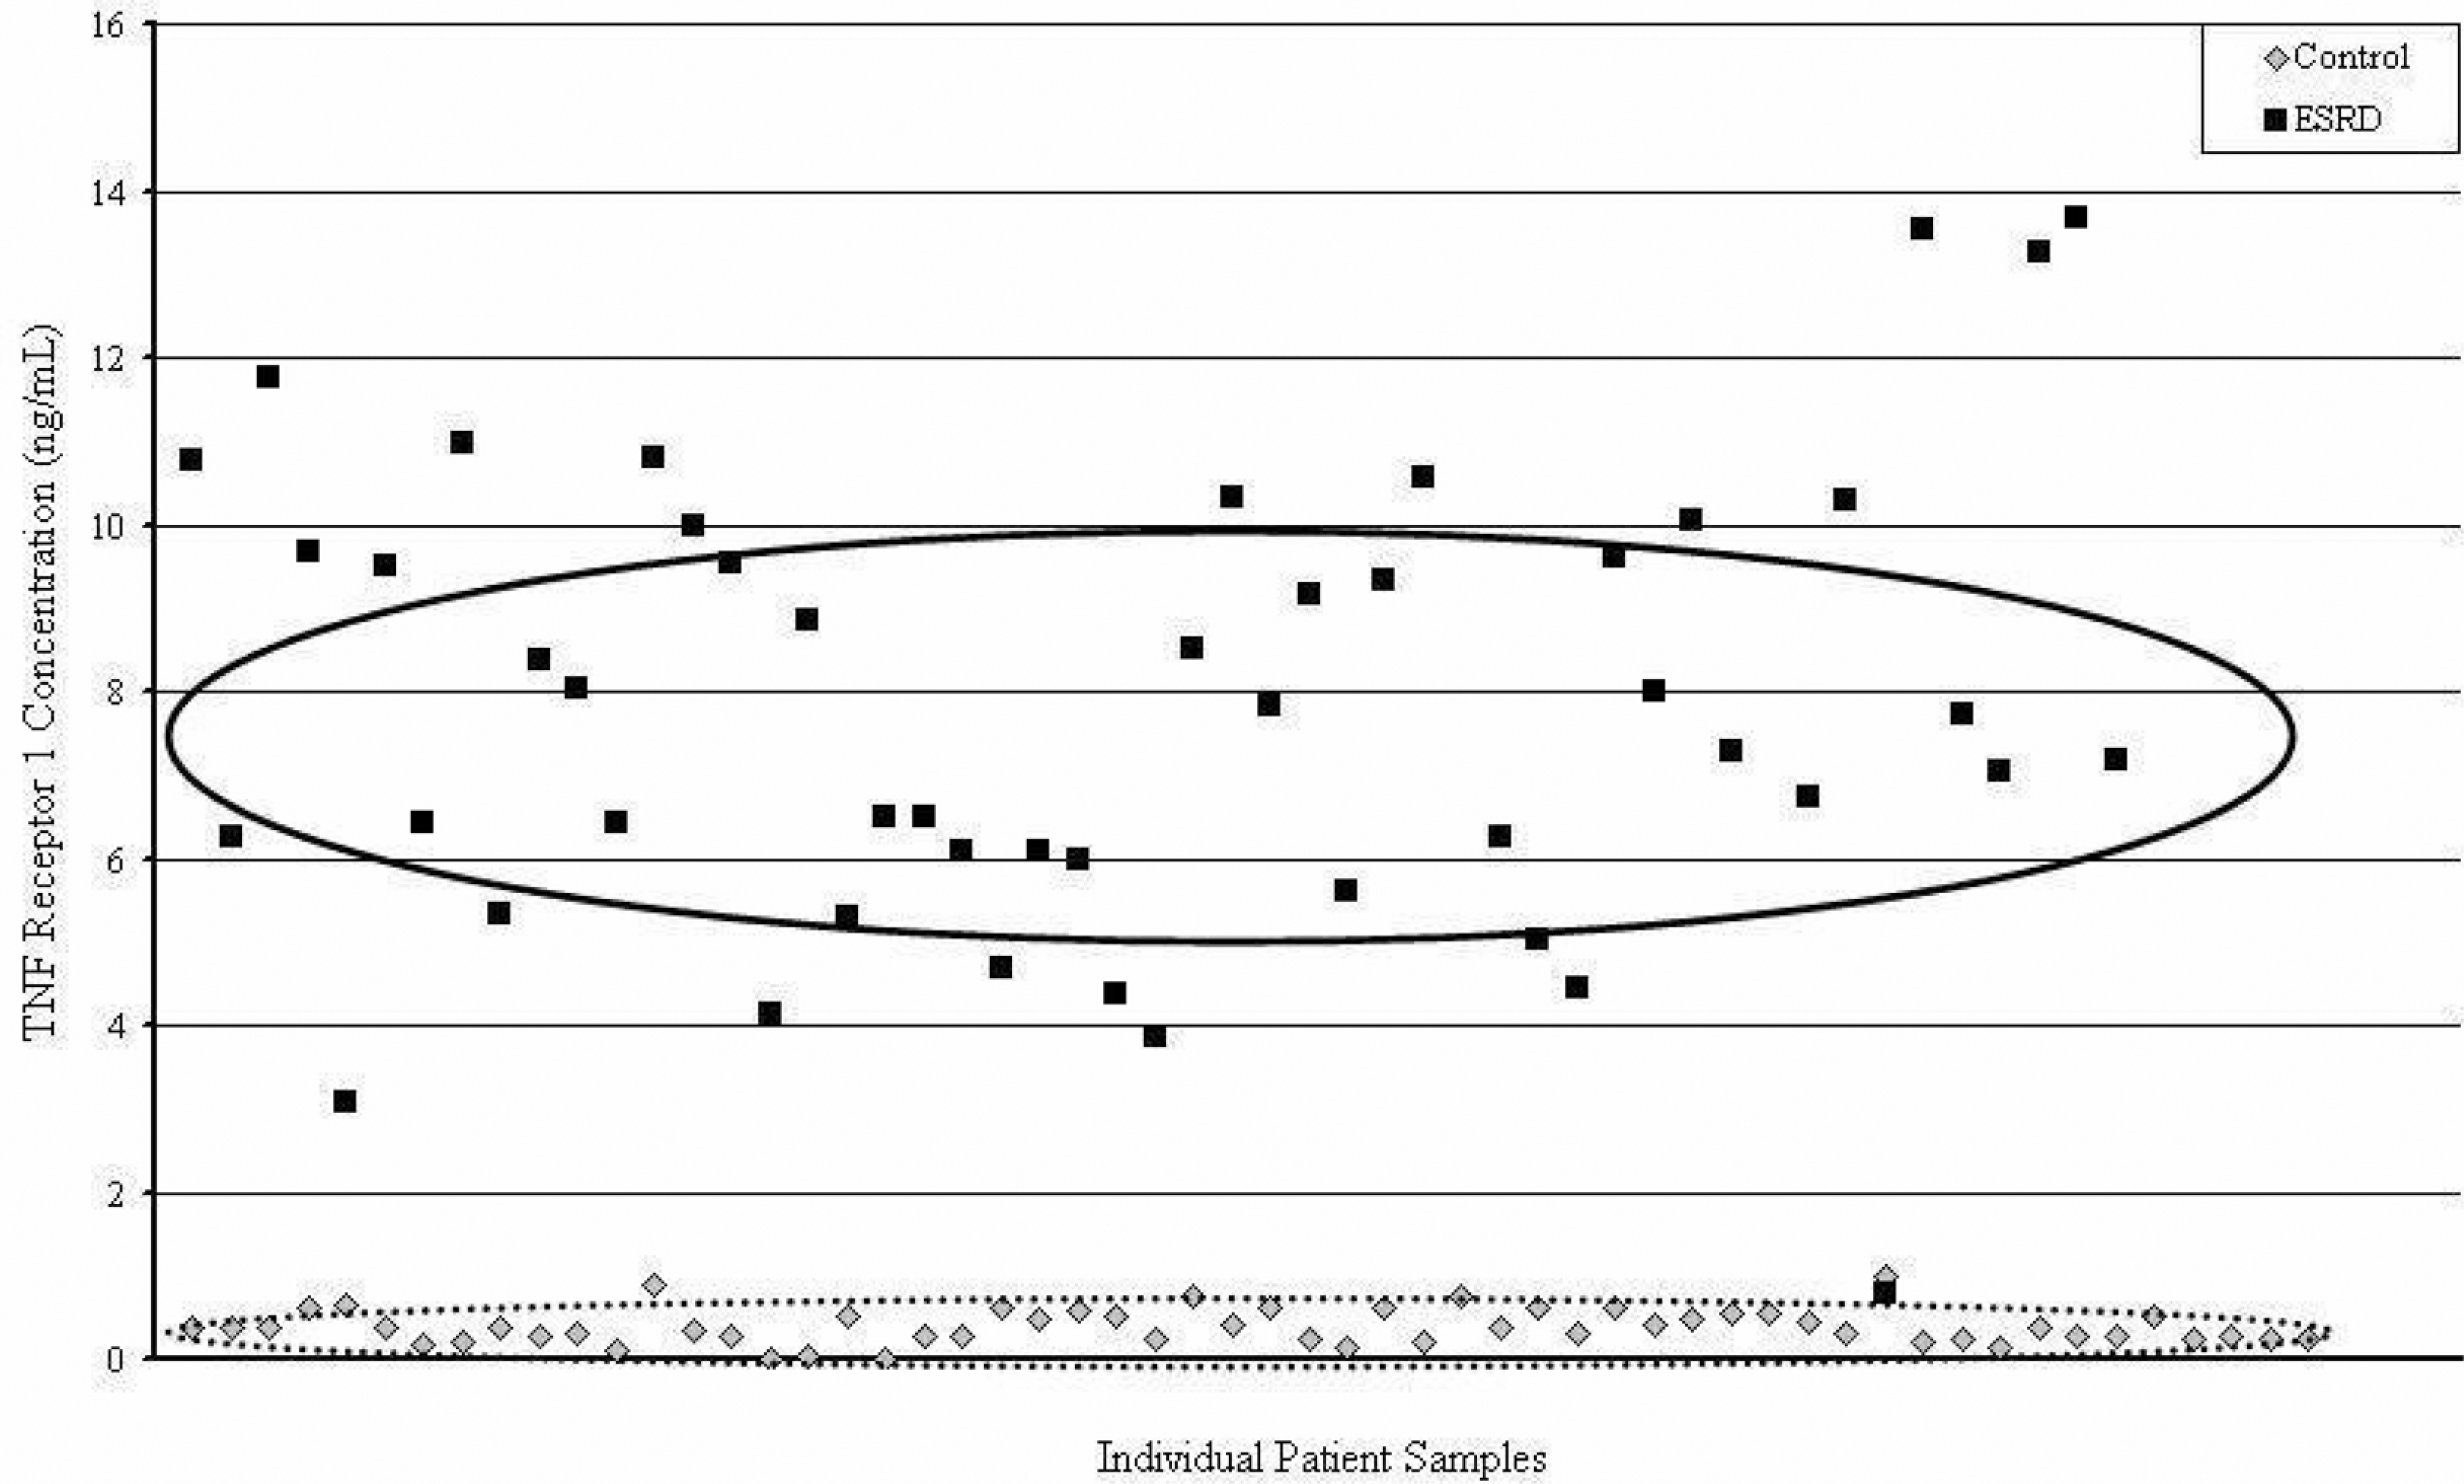
TNF Receptor 1 Concentration in end-stage renal disease (ESRD) and control. The vertical axis plots the concentration of tumor necrosis factor receptor 1 (TNF1) in both ESRD and control patients. Each patient sample is plotted randomly along the horizontal axis. Ovals represent the area of the mean ± standard deviation. Clear upregulaiton of TNFRI is seen here with heterogeneity among patients with ESRD, but also with distinct separation from the control group.
Thrombomodulin and NGAL were also increased 5.2-fold and 4.6-fold, respectively (Table 1). Similar to TNFR1, individual TM levels were quite heterogeneous among the patients with ESRD (Figure 3 ), with levels ranging from 0.73 to 14.09 ng/mL. However, NGAL was more variable among the control group (115 to 603) and less so among the ESRD group (406 to 1729).
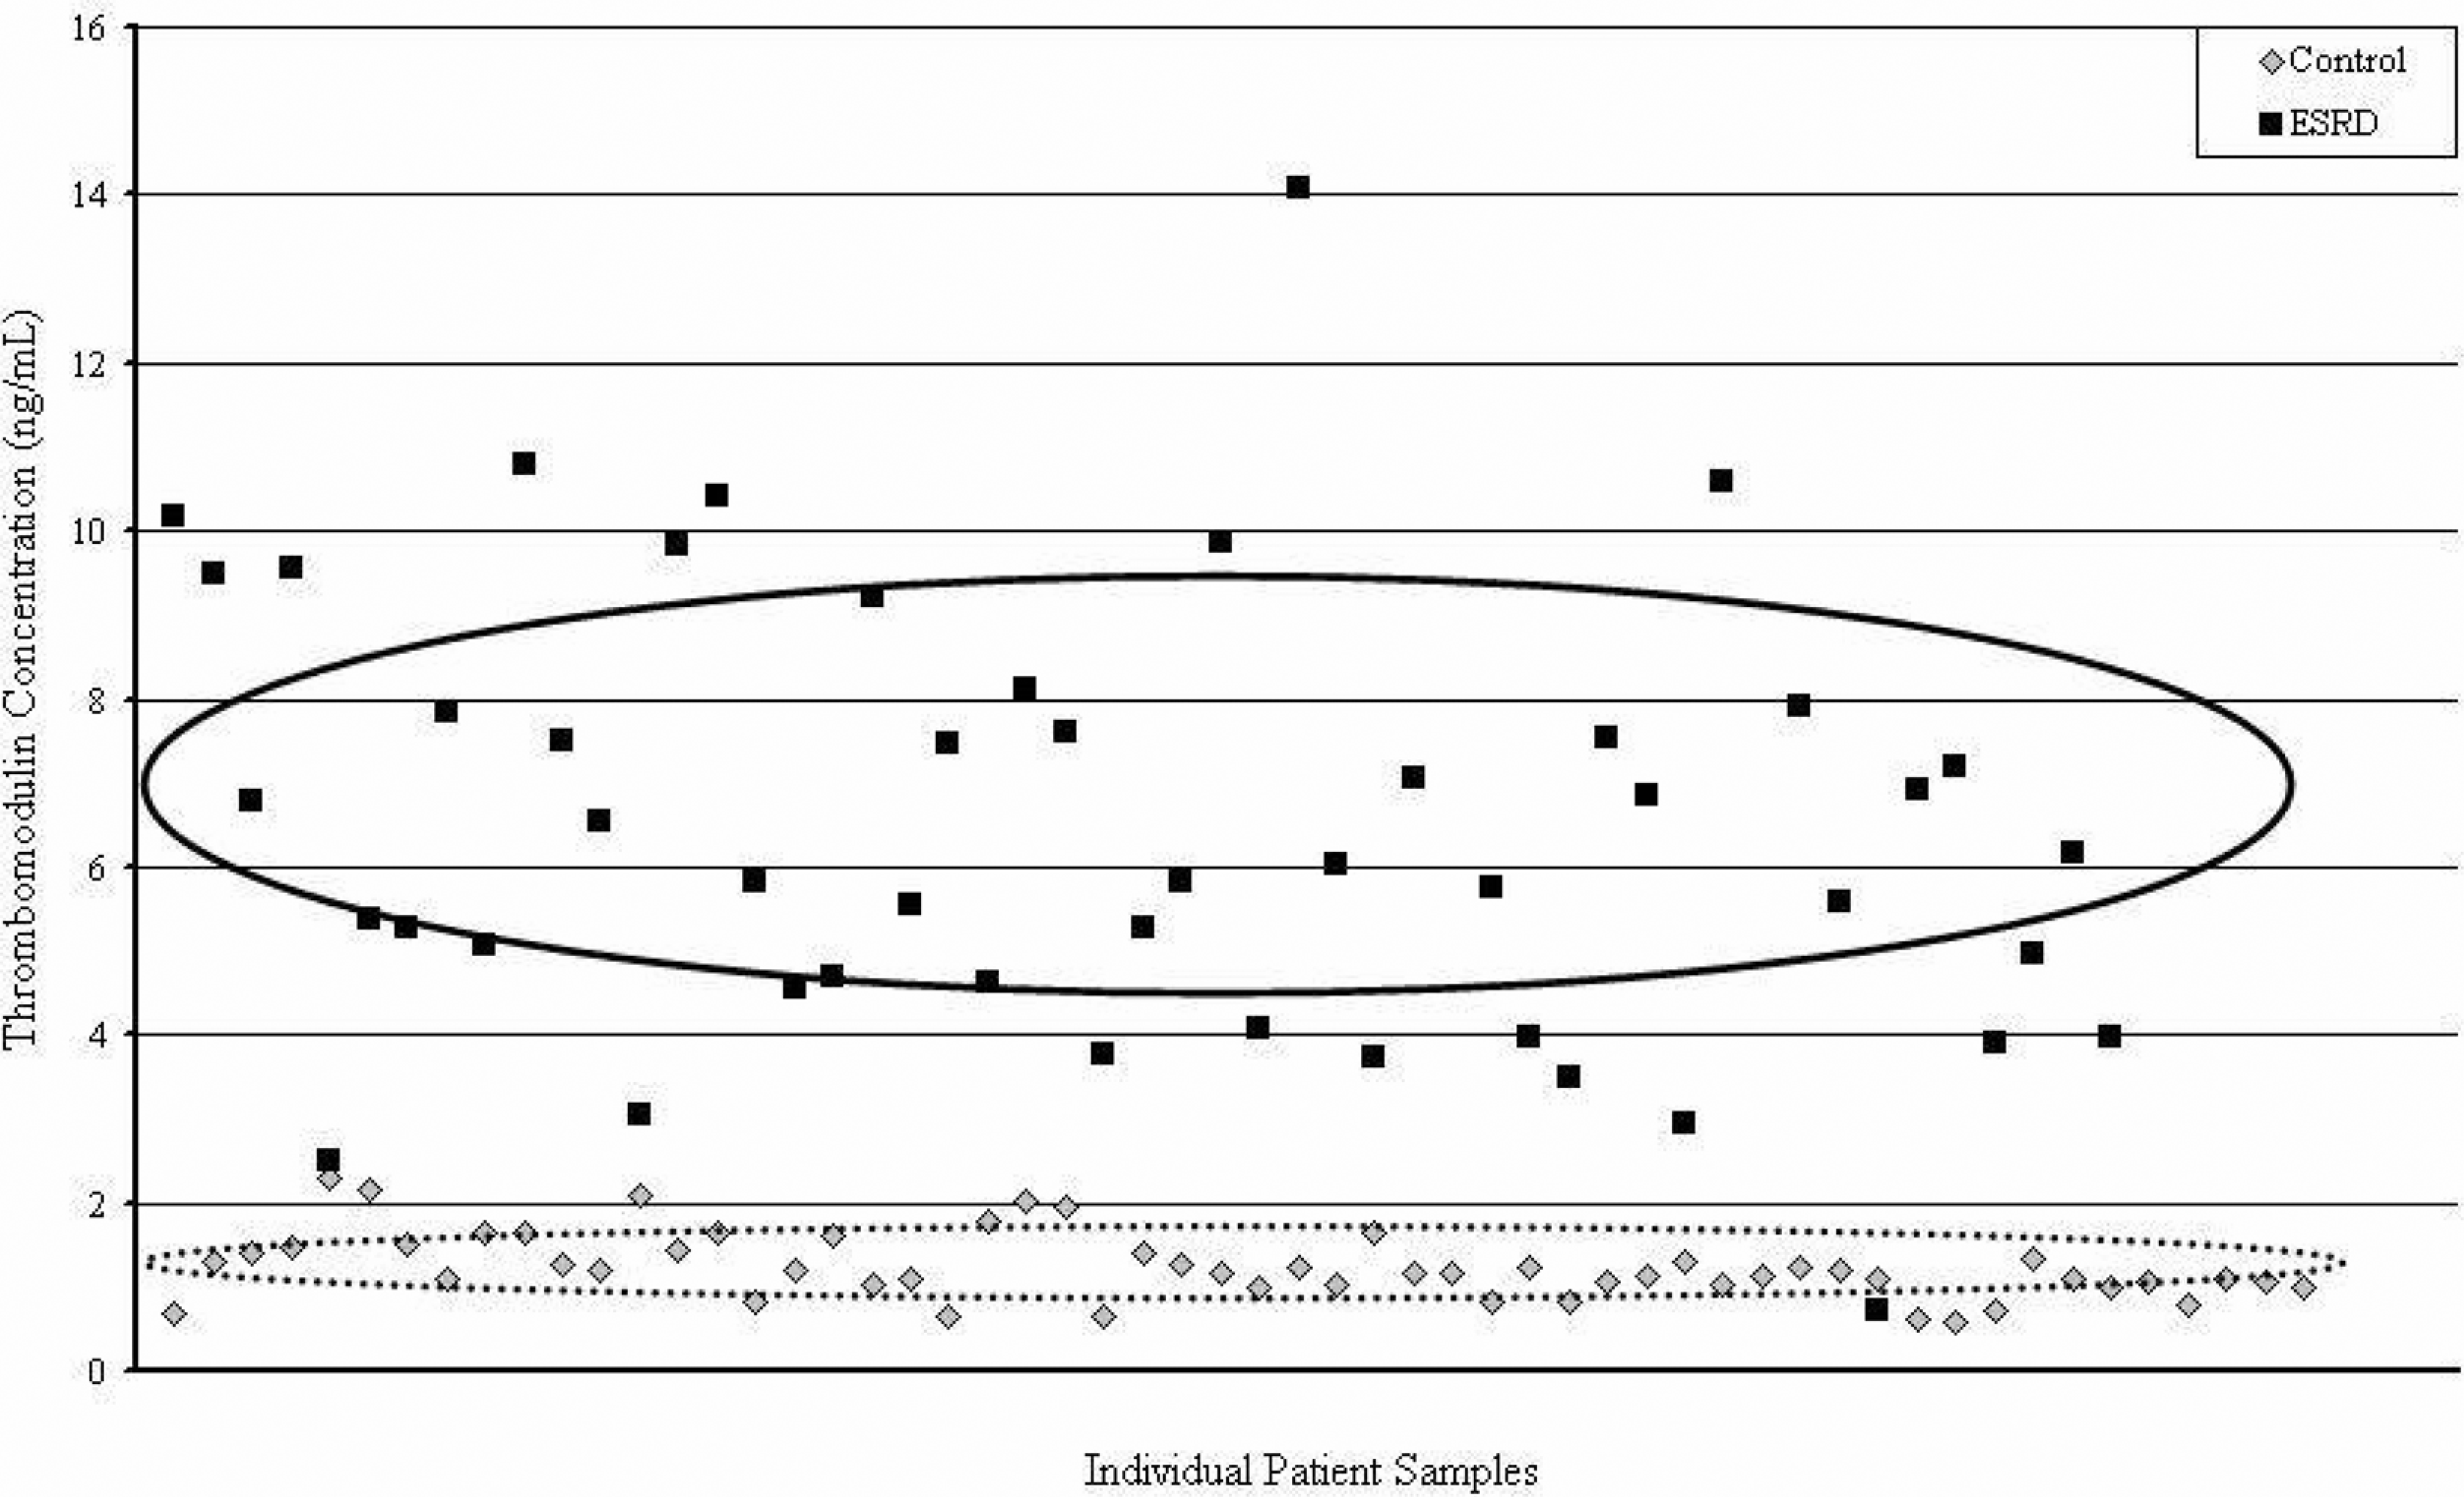
Thrombomodulin concentration in end-stage renal disease (ESRD) and control. The vertical axis plots the concentration of thrombomodulin in both ESRD and control patients. Each patient sample is plotted randomly along the horizontal axis. Ovals represent the area of the mean ± standard deviation. Clear upregulaiton of thrombomodulin is seen with heterogeneity among patients with ESRD.
C-reactive protein, DD, and NSE were increased 4.2-, 3.0-, and 1.8-fold, respectively (Table 1). These values also achieved statistical significance. However, there was drastically more overlap seen between the ESRD and control values in CRP, DD, and NSE compared to TNFR1, TM, and NGAL. Despite the heterogeneity of individual values in CRP and DD, the mean ± the standard deviation of these markers shows a significant difference between the ESRD and control groups. Although the data for NSE yielded a statistically significant result for the difference between ESRD and control patients, there was marked overlap between the groups, with the 95% confidence intervals being 2.5 to 4.8 and 4.9 to 8.3 ng/mL, respectively.
Discussion
This study shows that TNFR1 is the most profoundly elevated plasma marker of inflammation compared to the other markers analyzed in this study. This study has identified TNFR1 as a promising marker for future studies involving ESRD, dialysis patients, and thromboembolic complications of ESRD. Given the degree of elevation of TNFR1 and its known association with myocardial infarctions, 21 this marker has the potential to provide a means of risk-stratifying patients with regard to thromboembolic outcomes.
In addition, TM and NGAL showed upregulation of a high statistical significance. Much like TNFR1, these markers showed pronounced separation from the control values. Furthermore, these markers exhibited heterogeneity, which if correlated with comorbidities and patient outcomes, could also provide a means of risk-stratifying ESRD patients. However, this heterogeneity could also be explained by individual patient variance and disease progression.
Given the upregulation of all 6 inflammatory markers, these results are highly suggestive of a multifactorial pathophysiology for ESRD. The origins of the markers utilized in this study imply the involvement of leukocytes, platelets, endothelial cells, and other tissues in the generation of inflammatory mediators. The elevation of TNFR1 is likely due to a state of increased cellular damage and release of the receptor from the cell membranes. Similarly, TM and DD levels validate the role of endothelial damage and endogenous thrombotic processes in ESRD. However, the interplay between these mediators, and the significance of previous unstudied markers such as NGAL, require further investigation. These results should also be correlated with patient outcomes over time to determine whether the statistically significant marker levels, in fact, has some clinical implication.
The biochip-array technology utilized in this study proved to be a useful method for the simultaneous quantification of NSE, NGAL, TNFR1, DD, TM, and CRP. It allowed for 6 different assays to be performed on a small amount, less than 1 mL, of citrated plasma sample. In addition, the biochip-array required much less time to complete than a standard ELISA method, since all 6 reactions were run simultaneously.
There were several limitations to this study. The sample size of the patients with ESRD and the controls was small. Although these groups provided statistical significance for all of the markers studied, larger groups may help establish a better baseline given the heterogeneity of values for several of the markers. In addition, a control group that is matched to the ESRD group for variables which effect inflammatory markers, such as BMI, smoking, age, and gender, would help give these numbers more validity. Furthermore, the ESRD patient samples were collected at a single point in time and are not controlled for time since diagnosis or time since initiation of dialysis. It is currently unknown what effect, if any, this would have on the degree of marker elevation. Future directions of this study include analyzing the correlation of these biomarkers with thromboembolic endpoints and the time to such events.
Conclusions
Our studies indicate that the pathogenesis of ESRD is complex and not yet fully understood. A mulitparametric analysis of unique biomarkers such as TNFR1, NGAL, and TM along with other mediators will be useful in understanding the mechanisms of ESRD and work toward risk-stratification of patients with ESRD. Furthermore, this information will also be valuable in developing therapeutic interventions.
Footnotes
Oral Presentation of this study was done at the National Student Research Forum, April 23, 2010, Galveston, TX, USA.
Acknowledgments
This research investigation was carried out as an adjunct to a doctorate in medicine with honors in research degree. The author would like to express gratitude toward Dr L Brubaker and Dr R Kennedy for their guidance and mentorship.
The authors declared no conflicts of interest with respect to the authorship and/or publication of this article.
The authors received no financial support for the research and/or authorship of this article.